Initial oxidation of Fe-Al and Fe-Cr-Al alloys: Cr as an alumina booster
Abstract
The boosting effect of Cr on the growth of the protective alumina scale on Fe-Al alloys is investigated by x-ray photoelectron spectroscopy. Using low oxygen pressure the surface chemistry of the alloys is monitored starting from the first moments of oxidation. Chromium effect on the Fe-Al surface-bulk exchange is clearly detected by analyzing the measured surface concentrations within the atomic concentration models. Previous ab initio calculations agree well with the present experiments.
Keywords: Oxidation, Fe-Cr-Al, Surface segrecation, X-ray photoelectron spectroscopy
Fe-Al alloys are frequently used as base materials in high-temperature applications due to their good corrosion resistance which is based on a highly stable and protective Al-oxide scale. Case and van Horn (1953); Khanna (2002, 2005) Due to the brittleness of the high Al alloys there is a need to reduce the Al concentration in the bulk without affecting the Al content at the surface. It is known that adding Cr improves the oxidation resistance of Fe-Al alloys. Tomaszewicz and Wallwork (1978); Prescott and Graham (1992); Stott et al. (1995); Brady et al. (2000); Gurrappa et al. (2000); Babu et al. (2001); Lee et al. (2003); Hou (2003); Wright et al. (2004); Nychka and Clarke (2005); Zhang et al. (2006); Asteman and Spiegel (2008); Niu et al. (2008) To achieve a better technical control to this basically unexplained boosting phenomenon a detailed understanding of its basic atomic mechanisms is indispensable.
In our previous investigations ambient conditions oxidation was used. Then, by successive sputtering and Auger electron spectroscopy (AES), it was possible to construct a time reversed picture of the oxidation. Airiskallio et al. (2010a, b) In the present work we address the direct observation of the first moments of the oxidation of Fe13Al and Fe10Cr10Al (at. % used in alloy formulas) by using x-ray photoelectron spectroscopy (XPS) and low oxygen pressure. By combining our previous AES and present XPS results, complementary in respect to time scales of oxidation, as well as our previous density functional study more detailed description of the oxidation of Fe-Al based alloys can be accomplished.
The alloys were made by induction melting under argon flow from elemental components of purity better than 99.99%. Plates of about 3 mm thick were cut from the ingots and then ground with SiC-paper down to 1000 grit. Final polishing was done with 1 m diamond suspension. The bulk concentrations are shown in Table 1.
| alloy | Fe (at. %) | Al(at. %) | Cr (at. %) |
|---|---|---|---|
| Fe13Al | 87.4 | 12.6 | - |
| Fe10Cr10Al | 79.9 | 9.8 | 10.3 |
Measurements were done with a PHI 5400 spectrometer using twin anode Al K excitation. The pressure in the analyser chamber was Torr during the measurements. The energy scale was calibrated with Ag 3d5/2 (368.2 eV) and Cu 2p3/2 (932.6 eV) lines. Samples were cleaned by repeated cycles of sputtering with 3 keV Ar+ ions and annealing at 700 oC. Sample heating was done by a resistive heater from the rear of the sample. Temperature was measured with a thermocouple in contact with the sample. Cleaning cycle was repeated until no contamination peaks were seen in the XPS spectra. Oxidation of the samples was carried out in a preparation chamber connected to the spectrometer. Oxygen pressure during oxidation was Torr up to 100 L and at higher doses Torr. Atomic concentrations were calculated from the peak areas after Shirley-type background subtraction using sensitivity factors given by the manufacturer of the spectrometer.
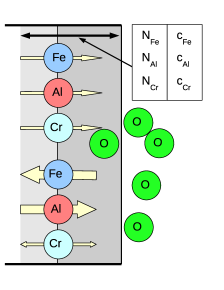
To get more detailed information of the early stage of oxidation the experimental data was analyzed using parameterized models. Our model system (Fig. 1) consists of surface atomic layers up to the probe depth of the XPS. Two oxidation models were introduced and their predictions were compared with the XPS measurements. First model assumes the ratios of the number of different type metal atoms in the model system to be independent on the oxygen dose. This fixed cations ratio (FCR) model describes e.g. cases where cationic diffusion between the surface system and the rest of the alloy does not depend on cationic type or the size of the system changes due to the variations of the XPS probe depth. Another model takes into account atomic processes capable of changing the relative abundances of the metal atoms in the model system. This variable cations ratio (VCR) model describes e.g. cases where diffusion is significant and metal atoms of different type have different diffusion characteristics.
Since we are interested in the very first moments of oxidation it is advantageous to parameterize the number of metal atoms in the model system to be proportional to their initial values
| (1) |
where is the oxygen dose, is the number of atoms of type X = Fe, Cr, Al, and are -dependent parameters. The FCR model corresponds to cases where the parameters are identical whereas all other cases come with the VCR model.
The main features of the FCR and VCR models are visualized in Fig. 1. The analysis is made by optimizing the parameters to give the best fit to the experimental data. The concentrations
| (2) | |||||
corresponding to the optimal parameters are shown in Figs. 2–5. The number of oxygen atoms in Eq. (2) is taken from the experiments.

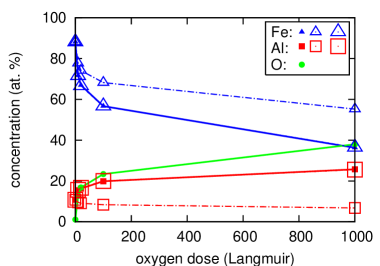
Figures 2–5 show the experimental data (solid curve) and the predictions of the FCR (chain curve, small symbols) and VCR (dashed curve, large symbols) models. At room temperature both models predict the concentrations quite well. The good result of FCR (with zero parameters) indicates that in room temperature there exists no significant long range metal atom diffusion.
The situation is changed dramatically when the temperature is raised up to 700 oC.

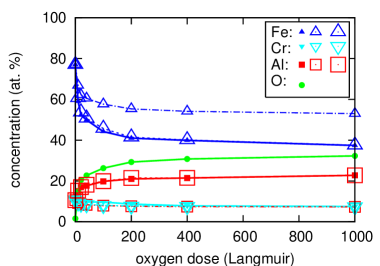
As Figures 3 and 5 show the FCR model fails in the Fe and Al concentrations for both alloys. Contrary to Fe and Al, the Cr concentration (Fig. 5) seems to be quite well predicted by the FCR model. This is in accordance with the low integrated inter-diffusion constant of Cr in (Fe,Cr)3Al2. Tortorici and Dayananda (1998) The optimal VCR result, shown in Figs. 2–5, turns out to be within the Fe-Al exchange regime, i.e.
| (3) |
The optimized VCR parameters are shown in Table 2. Renormalizing with the bulk concentrations the initial surface enrichment of Al () at 700 oC of Fe10Cr10Al is about 30 % higher than that of Fe13Al.
| room temperature | 700 | |||||||
| Fe13Al | Fe10Cr10Al | Fe13Al | Fe10Cr10Al | |||||
| Fe | Al | Fe | Al | Fe | Al | Fe | Al | |
| 10 | 0.05 | 0.14 | 0.65 | 0.66 | ||||
| 100 | 0.13 | 0.24 | 1.39 | 1.51 | ||||
| 1000 | 0.20 | 0.28 | 2.78 | 2.12 | ||||
As Figs. 2–5 show the initial oxidation of Fe10Cr10Al is faster than that of Fe13Al which can be related to the higher Al to Fe ratio of Fe10Cr10Al surface. Clearly Cr boosts the Al surface enrichment leading to faster growth of the protective oxide scale on Fe10Cr10Al. However, this shows up later as reduced oxidation rate because the oxide scale in Fe10Cr10Al has already reached the critical thickness of the protective scale. On the other hand, the Al-oxide scale in Fe13Al seems to be incomplete leading to faster oxidation at practical time scales and finally vulnerability in high temperature applications.
To get more insight to the oxidation of Fe-Al and Fe-Cr-Al we compare the present results with our previous findings on the same subject. The basic atomic phenomena on the backstage of the improved oxidation resistance in Cr-containing Fe-Al alloys can be connected to the local environment induced changes in chemical potentials. Theoretical investigations show that Cr has a potential to activate a kind of Al-pump from the bulk to the surface. Airiskallio et al. (2010a) At 900 K the Al concentration at the surface of Fe5Al is increased from 63 to 72 (81) at.% when 5 (10) at.% Cr is added to the alloy. Airiskallio et al. (2010b) This theoretical prediction is in good agreement with the 30 % increase of the surface enrichment of Al, as indicated by the present XPS data.
Figure 6 shows the calculated chemical potential difference Airiskallio et al. (2010b) and the measured surface oxide type. Tomaszewicz and Wallwork (1978) A curve (open symbols) shows theoretical bulk compositions leading to the same high-temperature Al surface concentrations as the Fe18Al alloy. Surprisingly, this calculated curve separates the good (Al-O) and poor (Fe-O) oxidation resistance regions quite well suggesting that the Al surface concentration has an important effect on the high temperature oxidation resistance. Therefore, the effect of Cr on the high temperature oxidation resistance seems to be indirect via the change of the chemical potentials. The dividing curve in Fig. 6 is obtained iteratively from the equation
| (4) |
where an exponential acceptance criterion for an atomic jump is adopted.

In summary, excellent reproduction of the experimental surface concentrations during the initial oxidation of Fe13Al and Fe10Cr10Al can be obtained by a model of Cr boosted exchange type diffusion of Fe and Al. The present XPS measurements give direct evidence of the accelerated alumina growth on Fe10Cr10Al. 10 % Cr in Fe-Al increases the Al driving force to the surface by about 30 % in initial oxidation.
References
- Case and van Horn (1953) S. L. Case and K. R. van Horn, in Aluminium in Iron and Steel, edited by F. T. Sisco (John Wiley and Sons, Inc., New York, 1953), Alloys of Iron Research Monograph Series.
- Khanna (2002) A. S. Khanna, Introduction to High Temperature Oxidation and Corrosion (AMS International, Materials Park OH, 2002).
- Khanna (2005) A. S. Khanna, in Handbook of Environmental Degradation of Materials, edited by M. Kutz (William Andrew Publishing, Norwich, NY, 2005), pp. 105–152.
- Tomaszewicz and Wallwork (1978) P. Tomaszewicz and G. R. Wallwork, Rev. High Temp. Mater. 4, 75 (1978).
- Prescott and Graham (1992) R. Prescott and M. J. Graham, Oxidation of Metals 38, 73 (1992).
- Stott et al. (1995) F. H. Stott, G. C. Wood, and J. Stringer, Oxidation of Metals 44, 113 (1995).
- Brady et al. (2000) M. P. Brady, B. Gleeson, and I. G. Wright, JOM Journal of the Minerals, Metals and Materials Society 52, 16 (2000).
- Gurrappa et al. (2000) I. Gurrappa, S. Weinbruch, D. Naumenko, and W. J. Quadakkers, Materials and Corrosion 51, 224 (2000).
- Babu et al. (2001) N. Babu, R. Balasubramaniam, and A. Ghosh, Corrosion Science 43, 2239 (2001).
- Lee et al. (2003) D. B. Lee, G. Y. Kim, and J. G. Kim, Materials Science and Engineering A339, 109 (2003).
- Hou (2003) P. Y. Hou, J. Am. Ceram. Soc. 86, 660 (2003).
- Wright et al. (2004) I. G. Wright, R. Peraldi, and B. A. Pint, Mater. Sci. Forum 461-464, 579 (2004).
- Nychka and Clarke (2005) J. A. Nychka and D. R. Clarke, Oxidation of Metals 63, 325 (2005).
- Zhang et al. (2006) Z. G. Zhang, F. Gesmundo, P. Y. Hou, and Y. Niu, Corrosion Science 48, 741 (2006).
- Asteman and Spiegel (2008) H. Asteman and M. Spiegel, Corrosion Science 50, 1734 (2008).
- Niu et al. (2008) Y. Niu, S. Wang, F. Gao, Z. G. Zhang, and F. Gesmundo, Corrosion Science 50, 345 (2008).
- Airiskallio et al. (2010a) E. Airiskallio, E. Nurmi, M. H. Heinonen, I. J. Väyrynen, K. Kokko, M. Ropo, M. P. J. Punkkinen, H. Pitkänen, M. Alatalo, J. Kollár, et al., Phys. Rev. B 81, 033105 (2010a).
- Airiskallio et al. (2010b) E. Airiskallio, E. Nurmi, M. H. Heinonen, I. J. Väyrynen, K. Kokko, M. Ropo, M. P. J. Punkkinen, H. Pitkänen, M. Alatalo, J. Kollár, et al., Corrosion Science 52, 3394 (2010b).
- Tortorici and Dayananda (1998) P. C. Tortorici and M. A. Dayananda, Materials Science and Engineering A244, 207 (1998).