Electronic and phononic properties of the chalcopyrite CuGaS2
Abstract
The availability of ab initio electronic calculations and the concomitant techniques for deriving the corresponding lattice dynamics have been profusely used for calculating thermodynamic and vibrational properties of semiconductors, as well as their dependence on isotopic masses. The latter have been compared with experimental data for elemental and binary semiconductors with different isotopic compositions. Here we present theoretical and experimental data for several vibronic and thermodynamic properties of CuGaS2, a canonical ternary semiconductor of the chalcopyrite family. Among these properties are the lattice parameters, the phonon dispersion relations and densities of states (projected on the Cu, Ga, and S constituents), the specific heat and the volume thermal expansion coefficient. The calculations were performed with the ABINIT and VASP codes within the LDA approximation for exchange and correlation and the results are compared with data obtained on samples with the natural isotope composition for Cu, Ga and S, as well as for isotope enriched samples.
pacs:
63.20.-e, 63.20.dk, 63.20.D-, 68.35.bg, 65.40.Ba, 71.55.Gs, 71.70.EjI Introduction
The availability of ab initio electronic calculations and the concomitant techniques for deriving the corresponding lattice dynamics have been profusely used in the past decade for calculating thermodynamic and vibrational properties of semiconductors, as well as their dependence on isotopic masses. The latter have been compared with experimental data for elemental and binary semiconductors with different isotopic compositions.Sanati2004 ; Gibin2005 ; Cardona2010a Here we present theoretical and experimental data for several vibronic and thermodynamic properties of a canonical ternary semiconductor of the chalcopyrite family: CuGaS2. Two main groups of chalcopyrites are usually considered, one, denoted as I-III-VI2, derived from the II-VI compounds with zincblende structure, the other, II-IV-V2 , derived from the III-V zincblende compounds. Examples of the first group are CuGaS2 and AgGaS2, whereas the second type is represented, for example, by ZnGeAs2. The chalcopyrite structure has the space group 2 and the class 2 with two formula units per primitive cell and a longitudinal distortion along the -axis which converts the tetrahedral primitive cell (PC) into a tetragonal one. The lattice constants of the tetragonal PC are = (along and ) and (along ).Jaffe1984 The regular tetrahedra with the anion at the center and the cations at the vertices are distorted because, e.g., of the different lengths of the I-II and the III-II bonds. The anion distortion is usually chosen to be along the direction and equal to - 1/4, = 1/4 corresponds to no tetrahedral distortion. In this article we discuss lattice parameters and vibrational properties of some I-III-VI2 chalcopyrites (I = Cu, Ag). The motivation for this choice (as opposed to the II-VI-V2 materials) is that the copper and silver chalcopyrites have received considerable attention for the production of photovoltaic cells. Their energy gaps cover the range 1 - 3.5 eV, i.e., most of the frequency of the solar spectrum. From the fundamental point of view, these materials have the property that the 3 core electrons of Cu and the 4 of Ag overlap (and thus hybridize) with the top of their valence bands, and thus giving rise to a number of interesting anomalies involving negative spin orbit splittings (-0.016 eV for CuGaS2, (Ref. Horinaka1978, ) and nonmonotonic behavior of the energy gap versus temperature.Serrano2002
In this article we focus on the chalcopyrite CuGaS2. These sulfides, CuInS2 and the corresponding selenides are being considered, together with their alloys, as efficient photovoltaic materials. From the fundamental point of view CuGaS2 has received less attention than the other related chalcopyrites, a reason why here we concentrate on the physical properties of this material. CuGaS2 was first synthesized by Hahn et al..Hahn1953 They also determined by X-ray diffraction the crystal structure and the lattice parameters = , , and of this and 19 other related chalcopyrite compounds. Many of this parameters agree reasonably well with those determined experimentally up to date and also with recent ab initio calculations. CuGaS2 was first found as a mineral (gallite) in Namibia and in the Kongo.Strunz1958 ; Strunz1959
CuGaS2 crystallizes with the chalcopyrite structure which is closely related to that of zincblende with a slight distortion resulting from the tetrahedral bonding of the latter.Hahn1953
II Theoretical Details
The calculations reported here concern the lattice parameters of CuGaS2, the Raman, ir active, and silent = 0 phonons , their Grüneisen parameters and the phonon dispersion relations, the densities of phonon states (DOS) (including the projections on the vibrations of the 3 component atoms), and the optically active densities of two-phonon states. In addition, we present ab initio calculations of the elastic constants and the bulk moduli and ′ . Because of the large number of phonon at = 0 (24) we surmised that for a calculation of the volume expansion coefficient vs. a BZ sampling using only the 24 Grüneisen parameters of these phonons (at 0) would yield a reasonable approximation to the scarce experimental results available. This conjecture turned out to be correct. Finally, we used the calculated phonon density of states (PDOS) to evaluate the specific heat at constant volume (and the expansion coefficient to evaluate the measured constant pressure counterpart). These calculations were performed with the natural isotopic abundance of the constituents of CuGaS2 and also for crystals composed of isotopically pure atoms.
The calculations were based on ab initio electronic band structure determinations using density functional theory with either the ABINIT or the VASP code.Gonze2002 ; Gonze2009 ; Kresse1996 ; Kresse1999 In the ABINIT calculation, normalized pseudo potentials were generated by using the Fritz Haber Institute code with a valence electron configuration of 3 4 for Cu, 3 4 4 for Ga and 3 3 for S.Fuchs1999 The wave function was expanded in plane wave up to an energy cutoff of 40 Ha and the Brillouin zone was sampled by using the Monkhorst-Pack method with a 6 6 6 k-point grid. While most electronic calculations were performed without spin-orbit (SO) interaction, in order to reveal possible effects of this interaction on the lattice properties as well as the negative sign of the SO splitting at the top of the valence band, a few band structure calculations with the VASP code including SO interaction were also performed. The effects of this interaction on the lattice parameters and dynamics was found to be insignificant. We display in Fig. 1 the electronic band structure calculated with the VASP code using the LDA exchange- correlation potential without SO interaction. The details of the ab initio electronic band structure calculations have been given in Ref. Cardona2010b, .
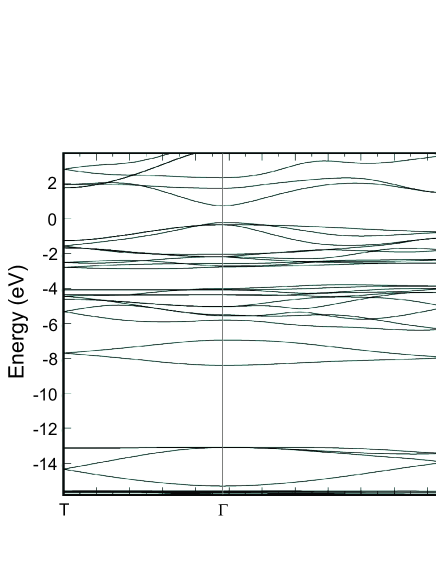
This band structure is similar to those reported recently by Soni et al. and Brik using a GGA exchange-correlation potential.Soni2010 ; Brik2009 Notice that in our case and that of Soni et al. the direct gap (1 - 2 eV) is considerably smaller than the experimental one (2.43 eV), a rather general property of LDA calculations sometimes referred to as the ”gap problem”.Godby1988 Brik brought the calculated gap to agree with the experimental one by using the so-called ’scissors operator’.Brik2009
An interesting feature of the band structures of Fig. 1 and Ref. Soni2010, is the fact that the bands which correspond to the 3 electrons of the copper overlap with the 2 bands of sulfur. This peculiarity results in a negative SO splitting at the top of the valence bands (-0.016 eV) (Ref. Bell1975, ), an anomalous sign also observed in CuCl (Ref. Shindo1945, ), ZnO (Ref. Carrier2004, ), and -HgS (Ref. Carrier2004, ; Cardona2009a, ). Here we shall no longer discuss electronic properties of chalcopyrites and concentrate on the lattice parameters, phonons and thermodynamic properties.
The reader may wonder why we use two different DFT codes. The reason is that we are familiar with both codes and, while we know that they lead to similar results in the case of monoatomic and binary crystals, it is not obvious that they also will do so for more complicated structures. This was shown to be so in the case of cinnabar (- HgSCardona2009a ), with three atoms per PC. Here we examine chalcopyrites, with 8 atoms per PC.
The wave function representation for the two codes is different as well as the methodology e. g. to calculate the phonon vibrational spectra. Therefore, the use of both codes is complementary. In some cases, the ABINIT code is more computationally demanding but the precision can be increased. Therefore, for some properties, such as the phonon spectra, we have employed the ABINIT implementation where density functional perturbation theory was used.Gonze1997a ; Gonze1997b
III Experimental Details
The CuGaS2 crystals investigated here were grown by a vapor phase transport technique using iodine as transport agent. The isotopically nearly pure (99.5% 34S, 99.9% 63Cu and 99.6% 72Ga) elements were purchased from Trace Science International, Ontario, Canada.
For the single crystal X-ray structure determination CuGaS2 crystals were selected under the polarization microscope for crystallographic investigations. As many of the crystals showed twinning according to , with 1 being the identity operation, a small cuboid fraction (0.24 0.20 0.14 mm3) of a yellow transparent crystal was oriented on a four-circle diffractometer using graphite-monochromatized Ag-K radiation (CAD 4, Enraf Nonius, Delft, The Netherlands). The lattice parameters of the tetragonal lattice (space group I4̄2d, No. 122) were refined from 25 centered high-indexed reflections to a = 5.3512(6) and c = 10.478(3) Å. Bragg intensities in three octants of the Ewald sphere (-9 h, k 9, -18 l 18, 3.4o 29.9o, Rint = 0.0648 after merging) were collected in the - data acquisition mode and corrected for Lorentz, polarization and absorption effects. The structure refinement was performed with full matrix least-squares cycles on F2 (R1 = 0.0472 for I 2 I and 0.0832 for all I, wR2 = 0.1178 for I 2 I and 0.1350 for all).FIZ2010
Temperature dependent lattice parameters and the thermal expansion coefficients were determined by powder X-ray diffraction ( = 1.54 Å) on crushed crystals grown from elements with the natural isotopic abundance.
The heat capacities were measured on samples of typically 20 mg between 2 and 280 K with a physical property measurement system (Quantum Design, San Diego, CA) as described in detail in Ref. Serrano2006, . Between room temperature and 1100 K the heat capacities of a 100 mg polycrystalline sample were determined with a DSC 404 F1 Pegasus differential scanning calorimeter (heating rate 20 K/min) with the sample kept in an argon atmosphere. Netzsch Up to 1100 K a reduction of the sample mass was not observed.
IV Results and Discussion
IV.1 Crystal Structure
The available structural parameters of CuGaS2 exhibit considerable dispersion, especially the positional parameter of the S atoms which is very close to 1/4 (in the forthcoming called ) has so far been determined with limited reliability and found to be larger than 1/4. Additionally, has been found to vary non-monotonically from CuAlS2, via CuGaS2 to CuInS2.Jaffe1984 In order to increase the accuracy of we redetermined the crystal structure of CuGaS2 using high-quality single crystals and up-to-date X-ray diffraction techniques which allow us to decrease the experimental error in by a factor of 7. Table 1 summarizes the results of our crystal structure redetermination.
| Fractional atomic coordinates and equivalent isotropic displacement parameters (Å2) | ||||||
|---|---|---|---|---|---|---|
| Atom | Wyckoff-Nr. | x | y | z | Uequiv | |
| Ga | 4a | 0 | 0 | 0 | 0.0078(4) | |
| Cu | 4b | 0 | 0 | 0.0159(4) | ||
| S | 8d | 0.2437(5) | 0.0085(4) | |||
| Anisotropic displacement parameters (Å2) | ||||||
| Atom | U11 | U22 | U33 | U12 | U13 | U23 |
| Ga | 0.0080(4) | 0.0080(4) | 0.0076(5) | 0 | 0 | 0 |
| Cu | 0.0155(5) | 0.0155(5) | 0.0165(6) | 0 | 0 | 0 |
| S | 0.0113(11) | 0.0051(10) | 0.0092(6) | 0 | 0 | -0.0016(5) |
The positional parameter is clearly smaller than 1/4 ( -2.5%) and decreases monotonically throughout the series CuAlS2 - CuGaS2 - CuInS2. Table 2 summarizes the experimental and calculated structural parameters of CuXS2 (X = Al, Ga, In) as obtained from our calculations and as available in the literature.
| parameter | CuAlS2a | CuGaS2 | CuInS2a | |||
|---|---|---|---|---|---|---|
| VASP | exp | VASP | exp | VASP | exp | |
| = (Å) | 5.2055 | 5.326 | 5.226 | 5.3512(6) | 5.482 | 5.5221 |
| (Å) | 10.3765 | 10.436 | 10.380 | 10.478(3) | 10.9301 | 11.1043 |
| 0.2505 | 0.271 | 0.2450 | 0.2437(5) | 0.21651 | 0.2145 | |
| a Ref. Zunger1983, and average values of references therein. | ||||||
Since the available calculations did not include SO splitting we performed, for comparison, calculations with SO splitting. They are displayed in Table 3 together with a VASP-NOSO calculation carried out by Chen et al.Chen2007 using a GGA DFT for the exchange-correlation hamiltonian.
| code | (Å) | (Å) | (Å3) | (GPa) | ′ | |
|---|---|---|---|---|---|---|
| ABINIT-NOSO | 5.262 | 10.45197 | 0.244 | 289.4 | 93.3 | 4.7 |
| VASP-NOSO-LDA | 5.226 | 10.380 | 0.2450 | 283.5 | 94.3 | 4.5 |
| VASP-SO-LDA | 5.2258 | 10.3818 | 0.2450 | 283.5 | 91.9 | 5.1 |
| VASP-NOSO-GGAa | 5.3700 | 10.643 | 0.2491 | 306.9 | 85 | 4.7 |
| a Ref. Chen2007, | ||||||
IV.2 Elastic Properties
The ABINIT code used for our calculations provides also the stiffness constants, ,Hamann2005 six independent ones in the case of the chalcopyrites (Table LABEL:Table4).
| parameter | CuGaS2 | CuGaSe2 | AgGaS2 | |||
|---|---|---|---|---|---|---|
| calc | exp | calc | exp | calc | exp | |
| (GPa) | 132.23 | - | 112.2a | - | 85.3b | 86.5b |
| (GPa) | 78.4 | - | 66.4a | - | 52.4b | 56.0b |
| (GPa) | 79.4 | - | 68.1a | - | 59.9b | 59.6b |
| (GPa) | 144.1 | - | 113.2a | - | 76.2b | 75.1b |
| (GPa) | 56.1 | - | 48.4a | - | 32.4b | 24.9b |
| (GPa) | 56.3 | - | 48.5a | - | 36.1b | 31.4b |
| 96.4 | 94c, 96d, 97e | 83a | 102a | 60d, 62.3b | 72.2b | |
| ′ (GPa) | 4.5 | 6.3d, 4e | - | - | 4.2b | 4b |
| a Ref. Parlak2006, | ||||||
| b Ref. Hou2010, : average values of references therein. | ||||||
| c Ref. Bettini1975, | ||||||
| d Ref. Werner1981, | ||||||
| e Ref. Tinoco1994, | ||||||
We have not been able to retrieve experimental values for these from the literature. In Table LABEL:Table4 we display for comparison data for CuGaSe2 and AgGaS2. For the latter experimental data are also quoted. We have also included bulk modulii, , and their pressure derivative, ′, for all three compounds. Except for ′, all elastic parameters undergo a monotonic decrease through the series CuGaS2, CuGaSe2 to AgGaS2, which is likely to be related to the corresponding increase of the lattice parameters.
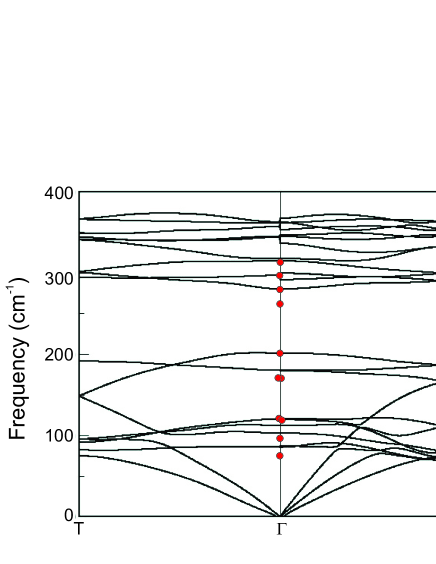
The calculated phonon dispersion relations are shown in Fig. 2 in the reduced Brillouin zone. The - T direction corresponds to [001] whereas - N corresponds to [110].Shileika1973 For comparison, we have added a few points obtained from Raman and infrared spectroscopy measurements given in more detail in Table LABEL:Table5 where they are also compared with our ab initio calculations and those of Akdoǧan et al..Carlone1980 ; Akdogan2002
| irred. | Akdoana | ours | ours | |||
|---|---|---|---|---|---|---|
| reps. | theory | ABINIT | VASP | exp.a | ABINIT | expb |
| (A1) | 290.0 | 292 | 316.8 | 312 | 2.04 | 1.5 |
| (A2) | 341.7 | 314 | 345.0 | silent | 1.62 | |
| (A2) | 268.7 | 345 | 314.0 | silent | 1.68 | |
| (B1) | 329.7 | 361 | 361.2 | 372 | 1.62 | |
| (B1) | 195.7 | 203 | 202.7 | 202 | 1.31 | 2.6 |
| (B1) | 99.0 | 114 | 114.0 | 117 | 0.47 | |
| (B2) | 384.7 | 381.8 | 361.9 | 387 | 1.54 | 1.5 |
| (B2) | 234.3 | 292.0 | 280.2 | 277 | 2.04 | 1.3 |
| (B2) | 99.0 | 104.7 | 103.6 | 95 | 0.10 | |
| (B2) | 354.0 | 365.4 | 361.9 | 366 | 1.54 | 1.4 |
| (B2) | 234.3 | 280.2 | 280.2 | 261 | 2.07 | 1.3 |
| (B2) | 98.7 | 103.6 | 103.6 | 95 | 0.10 | 2.0 |
| (E) | 367.0 | 361.2 | 352.6 | 387 | 1.58 | 1.3 |
| (E) | 327.7 | 344.9 | 335.5 | 350 | 2.00 | |
| (E) | 240.6 | 292.1 | 292.1 | 277 | 2.03 | 1.1 |
| (E) | 162.3 | 180.7 | 180.7 | 169 | 1.85 | 1.5 |
| (E) | 116.6 | 119.4 | 119.4 | 148 | -1.04 | 0.8 |
| (E) | 83.3 | 86.2 | 86.1 | 74 | -1.04 | -0.80 |
| (E) | 345.7 | 352.6 | 352.6 | 365 | 1.65 | 1.5 |
| (E) | 313.3 | 335.5 | 335.5 | 331 | 2.04 | 1.2 |
| (E) | 236.0 | 292.1 | 292.1 | 292 | 2.07 | 1.41 |
| (E) | 161.6 | 180.7 | 180.7 | 162 | 1.86 | 0.8 |
| (E) | 116.7 | 119.4 | 119.4 | 115 | -0.08 | |
| (E) | 83.3 | 86.2 | 86.1 | 75 | -1.04 | -0.80 |
| a Ref. Akdogan2002, | ||||||
| b Ref. Carlone1980, |
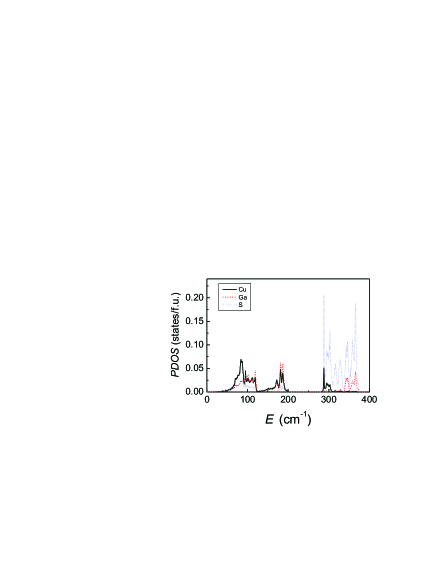
Figure 3 displays the phonon densities of states corresponding to the motion of the three constituent atoms calculated from the dispersion relations shown in Fig. 2. As expected, the low-frequency band 0 - 100 cm-1 corresponds mainly to Cu and Ga vibrations whereas the S-like contributions are mainly above the 280 cm-1-gap. we note that there are also some S-like contributions below 120 cm-1 originating from Cu - S vibrations. The partial densities of states are e.g. useful for calculating the effect of isotope disorder on the phonon linewidths.Serrano2004a
We have not found in the literature second-order Raman spectra of CuGaS2 which would correspond to the sum and difference spectra of Fig.2. Nevertheless, it is possible to establish a correspondence between the calculated two-phonon Raman spectra of CuGaS2 and (Fig.3) and the measured ones of -ZnS shown in Fig. 1 of Ref. Serrano2004b, . We present here the calculated sum and difference densities of states of CuGaS2 in the hope that they will help in interpreting measured spectra when they become available for the CuGaS2 or other chalcopyrite compounds.
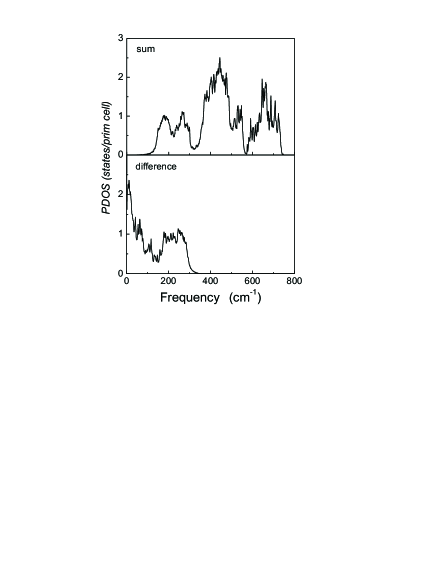
Table LABEL:Table5 also lists the calculated and experimental Grüneisen parameters of -point phonons. As usual, most of the the Grüneisen parameters are positive except some at the lowest frequencies.
The effect of lattice vibrations on the volume of a (cubic) crystal can be expressed in terms of the mode Grüneisen parameters and the mode frequency as
| (1) |
where is the Bose-Einstein factor
| (2) |
and and are the volume and the bulk modulus of the crystal, respectively. Cardona2005
Because of the large number of phonon bands we surmised that the Grüneisen parameters of the phonons at suffice, to a first approximation, for the evaluation of the volume thermal expansion coefficient, = (1/) d/d , to include in the summation in Eq. (3) the phonons and their Grüneisen parameters at the -point, where represents the volume of the primitive cell. As usual in semiconductors, negative values of lead to negative thermal expansion coefficients at low temperatures.Debernardi1996 The temperature dependence of is given by
| (3) |
where and are the zone-center phonon frequencies and the Grüneisen parameter, respectively.
The volume thermal expansion coefficient can also be obtained from the variation of the entropy, , with pressure via the thermodynamic relationship
| (4) |
We calculated within the ABINIT code the entropy at ambient pressure and for pressures of 0.4 and 1 GPa and took the numerical derivatives. In Fig. 5 we compile these results and the the results of our calculations using the -point phonon frequencies and the mode Grüneisen parameters summarized in Table LABEL:Table5 (and its temperature derivative), i.e. the volume thermal expansion coefficient, = () , with literature data by Bodnar et al., Schorr et al., and with our high temperature X-ray data. For comparison we also display the volume thermal expansion coefficient of Reeber and Powell et al..Bodnar1983 ; Schorr2008 ; Reeber1967
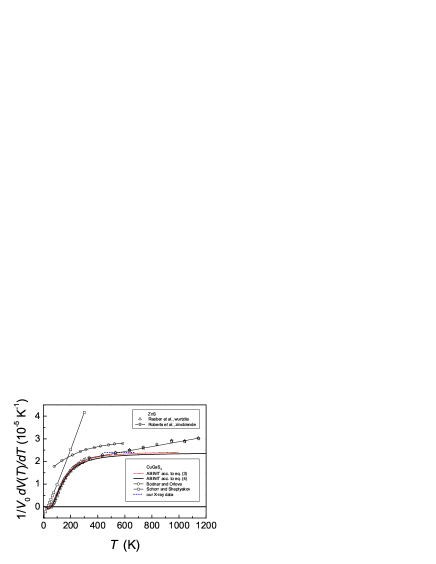
The volume thermal expansion coefficients obtained from the -point phonon frequencies and from the pressure-derivative of the entropy are in good agreement, thus justifying the approximation used in eq. (3). The results of our calculations clearly reveal a negative thermal volume expansion coefficient at low temperatures as has been found experimentally by Schorr and Scheptyakov.Schorr2008 However, at high temperatures our calculated data deviate markedly from the experimental findings, they are about 15% lower than the data by Bodnar and Orlova obtained by X-ray diffraction experiments.Bodnar1983 However, there still appears to be some scatter in the experimental data. While Bodnar et al. report a room temperature volume thermal expansion coefficient of 2410-6K-1 close to 26.510-6K-1 obtained by Yamamoto et al., Malsagov et al. found a room temperature value of only 19.210-6K-1, close to the results of our calculations.Bodnar1983 ; Yamamoto1979 ; Malsagov1986 Our calculations also agree rather well with our high-temperature X-ray diffraction data carried out on a polycrystalline sample prepared from the same crystals used for the heat capacity experiments (see below). The temperature dependence of the volume thermal expansion coefficient for CuGaS2 is expected to be similar to that of the isobaric and isoelectronic ZnS. This is indeed the case; up to room temperature our calculations coincide remarkable well with volume thermal expansion data for ZnS obtained by Reeber and Powell.Reeber1967 Above room temperature Roberts et al. observed a linear increase of the volume thermal expansion coefficient of zincblende ZnS at a rate of 1.1610-8K-2 which is not found in our calculations for CuGaS2.Roberts1981 This linear increase of the volume thermal expansion coefficient of wurtzite ZnS and zincblende ZnS has recently also been obtained by ab initio calculations.Wang2006
IV.3 Heat Capacity
The phonon density of states displayed in Fig. 3 allows calculation of the free energy by using the expression:
| (5) |
and of the specific heat at constant volume by taking the second derivative of the free energy
| (6) |
In Eq. (5), is the Boltzmann constant, the Bose-Einstein factor, and the phonon density of states. The high frequency cutoff of the latter defines the upper limit of integration in Eq. (5).
The difference between the calculated heat capacity at constant volume, , and that at constant pressure, , (the quantity that is experimentally obtained) is related to the volume thermal expansion coefficient, , according to
| (7) |
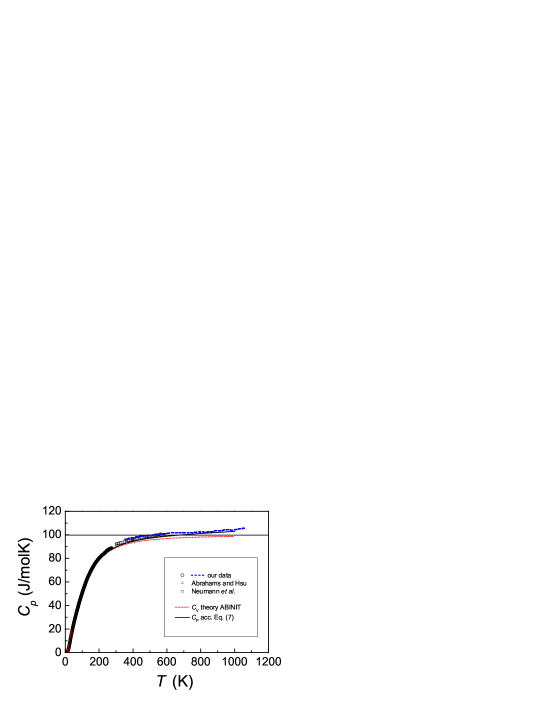
where is the (isothermal) bulk modulus and the molar volume. With the contribution to the heat capacity from thermal expansion amounts to 0.7 J/molK and 2.3 J/molK at 300 K and 1000 K, respectively.
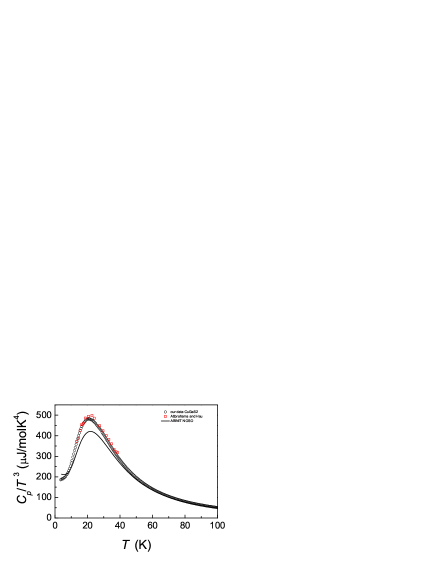
In the literature heat capacity data for CuGaS2 are available in the low temperature regime (13 K 38 K) and above room temperature up to 600 K.Abrahams1975 ; Neumann1987 Our data connect these temperature regimes and extend the temperature range up to 1100 K. At low temperature our results are in good agreement with the data of Abrahams and Hsu with improved resolution of the maximum in (cf. Fig. 7), at high temperatures they connect well to the data by Neumann et al.. In Fig. 6 we display the heat capacity of CuGaS2 over a temperature range from 2 K up to 1100 K together with the theoretical results based on the PDOS shown in Fig. 3. To account for the contributions of the thermal expansion, becoming especially noticeable above room temperature, we have used our data of the volume thermal expansion coefficient extended by a linear increase above room temperature of 1.1610-8K-2, identical to that found by Roberts et al. for zincblende ZnS.Roberts1981 as displayed in Fig. 5 and used Eq. (7) to calculate .
In some of our previous worksRomero2008 ; Cardona2010b we have investigated the dependence of on the isotopic masses of the constituents of the compounds (up to binary compounds, so far) and compared the experimental data with the theoretical results. For elementary and binary compounds we have also investigated the relationship of the logarithmic derivatives versus temperature and versus the masses of the constituents.Romero2008
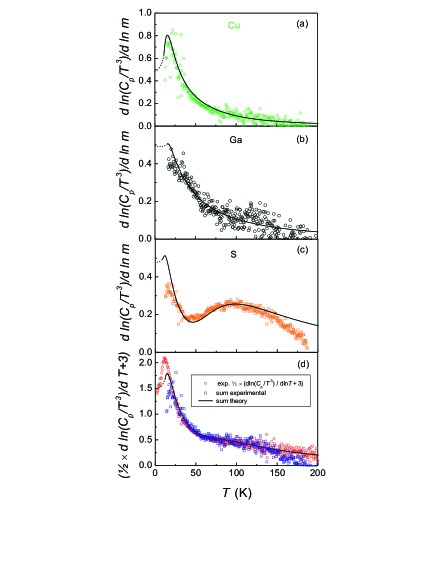
In all logarithmic derivatives we observe a peak centered at about 20 K. For S there is an additional broad band with its maximum at about 100 K. The maxima in the logarithmic derivatives reflect the structure of the PDOS projected on the corresponding atoms. Clearly, the broad high energy feature visible exclusively for S originates from the PDOS with mainly S character between 280 and 380 cm-1. The ratio of the maximum frequency (converted into Kelvin) in the PDOS and the maximum temperature of the logarithmic derivative is 6, a ratio which has been found in a number of previous investigations.Cardona2010b Cu shows the highest feature in the logarithmic derivative at low temperature reflecting the high weight of the Cu projected PDOS at low energies.
We have demonstrated that there is a close relationship of the logarithmic derivatives of the heat capacities with respect to temperature and isotope mass.Cardona2007 The straightforward extension of the relationship the logarithmic derivatives versus temperature and versus the masses of the isotopes to the ternary compound, CuGaS2 in our case, is given by
| (8) |
where , , and are the masses of the three constituents, i.e. Cu, Ga, and S, respectively, for CuGaS2.
Figure 8 confirms the relationship of the temperature dependence of the logarithmic derivatives with respect to temperature and to the isotope masses established earlier by us is also valid for multinary (in the present case ternary) compounds.
We have demonstrated that for low temperatures, 0, the logarithmic derivatives are related to the ratios of the atomic mass to the molar mass according to Romero2008
| (9) |
| (10) |
| (11) |
In the case of CuGaS2 these three ratios are, fortuitously, approximately equal to 0.5.
V Conclusions
Ab initio electronic band-structure techniques, especially those which use up-to-date computer codes like VASP or ABINIT, are powerful methods to investigate electronic, optical, vibronic and thermodynamic properties of crystals and the results with experimental data. Here we apply these techniques to CuGaS2 which has chalcopyrite structure (space group 2 (No. 122), two molecules per primitive cell.) more complicated than those usually dealt with. We used the ABINIT code to calculate the frequencies of Raman and IR phonons and their dispersion relations. The densities of states of one and two phonons have also been calculated. We devote the last section to present experimental data on the specific heat versus temperature of samples grown with the natural isotopic abundances and those grown with isotopically modified ones. These results are compared with ab initio calculations. Generally, good agreement between experiment and ab initio results is obtained. A redetermination of the crystal structure parameters is presented which decreases the discrepancies with experimental data apparent in the literature. The peaks of the Cu and Ga mass derivatives in Fig. 8 are at similar temperatures. In the process of measuring AgGaS2 wherein the masses of the two cations are considerably different we observe a clear difference of the low temperature phonon spectrum related to the differences of the atomic masses of Ag and Ga.
Acknowledgements.
AHR has been supported by CONACYT Mexico under projects J-83247-F, Binational Collaboration FNRS-Belgium-CONACYT and PPPROALMEX-DAAD-CONACYT. A. M. acknowledges the financial support from the Spanish MCYT under grants MAT2010-21270-C04-03, CSD2007-00045 and the supercomputer resources provides by the Red Española de Supercomputacin. We are grateful to Y. Pouillon and O. Castillo for valuable technical and computational support. We are also indebted to E. Kotomin for a critical reading of the manuscript.References
- (1) M. Sanati, S. K. Estreicher, and M. Cardona, Solid State Commun. 131, 229 (2004)
- (2) A. Gibin, G.G. Devyatykh, A.V. Gusev, R.K. Kremer, M. Cardona, and H.-J. Pohl, Sol. State Comm. 133 569 (2005).
- (3) M. Cardona, R. K. Kremer, R. Lauck, G. Siegle, A. Muñoz, and A. H. Romero, and A. Schindler, Phys. Rev. B 81 075207 (2010).
- (4) J.E. Jaffe and A. Zunger, Phys. Rev. B 28, 5822 (1983).
- (5) H. Horinaka, Y, Yamamoto, and T. Miyauchi, Jap. J. Appl. Phys 17, 521 (1978).
- (6) J.Serrano, Ch. Schweitzer, C.T. Lin, K. Reimann, M.Cardona, and D. Fröhlich, Phys. Rev. B 65, 125110 (2002).
- (7) H. Hahn, G. Frank, W. Klingler, A. D. Meyer, G. Stoerger, Z. Anorg. Allg. Chem. 271, 153 (1953).
- (8) H. Strunz, B. H. Geier, E. and Seeliger, Neues Jahrbuch für Mineralogie, Monatshefte 241 (1958).
- (9) H. Strunz, B. H. Geier and E. Seliger, Am. Mineral. 44, 906 (1959).
- (10) X. Gonze et al., Comput. Mater. Sci. 25, 478 (2002). ABINIT is a collaborative project of the Université Catholique de Louvain, Corning Incorporated and other contributors.
- (11) X. Gonze, B. Amadon, P.-M. Anglade, J.-M. Beuken, F. Bottin, P. Boulanger, F. Bruneval, D. Caliste, R. Caracas, M. Cote, T. Deutsch, L. Genovese, Ph. Ghosez, M. Giantomassi, S. Goedecker, D. R. Hamann, P. Hermet, F. Jollet, G. Jomard, S. Leroux, M. Mancini, S. Mazevet, M. J. T. Oliveira, G. Onida, Y. Pouillon, T. Rangel, G.-M. Rignanese, D. Sangall, R. Shaltaf, M. Torrent, M. J. Verstraete, G. Zerah, and J. W. Zwanziger, Computer Phys. Commun. 180, 2582 (2009).
- (12) G.Kresse and J. Furthmüller, Comp. Mat Sci 6, 15 (1996).
- (13) G.Kresse, D. K. Joubert, Phys Rev. B 59, 1758 (1999) and references therein.
- (14) M. Fuchs, M. Scheffler, Comput. Phys. Commun. 119, 67 (1999).
- (15) M. Cardona, R. K. Kremer, G. Siegle, A. Muñoz, A. H. Romero, and M. Schmidt, Phys. Rev B 82, 085210 (2010).
- (16) R. W. Godby, M. Schlüter, and L. J. Sham , Phys. Rev B 37, 10159 (1988).
- (17) A. Shileika, Surf. Science 37, 730 (1973).
- (18) A. Soni, V. Gupta, C. M. Arora, A. Dashora and B. L. Ahuja, Solar Energy 84, 1481 (2010).
- (19) M. G. Brik, J. Phys.: Condens. Matter 21, 485502 (2009).
- (20) B.Tell and P.M. Bridengaugh, Phys Rev. B 12, 3330 (1975).
- (21) K. Shindo, A. Morita, and H. Kamimura, J. Phys. Soc. Japan 20, 2054 (1945).
- (22) P. Carrier and Su-Huai Wei, Phys. Rev. B 70, 035212 (2004)
- (23) M. Cardona, R. K. Kremer, R. Lauck, G. Siegle, A. Muñoz, and A. H. Romero, Phys. Rev. B 80, 195204 (2009).
- (24) X. Gonze, Phys. Rev. B 55, 10337 (1997).
- (25) X. Gonze and C. Lee, Phys. Rev. B 55, 10355 (1997).
- (26) Further information about data collection, data reduction, refinement and geometrical details can be obtained from Fachinformationszentrum Karlsruhe, D-76344 Eggenstein-Leopoldshafen (Fax: +49-7247-808-666, e-mail: crysdata@fiz-karlsruhe.de) by quoting the deposition number CSD-422615.
- (27) NETZSCH-Gerätebau GmbH, Wittelsbacherstr. 42, D-95100 Selb, Germany.
- (28) J. Serrano, R. K. Kremer, M. Cardona, G. Siegle, A. H. Romero, and R. Lauck, Phys. Rev. B 73, 094303 (2006).
- (29) J. E Jaffe and A. Zunger, Phys. Rev. 28, 5822 (1983).
- (30) Shiyou Chen, X. G. Gong, and Su-Huai Wei, Phys. Rev B 75, 205209 (2007).
- (31) D. R. Hamann, X. Wu, K. M. Rabe, and D. Vanderbilt, Phys. Rev. B 71, 035117 (2005).
- (32) C. Parlak and R. Eryiǧit, Phys. Rev. B 73, 245217 (2006).
- (33) Hou Hai-Jun, Zhu Shi-Fu, Zhao Bei-Jun, Yu You, and Xie Lin-Hua, Phys. Scr. 82, 055601 (2010).
- (34) M. Bettini and W. B. Holzapfel, Solid State Commun., 16, 27 (1975).
- (35) A. Werner, H. D. Hochheimer, and A. Jayaraman, Phys. Rev. B23, 3836 (1981).
- (36) T. Tinoco, J.P. Itié, A. Polian, A. San Miguel, E. Moya, P. Grima, J. Gonzalez, and F. Gonzalez, J. Physique IV C 9, 151 (1994).
- (37) C. Carlone, D. Olego, A. Jayaraman, and M. Cardona, Phys. Rev. 22, 3877 (1980).
- (38) M. Akdoǧan and R. R. Eryiǧit, J. Phys.: Condens. Matter 14, 7493 (2002).
- (39) J. Serrano, A. H. Romero, F. J. Manjón, R. Lauck, M. Cardona, and A. Rubio, Phys. Rev B 69, 094306 (2004).
- (40) J. Serrano, A. Cantarero, M. Cardona, N. Garro, R. Lauck, R. E. Tallman, T. M. Ritter, and B. A. Weinstein, Phys. Rev. B 69, 014301 (2004).
- (41) M. Cardona and M. L. W. Thewald, Rev. Mod. Phys. 77, 1173 (2005).
- (42) A. Debernardi and M. Cardona, Phys. Rev. B 54, 11305 (1996).
- (43) I. V. Bodnar and N. S. Orlova, phys. stat. sol. (a) 78, K59 (1983).
- (44) S. Schorr and D. Sheptyakov, J. Phys.: Cond. Matter 20 104245 (2008).
- (45) N. Yamamoto, H. Horinaka, and T. Miyauchi, Jap. J. Appl. Phys. 18, 255 (1979).
- (46) A. U. Malsagov, I. M. Berfirer, and B. S. Kulbezhev, Izv. Vyssh. Ucheb. Zav., Fizika 29, 126 (1986); cited from H. Neumann, Cryst. Res. Technol. 22, 723 (1987).
- (47) R. R. Reeber and G. W. Powell, J. Appl. Phys., 38, 1531 (1967); R. R. Reeber, phys. stat. solidi a 32, 321 (1975).
- (48) R. B. Roberts, G. K. White, and T. M. Sabine, Aust. J. Phys. 34, 701 (1981).
- (49) S. Q. Wang, Appl. Phys. Lett. 88, 061902 (2006).
- (50) S. C. Abrahams and F. S. L.Hsu J. Chem. Phys. 63, 1162 (1975).
- (51) H. Neumann, G. Kühn, and W. Möller, phys. stat. solidi B 144, 565 (1987).
- (52) A. H. Romero, M. Cardona, R. K. Kremer, R. Lauck, G. Siegle, J. Serrano, and X. C. Gonze, Phys. Rev. B 78, 224302 (2008).
- (53) M. Cardona, R. K. Kremer, R. Lauck, G. Siegle, J. Serrano, and A. H. Romero, Phys. Rev. B 76, 075211 (2007).