Momentum distribution, vibrational dynamics and the potential of mean force in ice
Abstract
By analyzing the momentum distribution obtained from path integral and phonon calculations we find that the protons in hexagonal ice experience an anisotropic quasi-harmonic effective potential with three distinct principal frequencies that reflect molecular orientation. Due to the importance of anisotropy, anharmonic features of the environment cannot be extracted from existing experimental distributions that involve the spherical average. The full directional distribution is required, and we give a theoretical prediction for this quantity that could be verified in future experiments. Within the quasi-harmonic context, anharmonicity in the ground state dynamics of the proton is substantial and has quantal origin, a finding that impacts the interpretation of several spectroscopies.
pacs:
05.10.-a, 61.05.F-Investigating the impact of hydrogen (H) bonding on molecular properties is the focus of intense research, but even behavior as fundamental as the equilibrium dynamics of the protons participating in H bonds remains poorly understood. Proton dynamics is reflected in the momentum distribution probed by deep inelastic neutron scattering (DINS) Andreani et al. (2005). Recent DINS studies of H bonded systems have made striking observations, such as the presence of a secondary feature in the tail of the spherically averaged distribution in confined water Garbuio et al. (2007), and estimates of a surprisingly large quantum kinetic energy of the proton in undercooled water Pietropaolo et al. (2008). The secondary feature was attributed to quantum tunneling between the two wells of an anharmonic 1D potential Garbuio et al. (2007). It is not clear, however, to what extent the dynamics of an interacting many body system can be reduced to that of a single proton along a bond. For instance, it has been pointed out that anisotropy can mimic features of a spherical distribution that one might associate to anharmonicity in a 1D model Soper (2009), and yet so far there is no conclusive study of this issue. To interpret experiments in confined and undercooled water, the unknown details of the molecular structure are a severe source of difficulty. However, even in the simpler case of ice Ih, it is not clear if the physics can be captured by simple model potentials, and how anharmonicity, anisotropy and structural disorder influence the momentum distribution.
In order to tackle these issues we consider the open path integral Car-Parrinello molecular dynamics (PICPMD) data for ice Ih that yielded the accurate spherical momentum distribution reported in a prior publication Morrone and Car (2008). In this prior study, no attempt was made to relate the distribution to the equilibrium dynamics of the proton or to investigate the role of the environment in terms of a potential of mean force. In simulations this task is facilitated by access to the full 3D distribution, in contrast to experiments on polycrystalline samples, where only the spherically averaged distribution could be measured Reiter et al. (2004); Andreani et al. (2005). In addition, crystalline symmetry allows the use of harmonic analysis to quantify the relation between the momentum distribution and vibrational dynamics, thereby elucidating the role of anharmonicity and disorder on the proton ground state.
We find that anisotropy stemming from the molecular orientations in the crystal has a larger effect on the momentum distribution than anharmonicity. The latter is effectively described within a quasi-harmonic model and is particularly important in the stretching motions, corroborating pump-probe laser experiments on the excited state dynamics of ice and water Woutersen et al. (1998); Bakker and Nienhuys (2002). This finding impacts the interpretation of infrared and x-ray spectroscopies, and regarding DINS experiments, the large effect of molecular anisotropy implies that it is not possible to unambiguously attribute to anharmonicity features of the spherically averaged distribution. Substantially more information, capable of disentangling anisotropy from anharmonicity, can be extracted from the directional distribution, for which we now present the first theoretical prediction for a realistic system.
The simulations of Ref. Morrone and Car, 2008 sampled the end-to-end distribution of the open Feynman paths of the protons Morrone et al. (2007), i.e. where the sum runs over the protons in the cell and the vector points from one end of the path to the other. The momentum distribution is the Fourier transform of . For each distribution we compute the correlation matrix . Within the statistical errors of the simulation the eigenvalues of are the same for all the protons, while the associated eigenvectors are proton specific directions related by crystalline symmetry to the directions of the other protons. This suggests an anisotropic Gaussian form for the end-to-end distribution: . A quantile analysis reported in the supplement sup fully supports this hypothesis. Thus the momentum distribution is , implying that the corresponding potential of mean force has the effective harmonic form , where and denote the proton mass and position. has eigenvalues and shares with the eigenvectors, . The are related to the by,
| (1) |
and and are denoted the principal frequencies and directions of proton . Since the principal frequencies do not depend on all the protons have equivalent local environments within the simulation error bars.
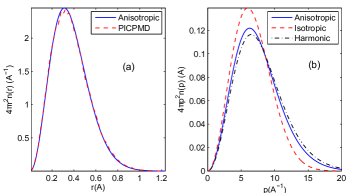
By averaging over the protons we obtain the frequencies with error bars in the first row of Table 1. In terms of the the spherically averaged end-to-end distribution takes the form,
| (2) |
Fig. 1(a) shows that this curve differs negligibly from the corresponding “raw” distribution extracted from the simulation, indicating that an effective harmonic model faithfully represents the spherically averaged data. Consistent with chemical intuition, the associated principal directions reflect the orientation of each water molecule in the crystal. The principal axes corresponding to the highest frequency are close to the oxygen-oxygen nearest neighbor directions, whereas the eigenvectors associated with the middle and lowest frequency correspond respectively to directions in and perpendicular to the HOH molecular plane.
The PICPMD principal frequencies differ from their harmonic counterparts (see Table 1). The latter were obtained with the phonon calculation discussed below. Thus the model that better represents the data is anisotropic and quasi-harmonic. We can now resolve, in the case of ice, a major issue that troubled the interpretation of experiments Soper (2009) by quantifying the relative importance of anisotropy and anharmonicity. We depict in Fig. 1 (b) the spherical distributions corresponding to, respectively, the quasi-harmonic model (first row of Table 1), the harmonic model (second row of Table 1), and the isotropic model with frequency that best fits the data. Anisotropy and anharmonicity are both significant, but anisotropy clearly has the larger effect. The isotropic model corresponds to a classical Maxwell-Boltzmann distribution with an effective temperature . In spite of being significantly higher than the equilibrium temperature of the simulation (), the isotropic model severely underestimates quantum effects, a finding that is also illustrated by a kinetic energy () approximately 30 percent smaller than the simulation value ().
| PICPMD | ||||
|---|---|---|---|---|
| Harmonic |
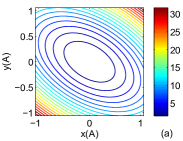
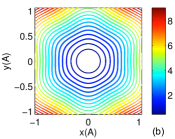
All the principal frequencies in Table 1 are well in excess of the equilibrium temperature, indicating that the dynamics of the proton is dominated by quantum zero-point motion. Dependence of the molecular orientations upon the crystalline framework originates anisotropies that reflect the symmetry of the environment in the momentum and end-to-end distributions. To study these effects we focus on the latter distribution, which factorizes into the product of a spherical free-particle contribution and an anisotropic environmental component , i.e. Lin et al. (2010). Rather than extracting directly from the PICPMD data, which would be affected by substantial noise, we reconstruct from the superposition of the individual proton contributions within the quasi-harmonic model. Here we use the fact that there are 24 unique orientations of the molecules in the hexagonal ice crystal Hayward and Reimers (1997), and we also include the effects of proton disorder estimated below in the phonon calculation. Fig. 2 (a) depicts the log scale plot of one individual environmental end-to-end distribution projected on the basal plane of ice Ih. The elliptic shape of the contour comes directly from the quasi-harmonic model. Fig. 2 (b) illustrates the log scale plot of the superposition of all the environmental end-to-end distributions. The hexagonal shape of superpositioned distribution is a striking manifestation of quantum mechanics as in classical physics is equal to . While the distribution is spherical at the center, hexagonal character emerges at intermediate displacements and becomes pronounced in the tail of the distribution where blurring of the contour lines due to disorder can be detected. Experiments on ice Ih have only measured the spherical distribution Reiter et al. (2004) but it is likely that the full three dimensional distribution should become accessible in the future with improved instrumentation and preparation techniques. Directional momentum distributions have already been reported for materials such as KDP Reiter et al. (2002) and Rb3H(SO4)2 Homouz et al. (2007). It should be noted, however, that the greatest sensitivity to anisotropy is in the exponential tail of the distribution, a finding indicating that substantial resolution may be necessary to experimentally disentangle anisotropy, anharmonicity and other environmental effects.
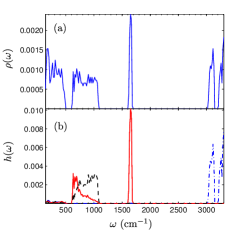
Lastly, we discuss the relationship between the principal frequencies and the vibrational spectrum. The latter includes four main features experimentally: a stretching band centered at Bertie and Whalley (1964), a bending band centered at Taylor and Whalley (1964), a wide librational band between and Bertie and Whalley (1964); Prask et al. (1968) and a band of network modes below Li (1996). These features are reproduced in the phonon spectrum of ice that we calculate by diagonalizing the dynamical matrix. This calculation is performed with Qbox Gygi (2008) by adopting the same supercell, electronic structure parameters and disordered proton configuration of the PICPMD simulation Morrone and Car (2008). The dynamical matrix is calculated with a finite difference method (grid size of ). The resulting phonon density of states shown in Fig. 3 (a), agrees with experiment, and is consistent with previous calculations Morrison and Jenkins (1999), which did not include proton disorder, indicating that such effects have a small influence on the spectrum. We indicate phonon frequencies and eigenvectors by and , respectively, where are Cartesian components, , and is the number of supercell atoms. In the quantum harmonic approximation the momentum distribution of particle of mass has the anisotropic Gaussian form with correlation matrix Ceriotti et al. (2010),
| (3) |
As a consequence of disorder the eigenvalues of , depend on the proton index . The harmonic average frequencies are reported in the second row of Table 1. The corresponding standard deviations originate almost entirely from ice disorder, being at least an order of magnitude larger than the numerical errors estimated from the small asymmetry of the calculated dynamical matrix. The statistical errors in the PICPMD simulation (Table 1) are on average a few times larger than the harmonic estimate of disorder, confirming that, within error bars, all proton environments are equivalent. We expect that longer runs combined with better estimators of the end-to-end distribution Lin et al. (2010) should improve the statistical accuracy to the point that disorder effects could become measurable in future simulations.
The population function,
| (4) |
gives the weight of the phonon in the principal direction and is depicted in Fig. 3 (b). It is found that is stretching, is bending and libration, and is libration. Taking only stretching, bending, and libration into account, and using weights proportional to we infer that , , and . In comparison, the values in the second line of Table 1 are red-shifted by contributions from network modes (, and to , and , respectively), an intriguing result suggesting that fine details of the momentum distribution should reflect intermediate range order properties of the H bond network.
The potential energy surface is generated with the same protocol in path integral and phonon calculations. We thus attribute the difference between the average principal frequencies in the two rows of Table 1 to anharmonicity. This originates from quantum delocalization, present in the PICPMD simulation, which causes the proton to sample the potential over an extended range. Along the bond direction the proton spans from relative to the centroid of the path. This is much larger than the corresponding classical thermal spread () indicating that quantum anharmonicity is essentially unaffected by temperature. The asymmetry of the quantal spread suggests that the first correction to the harmonic potential depends cubically on displacement. A visualization of the approximate effective potential along the bond based on further calculations is given in the supplement sup and shows that while cubic terms dominate in the ground state, higher order corrections become important at displacements larger than . In the supplement we also report harmonic estimates of the quantum effects on oxygen, which are non-negligible albeit smaller than for the protons.
In conclusion, we find that to a large extent the momentum distribution in ice is a simple anisotropic Gaussian distribution. This does not mean, however, that ice behaves like a harmonic crystal as the principal frequencies of the distribution differ from those of a harmonic crystal. Anharmonicity, enhanced by H bonding, is appreciable in the libration dominated and is particularly significant in the stretching dominated , in agreement with optical pump-probe experiments Bakker and Nienhuys (2002); Woutersen et al. (1998). The quantal character of the anharmonicity is consistent with the observed T-independence of the lifetime of excited stretching modes in ice Woutersen et al. (1998). Our findings have implications for the calculation of observables in ice, such as infrared spectra, which typically ignore quantum anharmonicity Chen et al. (2008), and x-ray absorption spectra, which typically ignore quantum configurational disorder Chen et al. (2010). The approach presented here could be applied directly to the study of other crystalline H bonded systems, and is also an important step towards a better understanding of the proton momentum distribution in disordered H bonded systems such as water under different conditions. In such cases only the spherically averaged momentum distribution is accessible in experiment and simulation can provide essential microscopic information to supplement and interpret the experimental data. Finally, we remark that while the qualitative picture emerging from our calculations is robust, the path integral data have relatively large error bars and the quantitative details depend on the accuracy of the underlying Born Oppenheimer potential energy surface. The latter should reflect the known limitations of the GGA functional used in this study Grossman et al. (2004); Santra et al. (2009) and comparisons with future high resolution experiments should help to clarify this issue.
This work is partially supported by NSF CHE-0956500 and DOE DE-SC0005180 (LL and RC), and by ERC-2009-AdG-247075 (MP). We thank F. Gygi for the help using Qbox. The calculations were performed at the TACC under the NSF TeraGrid program, and on the TIGRESS computers at Princeton University.
References
- Andreani et al. (2005) C. Andreani, D. Colognesi, J. Mayers, G. F. Reiter, and R. Senesi, Adv. Phys. 54, 377 (2005).
- Garbuio et al. (2007) V. Garbuio, C. Andreani, S. Imberti, A. Pietropaolo, G. Reiter, R. Senesi, and M. Ricci, J. Chem. Phys. 127, 154501 (2007).
- Pietropaolo et al. (2008) A. Pietropaolo, R. Senesi, C. Andreani, A. Botti, M. Ricci, and F. Bruni, Phys. Rev. Lett. 100, 127802 (2008).
- Soper (2009) A. K. Soper, Phys. Rev. Lett. 103, 069801 (2009).
- Morrone and Car (2008) J. A. Morrone and R. Car, Phys. Rev. Lett. 101, 017801 (2008).
- Reiter et al. (2004) G. Reiter, J. Li, J. Mayers, T. Abdul-Redah, and P. Platzman, Braz. J. Phys. 34, 142 (2004).
- Woutersen et al. (1998) S. Woutersen, U. Emmerichs, H. K. Nienhuys, and H. J. Bakker, Phys. Rev. Lett. 81, 1106 (1998).
- Bakker and Nienhuys (2002) H. J. Bakker and H. K. Nienhuys, Science 297, 587 (2002).
- Morrone et al. (2007) J. A. Morrone, V. Srinivasan, D. Sebastiani, and R. Car, J. Chem. Phys. 126, 234504 (2007).
- (10) Supplementary materials.
- Lin et al. (2010) L. Lin, J. A. Morrone, R. Car, and M. Parrinello, Phys. Rev. Lett. 105, 110602 (2010).
- Hayward and Reimers (1997) J. Hayward and J. Reimers, J. Chem. Phys. 106, 1518 (1997).
- Reiter et al. (2002) G. F. Reiter, J. Mayers, and P. Platzman, Phys. Rev. Lett. 89, 135505 (2002).
- Homouz et al. (2007) D. Homouz, G. Reiter, J. Eckert, J. Mayers, and R. Blinc, Phys. Rev. Lett. 98, 115502 (2007).
- Bertie and Whalley (1964) J. Bertie and E. Whalley, J. Chem. Phys. 40, 1637 (1964).
- Taylor and Whalley (1964) M. Taylor and E. Whalley, J. Chem. Phys. 40, 1660 (1964).
- Prask et al. (1968) H. Prask, H. Boutin, and S. Yip, J. Chem. Phys. 48, 3367 (1968).
- Li (1996) J. Li, J. Chem. Phys. 105, 6733 (1996).
- Gygi (2008) F. Gygi, IBM J. Res. Dev. 52, 137 (2008).
- Morrison and Jenkins (1999) I. Morrison and S. Jenkins, Physica B 263, 442 (1999).
- Ceriotti et al. (2010) M. Ceriotti, G. Miceli, A. Pietropaolo, D. Colognesi, A. Nale, M. Catti, M. Bernasconi, and M. Parrinello, Phys. Rev. B 82, 174306 (2010).
- Chen et al. (2008) W. Chen, M. Sharma, R. Resta, G. Galli, and R. Car, Phys. Rev. B 77, 245114 (2008).
- Chen et al. (2010) W. Chen, X. Wu, and R. Car, Phys. Rev. Lett. 105, 17802 (2010).
- Grossman et al. (2004) J. C. Grossman, E. Schwegler, E. W. Draeger, F. Gygi, and G. Galli, J. Chem. Phys. 120, 300 (2004).
- Santra et al. (2009) B. Santra, A. Michaelides, and M. Scheffler, J. Chem. Phys. 131, 124509 (2009).