Polar modes in multiferroic hexagonal Y-type hexaferrite
Abstract
Spectra of transmission and reflection coefficients of
single crystalline -type hexaferrite
are
measured at Terahertz and infrared frequencies, , and at temperatures 10 to 300 K, for polarization
. Oscillator parameters of nineteen phonon lines
allowed by the crystal lattice symmetry are determined.
Absorption lines assignment to vibrational modes of the lattice
structural fragments is performed. Below the temperatures of and , corresponding to the zero field phase transitions
to the proper screw and to the longitudinal-conical spin states,
respectively, new absorption lines are discovered whose origin is
assigned to the electric-dipole active magnetic excitations.
Keywords:
multiferroics, spectroscopy, electromagnon, factor group analysis1 Introduction
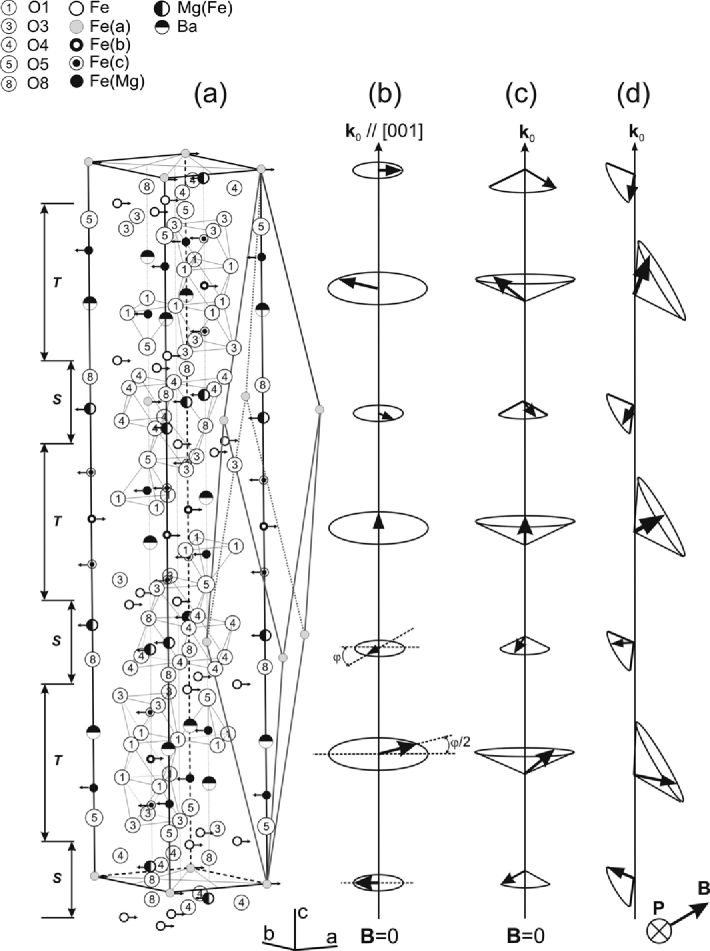
After the discovery of a huge magneto-electric effect in 1 , much attention is being paid to a class of ferroelectrics with cycloidal spin order 2 ; 3 . In such materials the application of relatively small magnetic field (few Tesla) can induce various phases including those revealing ferroelectricity. Model objects for studying magnetic and ferroelectric effects are hexaferrites, typical representatives are compounds of the M-type, like , -type, like , W-type, like , Z-type, like , X-type, like , and U-type, like ; here = , , ; = , , , , 4 . Of special interest are -type materials in which unique multiferroic properties have recently been discovered 5 ; 6 ; 7 ; 8 ; 9 ; 10 ; 11 ; 12 ; 13 ; 14 ; 15 ; 16 . In particular, in (), magnetoelectric switching can be realized by application of rather small magnetic field →B (the value of →B can be as low as 6 ), while can be efficiently tailored by the -substitution (at the critical magnetic field for switching the electric polarization is reduced down to 12 ). The phase diagrams of these compounds contain several magnetically ordered phases and some of them are also ferroelectric. The crystal structure of -type hexaferrites is rather complicated. For instance, the unit cell of ( = , , , , ) contains 18 atomic layers with stacking sequence along the -direction 17 ; 18 , as indicated in figure 1.
Magnetic structure of Y-hexaferrites is under intensive study for already more than 50 years 13 ; 15 ; 16 ; 19 ; 20 ; 21 ; 22 ; 23 ; 24 . In 19 , an existence of a collinear-spin ferrimagnetic order was suggested. Later, an idea about helical spin ordering in was put forward 20 and experimentally confirmed in 15 ; 16 ; 21 ; 22 ; 23 ; 24 . According to 15 , the magnetic structure in is proper screw below at (figure 1b) and collinear at higher temperatures (figure 1a). Application of magnetic field can generate a series of magnetic phase transitions 6 ; 7 ; 10 ; 11 ; 13 . In there exists a longitudinal conical spin ordered state below (figure 1c) 13 . Here, ferroelectric phases with a quasitransverse spin ordering 6 ; 13 (figure 1d) can be induced by applying magnetic field of magnitude much smaller than in 5 ; 8 . It turned out that the phase boundaries can be effectively tuned by heat treating 8 as well as by -substitution into octahedral Fe sublattices 12 . It should be noted that recent neutron diffraction studies 10 ; 13 revealed much more complicated magnetic phase diagram of than was reported previously 6 .
Since hexaferrites with magnetically ordered long periodic structures reveal strong magnetoelectric effects at elevated temperatures (above ) and in relatively small magnetic fields, they are promising for application in magnetoelectric systems. Presently, the mechanisms of competition between magnetic and electric interactions in hexaferrites remain unclear. That is why the aim of this work was to further study the mechanisms of formation of magnetic and ferroelectric phases in by using the Terahertz-infrared (THz-IR) spectroscopy. Indeed, finite interaction between the two subsystems, spins and phonons, would necessarily lead to a noticeable transformation in the phonon subsystem (IR range) in the materials and these changes can be used for getting more information about magnetoelectric properties of the compounds. Besides, recently, Kida et al. have reported on the observation in of electric-dipole active magnetic excitations 11 , called electromagnons. The excitations were detected at THz frequencies in longitudinal-conical spin state and revealed huge changes in the intensity under application of magnetic field less than (along [001]). On the other hand, Kamba et al. report 14 that in ”no evidence for ferroelectricity was observed either on cooling (at →B=0) or after application of external magnetic field up to at ”. To understand the reason of these discrepancies was also one of our aims.
2 Experimental details
Single crystalline samples of were grown by a flux method as described in 16 . For the infrared and THz measurements plane-parallel samples were prepared of thickness about and size about , with the axis perpendicular to the surface of the samples. In this geometry, only the modes can be registered by optical measurements, corresponding to the situation when the →E-vector of the probing radiation is perpendicular to the -axis. The measurements were performed on two spectrometers. For the low frequency range, , a quasioptical THz spectrometer based on backward-wave oscillators was used. With this instrument by measuring complex transmission coefficient spectra , the values of real and imaginary parts of dielectric permittivity are directly obtained 25 . A Fourier-transform spectrometer Bruker IFS 113V was used to cover higher frequency range up to . At these frequencies the reflection coefficient spectra were measured. The spectra obtained on the two spectrometers, , , and , were merged and analyzed by a least square fitting procedure. The absorption lines were modeled with Lorentzians and coupled Lorentzians with the complex dielectric permittivity given by the following expressions. For Lorentzians
| (1) |
where is the high frequency dielectric constant, is the dielectric contribution of the absorption line, is its eigenfrequency and the damping constant. For the coupled Lorentzians the corresponding expression is written as 26 :
| (2) |
where = 1, 2, is the oscillator strength of -th Lorentzian with the eigenfrequency ; is the real and the imaginary coupling constants.
3 Results and discussion
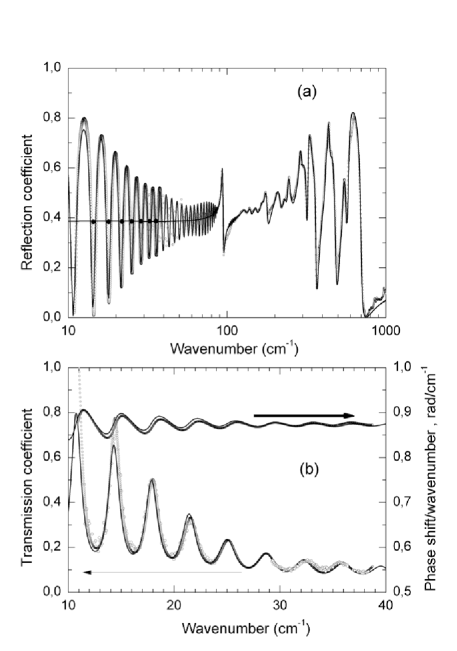
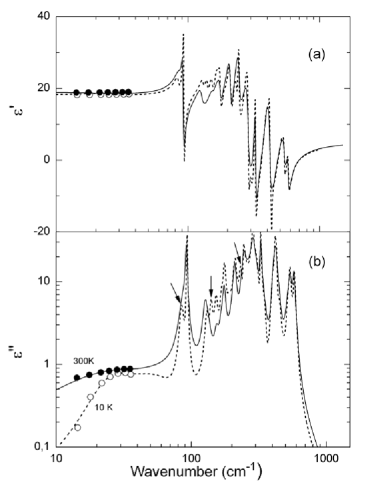
Examples of the spectra of the sample obtained at 10 K are presented in figure 2. Dots show the spectra got on the THz and Fourier spectrometers and the lines represent the results of the least-square processing of the spectra based on the expressions 1 and 2. At the lowest frequencies, an oscillating behavior in the spectra is observed that comes from interference of the radiation within the plane-parallel samples. Processing the oscillations allows to determine directly the dielectric parameters of the material, the real and the imaginary parts of the dielectric constant, of the refractive index, etc. 25 . Figure 3 shows examples of the and spectra of . Dots correspond to the values of and directly obtained on the THz spectrometer 25 while lines show the results of the fitting of the infrared spectra. Parameters of the absorption lines are summarized in 1.
3.1 Spectral analysis
We have performed a factor-group analysis of possible phonon modes in , with the results summarized in table 2. According to this table, 34 modes can be observed in the IR-spectra corresponding to the irreducible representations of the space group . Nondegenerate -modes can be excited by electric field and doubly degenerate -modes - by the -field polarized perpendicular to the -axis. To identify the excitations observed in our experiment, we compare spectra of with the ones of magnetoplumbite and spinels 27 ; 28 ; 29 ; 30 ; 31 ; 32 ; 33 . We consider two types of tetrahedra (M6 and M9 in table 2). An ideal tetrahedron with the symmetry has four fundamental vibration modes 34 : , , , and , of which only and are IR-active. Due to the low local symmetry of , also the modes are active in optical spectra. We assume that the lines seen at and are caused by the stretching vibrations and that the deformational modes of the tetrahedra and are located within a complicated absorption structure in the range around . The modes have small dipole moment and should be observable in the range . The mode is not IR-active. The complicated shape of the and bands can be caused by a LO-TO splitting of the polar modes or by a certain disorder of cations ( and ) at the sites within the tetrahedron leading to different eigenfrequencies.
An undistorted octahedron has a symmetry and creates 6 fundamental modes 34 : , , , , , and . Vibrations , , and should be Raman active, and - IR-active and is expected to be silent. Since the octahedra form chains and thus are not independent, unambiguous assignment of the observed absorption bands to octahedral modes is problematic. That is why only tentative assignment of these bands is given in table 1. Still, it is reasonable to assume that the bands at , and correspond to the and vibrations of the octahedra. The bands at are mainly coming from the bending vibrations of the concatenated bonds of adjoint octahedra and could also be assigned to the and molecular vibrations of the octahedron. In 30 it is assumed that the absorption bands located close to and in the spectra of -type hexaferrite are caused by vibrations of the bipyramid. The structure of , however, does not contain bipyramids and thus our assignment of the bands in this range to the bending vibrations looks more correct. Finally, the line around should be assigned to the bonds vibration. We note that in this vibration has slightly larger frequency, of and , according to 28 ; 30 ; 31 .
| Oscillator type | Assignment, ions involved | |||||
| coupled Lorentzians 1 | 29.08 | 20.52 | 0.36 | magnon-phonon continuum | ||
| 56.78 | 41.32 | 0.36 | -0.86 | |||
| Lorentzian 2 | 93.21 | 1.62 | 0.67 | 0 | ||
| Lorentzian 3 | 130.41 | 8.27 | 0.20 | |||
| Lorentzian 4 | 140.65 | 7.41 | 0.23 | optic magnon | ||
| Lorentzian 5 | 152.93 | 9.11 | 0.30 | |||
| Lorentzian 6 | 167.45 | 9.11 | 0.21 | |||
| Lorentzian 7 | 176.29 | 7.96 | 0.75 | |||
| Lorentzian 8 | 211.54 | 17.54 | 1.40 | |||
| Lorentzian 9 | 233.52 | 19.55 | 1.21 | optic magnon | ||
| coupled Lorentzians 10 | 243.14 | 8.93 | 0.45 | 0 | , bend | |
| 288.47 | 11.10 | 1.13 | -43.38 | , bend | ||
| coupled Lorentzians 11 | 301.30 | 32.57 | 2.50 | 0 | , bend | |
| 325.10 | 6.54 | 0.87 | 6.73 | , bend | ||
| coupled Lorentzians 12 | 417.59 | 13.21 | 0.75 | 0 | , bend | |
| 431.33 | 11.58 | 0.12 | -13.11 | , bend | ||
| coupled Lorentzians 13 | 353.49 | 28.33 | 0.09 | 0 | , bend | |
| 403.86 | 29.65 | 0.80 | 38.23 | , bend | ||
| coupled Lorentzians 14 | 447.81 | 30.79 | 0.29 | 0 | , stretch | |
| 520.16 | 24.38 | 0.16 | -0.26 | , stretch | ||
| coupled Lorentzians 15 | 538.47 | 22.55 | 0.56 | 0 | , stretch | |
| 582.43 | 20.26 | 0.39 | -6.00 | , stretch | ||
3.2 Low temperature effects
We have performed measurements of the THz-IR spectra of down to liquid helium temperatures. Figure 3 shows corresponding spectra of and at room temperature and at . Two features have to be pointed out.
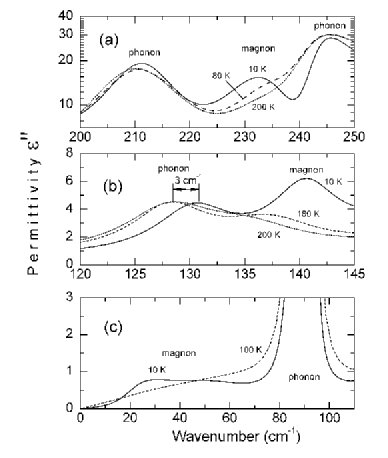
Firstly, the low frequency (around ) value of does not change significantly while cooling down, with the total dielectric contribution of all higher frequency absorption bands of . This means that there are no significant structural changes in the crystal lattice of while cooling down except trivial narrowing of the bands and a certain shift of the line around (figure 4b).
| Atom | Wyck.pos. | Site symmetry | Vibration representation | Atomic environment |
| O1 | 18h | coplanar triangle | ||
| Fe2 | 18h | octahedron | ||
| O3 | 18h | non-coplanar triangle | ||
| O4 | 18h | tetrahedron | ||
| O5 | 6c | tetrahedron | ||
| M6 | 6c | tetrahedron | ||
| Ba7 | 6c | 9-vertex polyhedron | ||
| O8 | 6c | tetrahedron | ||
| M9 | 6c | tetrahedron | ||
| Fe10 | 6c | octahedron | ||
| Fe11 | 3b | octahedron | ||
| Fe12 | 3a | octahedron | ||
Secondly, we were able to register for the first time several new absorption lines appearing below and below . These two specific temperatures correspond to the change in the magnetic structure of 13 . The new lines are indicated by arrows in figure 3 and shown in more details on expanded scales in figure 4.
At the temperature of , the configuration of the internal magnetic structure of changes from collinear ferrimagnetic at (figure 1a) to an incommensurate proper screw spin-ordered at 13 with the wavevector . This magnetic transition leads to an appearance of three new lines at , and (figures 3, 4). We believe that these modes have magnetic origin and are related to an excitation of optically active magnetic polaritons 35 ; 36 . To check our suggestion, optical measurements in magnetic field are in progress.
Another excitation was discovered in at the lowest frequencies, below . As shown in figure 4c, there is a broad wing below in the spectrum at that transforms into a more pronounced absorption band at . In 11 by using the technique of THz time-domain spectroscopy, an absorption band has been detected in at below (where the magnetic structure has changed to a longitudinal conical 13 ) and has been assigned to an electromagnon excitation. Although this line was observed in the geometry , we assume that the transition around , that leads to an activation of an electromagnon for , is accompanied by certain distortions in the crystal lattice of which break the selection rules and enable excitation of the mode also for polarization .
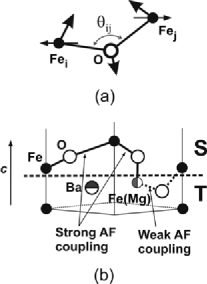
According to the spin currents model 37 (or the inverse Dzyaloshinskii-Moriya model), the non-collinear spin ordering (figure 1d) can produce a local polarization , that is vanishing on a macroscopic scale. Here the constant depends mainly on the spin-orbit and the exchange interactions. The neighboring spins and , that connect sites and , are aligned along the unit vector . Within this model, in order to create the ferroelectric polarization, the alignment of the cone axis should deviate from the direction . (It is important that such changes should happen, on the microstructural level, to produce the value of A not equal to zero). The crystal is composed of an alternating stacking of the T and S blocks along the axis, as depicted in figure 1a. Within these blocks, the magnetic moments on ions are collinearly aligned and ferrimagnetically coupled. Along with that, the magnetic moments between the adjacent T and S blocks align noncollinearly (figure 5). The resultant magnetic structure of in the absence of magnetic field is a noncollinear screw spiral magnetic structure. This can lead to local distortions of magnetic order and to nonzero values of A. When the temperature is lowered, the exchange interactions change their amplitudes (in particular, on the boundaries between the T and the S blocks), probably due to spin-phonon interaction with the deformation modes involved (figure 5a). It is this fact that explains the evolution of shape of the spectral response presented in figure 4.
4 Summary
By using the terahertz frequency-domain and
the infrared Fourier spectrometers, the spectra of the real and
the imaginary parts of the dielectric permittivity have been
measured of a single crystalline -type hexaferrite
, at frequencies to in the temperature interval from to and
for polarization .
New absorption lines are discovered below the temperatures of and , where the internal magnetic field configuration in changes. The origin of these lines is assigned to optical polaritons. Their spectral weight is nonzero in the phase with longitudinal spin polarization () testifying the influence of the spin-lattice interaction (that involves the deformational modes) on the superexchange interaction at the junction between the S and the T structural blocks.
The parameters of all nineteen (allowed by the symmetry) phonon modes are determined. Their assignment to the vibrational modes of the crystal lattice fragments is performed.
It is found that the total contribution to the static dielectric permittivity of the polar phonon modes is practically independent on the temperature in the range , implying no significant structural changes in the crystal lattice of .
5 Acknowledgements
Funding from Russian Foundation for Basic Research (project 09-02-00280-a) is acknowledged.
References
- (1) T. Kimura, T. Goto, H. Shintani, K. Ishizaka, T. Arima and Y. Tokura, Nature 426, (2003) 55
- (2) T. Kimura, Annu. Rev. Mater. Res. 37, (2007) 387
- (3) Y. Tokura and S. Seki, Adv. Mater. 22, (2010) 1554
- (4) P.B. Braun, Philips Res. Rep. 12, (year) 491
- (5) T. Kimura, G. Lawes and A.P. Ramirez, Phys. Rev. Lett. 94, (2005) 137201
- (6) S. Ishiwata, Y. Taguchi, H. Murakawa, Y. Onose and Y. Tokura, Science 319, (2008) 1643
- (7) K. Taniguchi, N. Abe, S. Ohtani, H. Umetsu and T. Arima, Applied Physics Express 1, (2008) 031301
- (8) Y.S. Chai, S.H. Chun, S.Y. Haam, Y.S. Oh, I.Kim and K.H. Kim, New J. Phys. 11, (2009) 073030
- (9) S. Ishiwata, Y. Taguchi, Y. Tokunaga, H. Murakawa, Y. Onose and Y. Tokura, Phys. Rev. B 7, (2009) 180408(R)
- (10) H. Sagayama, K. Taniguchi, N. Abe, T. Arima, Y. Nishikawa, S. Yano, Y. Kousaka, J. Akimitsu, M. Matsuura and K. Hirota, Phys. Rev. B 8, (2009) 180419(R)
- (11) N. Kida, D. Okuyama, S. Ishiwata, Y. Taguchi, R. Shimano, K. Iwasa, T. Arima and Y. Tokura, Phys. Rev. B 80, (2009) 220406
- (12) S.H. Chun, Y.S. Chai, Y.S. Oh, D. Jaiswal-Nagar, S.Y. Haam, I. Kim, B. Lee, D.H. Nam, K.-T. Ko, J.-H. Park, J.-H. Chung, K.H. Kim , Phys. Rev. Lett. 104, (2010) 037204
- (13) S. Ishiwata, D. Okuyama, K. Kakurai, M. Nishi,Y. Taguchi and Y. Tokura, Phys. Rev. B 81, (2010) 174418
- (14) S. Kamba et al, J. Appl. Phys. 107, (2010) 104109
- (15) N. Momozawa, Y. Yamaguchi and M. Mita, J. Phys. Soc. Jpn 55, (1986) 1350
- (16) N. Momozawa,Y. Nagao, S. Utsumi, M. Abe and Y. Yamaguchi , J. Phys. Soc. Jpn 70, (2001) 2724
- (17) H.S. Shin, S.J. Kwon, Powder Diffraction 8, (1993) 98
- (18) A. Collomb, J. Muller, J.C. Guitel and J.M. Desvignes, J. Magn. Magn. Mat. 78, (1989) 77
- (19) E.W. Gorter, 1957 Proc. Inst. Elec. Engrs., Suppl. 104B, (1957) 255
- (20) U. Enz, J. Appl. Phys. 32, (1961) S22
- (21) V.A. Sizov, R.A. Sizov and I.I. Yamzin, JETP Letters 6, (1967) 176
- (22) N. Momozawa , Y. Yamaguchi, H. Takei and M. Mita, J. Phys. Soc. Jpn. 54, (1985) 771
- (23) N. Momozawa , Y. Yamaguchi, H. Takei and M. Mita, J. Phys. Soc. Jpn. 54, (1985) 3895
- (24) N. Momozawa and Y. Yamaguchi, J. Phys. Soc. Jpn. 62, (1993) 1292
- (25) G.V. Kozlov and A.A. Volkov, Topics in Applied Physics 74, (1998) 52
- (26) A.S. Barker and J.J. Hopfield, Phys. Rev. 135, (1964) A1732
- (27) P.M. Nikolic, L. Zivanov, O. S. Aleksic, D. Samaras, G.A. Gledhill and J.D. Collins, Infrared Phys. 30, (1990) 265
- (28) M. Bellotto, G. Busca, C. Cristiani and G. Groppi, J. Solid State Chem. 117, (1995) 8
- (29) S. Ram, Phys. Rev. B 51, (1995) 6280
- (30) M.V.Rane, D. Bahadur and C.M. Srivastava, J. Phys. D: Appl. Phys. 32, (1999) 2001
- (31) W.Y. Zhao, P. Wei, X.Y. Wu, W. Wang and Q.J. Zhan, J. Appl. Phys. 103, (2008) 063902
- (32) R.D. Waldron, Phys. Rev. 99, (1955) 1727
- (33) R.A. Candeia, M.A.F. Souza, M.I.B. Bernardi, S.C. Maestrelli, I.M.G. Santos, A.G. Souza and E. Longo E, Ceramics International 33, (2007) 521
- (34) K. Nakamoto, Infrared and Raman Spectra of Inorganic and Coordination Compounds 3rd edition (New York, Wiley, 1978)
- (35) I.E. Chupis and A.A. Mishchenko, Low Temp. Phys. 27, (2001) 480
- (36) I.E. Chupis, Low Temp. Phys. 33, (2007) 715
- (37) H. Katsura, N. Nagaosa and A.V. Balatsky, Phys. Rev. Lett. 95, (2005) 057205