Ionization Conditions in the Central Giant H ii Region of NGC 5253
Abstract
We are carrying out a detailed 2D spectroscopic study of the central 210 pc130 pc of the blue compact dwarf (BCD) galaxy NGC 5253. This contribution presents the ionization conditions and chemical abundance patterns for the different kinematic components of the ionized gas detected in our previous work. All the kinematic components present an excess in nitrogen abundance. In particular, the broad velocity component has larger excess than the narrow one by a factor of which is consistent with a scenario for the Giant H ii Region where the broad component of the emission lines traces the material expelled by the two central Super Star Clusters while the narrow one is associated to previously existing ionized gas.
1 Introduction
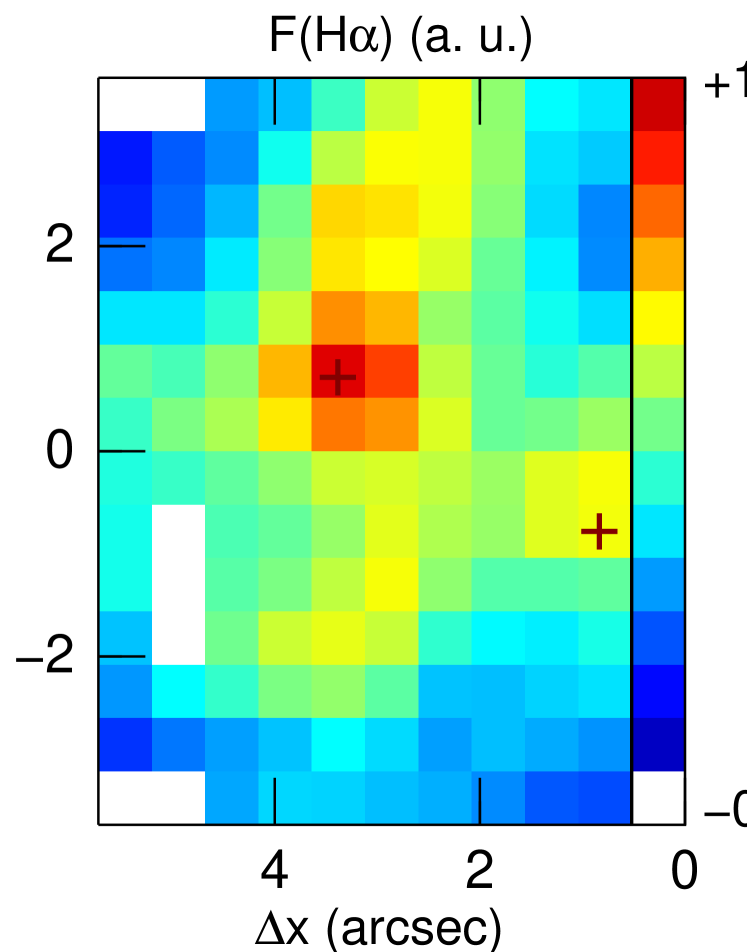
NGC 5253 is a blue compact dwarf (BCD) galaxy located in the Centaurus A/M 83 group kar07 which is suffering a burst of star formation probably triggered by a previous encounter with M 83 van80 . Because of its proximity ( Mpc, sak04 ), this galaxy constitutes an optimal target for the study of the starburst phenomenon. Recently, we performed a detailed study of NGC 5253, mapping its central part with 2D optical spectroscopy mon10a . Among other results, we delimited very precisely the area enriched with extra nitrogen and explored the possibility of Wolf-Rayet stars as the cause of this enrichment. We also showed that the kinematics of this object is very complex. In particular, we needed up to three kinematically distinct components to properly reproduce the profile of the brightest emission lines. While two of them, C1 and C3, were relatively narrow, C2 presented supersonic velocities (see mon10a for details about the extend of each component and its typical velocity dispersion). These results, together with our findings about the extinction structure and electron density, were consistent with a scenario in which the two massive Super Star Clusters (SSCs) at the center of the galaxy are producing an outflow that encountered previously existing gas. In this contribution, we will explore whether the ionization conditions of the individual components detected in the study of the kinematics also supports this picture. The area considered in this study is depicted in Fig. 1.
[width=0.50]monrealibero_fg1a.ps
2 The data
The data used here were taken at the VLT with the ARGUS mode of FLAMES using the 0.52′′/lens sampling and the L682.2 and L479.7 gratings. Thus, we could map an area of with a spectral resolution of 12 500 in an unbiased manner, obtaining information about the main emission lines in the optical. Seeing was allowing for a very good spatial resolution. Details about data reduction and processing can be found in mon10a . The subject of this analysis (i.e. the Giant H ii Region) occupied roughly the left half of the ARGUS array. Its morphology is presented in the right part of Fig. 1: there is a main peak of emission and two tongue-shaped extensions towards the north-west and south-east.
t]
t]
3 Results
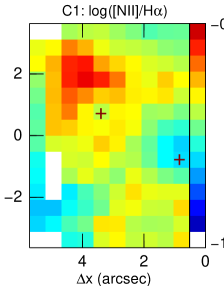
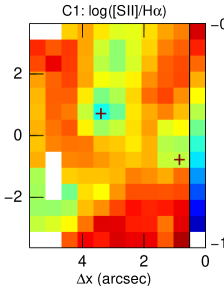
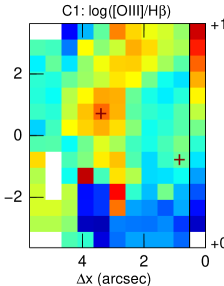
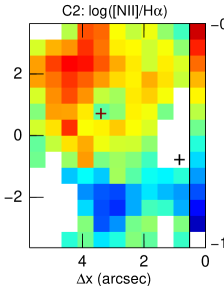
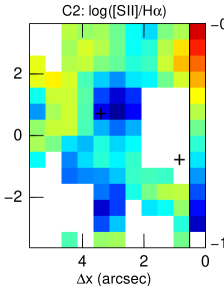
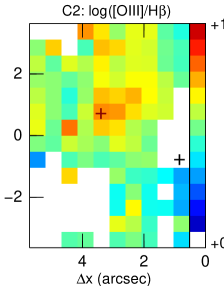
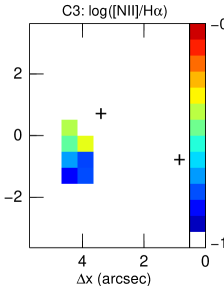
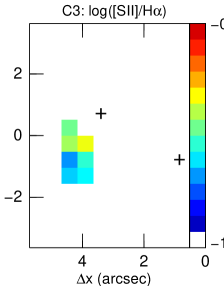
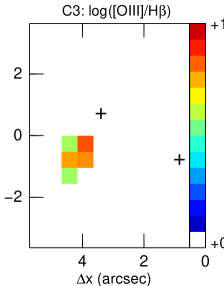
Maps for the line ratios involved in the so-called BPT diagrams bal81 ; vei87 for the three kinematically distinct components are presented in Fig. 2. For all of them, the [O iii]/H and [N ii]/H maps are relatively similar to those obtained after fitting each emission line to a single Gaussian. However, the [S ii]/H maps for the narrow component present larger line ratios than for the broad one. This is exactly what we would expect in a scenario like the one sketched in Fig. 20 of mon10a , where the broad component would be ionized by the stars in the SSCs while both, shocks and photoionization, could contribute to the line ratios associated with the shell.
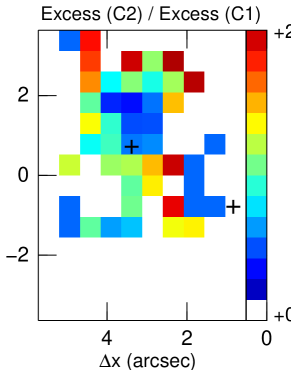
Following the same procedure as in mon10a , we estimated the relative excess in nitrogen. The three fitted components presented a nitrogen excess. Since C3 was detected only in seven spatial elements (spaxels) and in an area marginally contaminated, results for this component were uncertain and will not be considered further. Fig. 3 presents the ratio between the nitrogen excess measured for C2 (i.e. broad component) and C1 (i.e. narrow one). Clearly, the broad component presents more nitrogen excess than the narrow one with a mean (r.m.s.) in the central spaxels of 1.4(0.4). This is consistent with C2 being associated with material expelled from the central SSCs while C1 is associated with a shell around the SSCs.
Acknowledgements.
Based on observations carried out at the European Southern Observatory, Paranal (Chile), programme 078.B-0043(A). This paper uses the plotting package jmaplot, developed by Jesús Maíz-Apellániz, http://dae45.iaa.csic.es:8080/jmaiz/software. This work has been funded by the Spanish PNAYA, projects AYA2007-67965-C01 and, C02 as well as from CSD2006 - 00070 ”1st Science with GTC” from the CONSOLIDER 2010 programme of the Spanish MICINN.References
- (1) I.D. Karachentsev, et al., AJ 133, 504 (2007)
- (2) S. van den Bergh, PASP 92, 122 (1980)
- (3) S. Sakai, L. Ferrarese, R.C. Kennicutt, Jr., A. Saha, ApJ 608, 42 (2004)
- (4) A. Monreal-Ibero, J.M. Vílchez, J.R. Walsh, C. Muñoz-Tuñón, A&A 517, A27 (2010)
- (5) J.A. Baldwin, M.M. Phillips, R. Terlevich, PASP 93, 5 (1981)
- (6) S. Veilleux, D.E. Osterbrock, ApJS 63, 295 (1987)