The diffuse supernova neutrino background: Expectations and uncertainties derived from SN1987A
Abstract
Context. The detection of the diffuse supernova neutrino background may be imminent, but theoretical predictions are affected by substantial uncertainties.
Aims. We calculate the signal and its uncertainty with the present configuration of Super-Kamiokande and consider the possibility of lowering the threshold by means of gadolinium loading.
Methods. We model neutrino emission following the analysis of SN1987A by Pagliaroli and collaborators 2009 and use the number of expected events in the neutrino detector as a free parameter of the fit. The best-fit value of this parameter and its error are evaluated by means of standard maximum likelihood procedures, taking into account properly the correlations.
Results. The uncertainties in the astrophysics of the emission dominates the total uncertainty in the expected signal rate, which conservatively ranges from to events per year and from to with gadolinium.
Key Words.:
1 Introduction
Massive stars end their life exploding as core collapse supernovae (SN) and leaving compact remnants, such as neutron stars or black holes. Most of the binding energy is released by means of neutrino emission, though the details of the emission are not yet completely understood. The SN1987A event provided evidence that the neutrino emission exists and is detectable (Hirata et al. Hirata (1987); Bionta et al. IMB (1987); Alekseev et al. baksan (1988)). The neutrino signal offers us the most promising opportunity to date to probe this unique astrophysical system.
Neutrino emission from core-collapse supernovae that have exploded in the Universe cumulate in the diffuse supernova neutrino background (DSNB). The prospects of detection seem promising; for reviews and references to the original papers, we refer Ando & Sato (Ando (2004)) and Beacom (Beacom (2010)). To predict the DSNB signal, two different quantities are needed: the explosion rate of core collapse SNe as a function of the redshift and the average neutrino emission of the individual supernovae. Each of these quantities is known up to an error which implies uncertainty in the prediction. Until both uncertainties are quantified, it is impossible to evaluate the reliability of the expectations.
The rate of core-collapse supernovae can be identified with the rate of massive-star formation as a function of redshift. This quantity, in turn, can be obtained from knowledge of the cosmic history of star formation and the initial distribution of mass. Horiuchi et al. (Horiuchi:2008jz (2009)) used a comprehensive compilation of data to evaluate the uncertainty in the rate.
We attempt is to complement the study of the uncertainties by evaluating the impact of the neutrino emission for an individual supernova. Following Fukugita & Kawasaki (Fukugita (2003)), we base our inferences on SN1987A observations using for the analysis the neutrino emission model of Pagliaroli et al. (2009). We evaluate the expected signal and its uncertainty for the Super-Kamiokande detector. We consider its present configuration, 22.5 kton of fiducial volume with a threshold of MeV, Malek et al. (Malek (2003)) and consider the possibility of lowering the threshold to 11.3 MeV by employing gadolinium loading as advocated by Beacom & Vagins (bv (2004)).
2 The emission from an individual supernova
We determine the spectrum from SN1987A data, which we then use for the analysis of DSNB. This is done by parameterizing the time and energy distribution, then by fitting the data from Kamiokande-II, IMB, and Baksan and finally by integrating over the time distribution. The main motivation behind this procedure is that we still do not have a definitive theory of supernova explosion; thus, despite their paucity, the data from SN1987A play a very important role in guiding our understanding of supernova neutrino manifestations.
The model for supernova emission
Motivated by the prospect of exploring, through the neutrino signal, the physics and astrophysics of the gravitational collapse, we proposed in Pagliaroli et al. (AP (2009)) a parameterization of emission, based on our present understanding of emission processes improving the model by Loredo & Lamb (ll (2001)). Our model has two emission phases and the flux is
| (1) |
where is the emission time and is the emitted neutrino energy. The first term is the flux generated during the phase of accretion and above the shock by the interactions between the positrons and the target neutrons. It describes volume emission. It uses three free parameters: the initial accreting mass , the time scale , and the initial temperature of the positrons . The second term is the flux coming from the thermal emission of the new-born proto-neutron star (i.e., the cooling phase). It describes radiation from a surface, whose area is proportional to the radius of the neutrino sphere , with a time scale and the initial temperature of the emitted antineutrinos . Finally, the function links smoothly the two emission phases, delaying the cooling emission by . Analytic expressions of these three functions, , , and are given in Eqs. 10, 13 and 18 of Pagliaroli et al. (AP (2009)), respectively. We include neutrino oscillations with normal hierarchy as discussed in Sec. C of Pagliaroli et al. (AP (2009)).
SN1987A data analysis
In Pagliaroli et al. (AP (2009)), we tested the parameterized model using the small set of events collected in 1987 by Kamiokande-II, IMB, and Baksan, leaving aside an interpretation of the events recorded by LSD (Aglietta et al. LSD (1987)). When we compared the fit based only on the cooling phase, the one adopted in usual SN1987A data analyses, with our fit, we found that the two-phase emission model is 50 times more probable (i.e., we got a indication in its favor). Moreover, the best-fit values of the astrophysical parameters, namely , , , , , and , agree well with the general expectations. For instance, the duration of the accretion phase is shorter than one second, the radius of the neutrino sphere is similar in size to the neutron star, and the total radiated energy erg is similar to the binding energy. Finally, the luminosity curve and the mean energy as functions of time both resemble the results of numerical simulations. The errors in the parameters and their correlations are large, as expected from the limited number of events (see again Pagliaroli et al. AP (2009)).
The previous analyses of SN1987A data of Lunardini (Lunardini (2006)) and Yuksel and Beacom (Yuksel (2007)) designed to predict DSNB focused only on the energy spectrum, motivated by the opinion that the time distribution of the events is irrelevant. However, we show that our detailed theoretical description of neutrino emission leads to a peculiar integrated spectrum that retains an imprint of the two different emission phases.
The emission spectrum
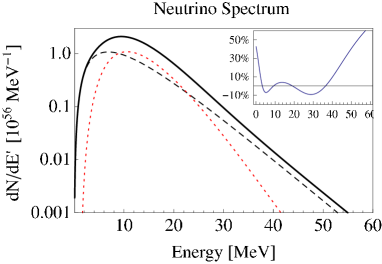
By substituting in the flux of Eq.(1) the best-fit values reported in the previous paragraph and integrating both in a s time window and on the emitting surface, we obtain the reference spectrum for a single supernova event from SN1987A shown in Fig. 1. We compare this spectrum with a Fermi-Dirac distribution, i.e., . To obtain the same total integral and the same first two momenta between our spectrum and the Fermi-Dirac distribution, we need , a temperature , and a pinching factor . However, the percentage difference between the Fermi-Dirac spectrum and our spectrum is not negligible as shown in the inset of Fig. 1. The agreement worsens using the parametrization of Keil et al. (keil (2003)). The emitted electron antineutrinos of our best-fit spectrum are of relatively low energy; half of them are emitted at energies below 11.2 MeV. In particular, when we calculate the number of events expected from a galactic supernova assuming an energy threshold of MeV, as a function of the upper extreme of integration , we find that there are the 25%, 50%, and 75% of the events below =14, 18, and 24 MeV, respectively.111Of course, denotes the cross-section for the IBD process . We use Eq. 25 of Strumia & Vissani (Strumia:2003zx (2003)) and throughout the paper, we adopt the approximation MeV, which is adequate for our needs. Unless specified otherwise, we always refer to energy.
3 Expectations for the diffuse neutrino flux
We estimate the diffuse neutrino flux accumulated by all the past supernovae exploded in the Universe, assuming that the antineutrino flux discussed in the previous Section represents the typical emission of a core-collapse event.
In a Friedmann-Robertson-Walker flat Universe, the expected DSNB flux is
| (2) |
The last term of the integrand, , is the spectrum of a single SN emission discussed above and calculated for the red-shifted energy . The Hubble constant is , is the light speed, and the values of the cosmological constants are , as measured from the WMAP experiment in Jarosik et al. (Jarosik:2010iu (2010)). These assumptions do not introduce significant errors into the predictions.
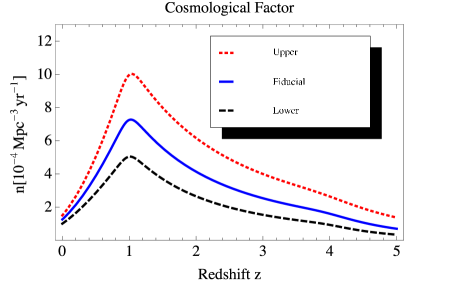
The key term we have to discuss is , namely the rate of core-collapse SN for comoving volume as a function of the redshift . This function can be obtained from the number of stars formed in a comoving volume, i.e., from the star formation rate as a function of the redshift, and from the fraction of stars in the appropriate mass range for core collapse SNe. Following Horiuchi et al. (Horiuchi:2008jz (2009)), we adopt the initial mass function of Salpeter (Salpeter (1955)) and three different analytic fits for the rate of core-collapse to take into account the astrophysical uncertainty. In Fig.(2), we show the quantity
| (3) |
which we call the “cosmological factor”, namely the first integrand term in Eq. (2). This plot summarizes all the relevant assumptions about the cosmology and the distribution of the sources. Horiuchi et al. (Horiuchi:2008jz (2009)) demonstrated that the use of either the Kroupa (kroupa (2001)) or Baldry & Glazebrook (BG (2003)) initial mass functions, or the uncertainties in the lowest mass that forms a supernova, introduces only a negligible error in the estimates.
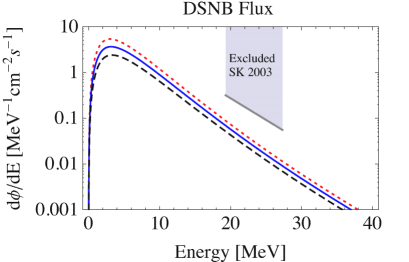
We now use Eq. (2) to calculate the flux of the diffuse SN neutrino background as a function of the neutrino energy at the Earth. We plot it in Fig. (3) along with the upper bound in the energy region MeV of cm-2 s-1 obtained by the Super-Kamiokande collaboration (Malek Malek (2003)). The total flux of DSNB with the SN1987A best-fit model is for the fiducial rate. Only of this flux can be actually observed with a neutrino energy threshold of MeV; with the use of gadolinium, the accessible spectrum becomes , showing that most of the flux falls in the very low energy region.
Event rate in Super-Kamiokande
We consider the events expected in a detector such as Super-Kamiokande, with a fiducial mass of kton of water and a detection efficiency set equal to the above a neutrino energy threshold ( MeV in the present configuration or MeV by loading the detector with gadolium). However, we note that a scintillator-based detector with average chemical formula C9H21 (or C6H3(CH3)3) and with 16 (or 25) kton of mass has the same number of target protons , thus the same number of interactions. The event rate is calculated easily as
| (4) |
For the best-fit model adopted, we expect to see in Super-Kamiokande the number of events per year reported in Table(1) for two different energy thresholds and three different fits of the rate. We expect events per year when we consider a threshold of MeV; this increases to events per year lowering the energy threshold to MeV. Our results agree well with those of Horiuchi et al. (Horiuchi:2008jz (2009)).
| CCSN Rate | ||
|---|---|---|
| Upper | ||
| Fiducial | ||
| Lower |
4 Uncertainty due to the emission model
In Sect. 3, we discussed the expectations for the DSNB flux based on the SN1987A best-fit model and we considered only the uncertainty related to the core-collapse rate. However, the SN1987A data set is small and the procedure of using only the best-fit model is doubtful, until one estimates the associated theoretical error. The main aim of this work is, indeed, to quantify this uncertainty, which is an entirely new result.
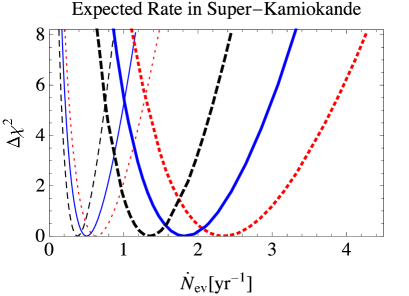
We proceed as follows. The likelihood in the SN1987A data analysis used by Pagliaroli et al. (AP (2009)) is a function of six unknown astrophysical parameters. The same is true for the DSNB rate . For a given energy threshold, this can be written explicitly as , where the two contributions correspond to the two terms of Eq. (1) and and are known functions. The idea is simply to rewrite the likelihood, substituting the neutrino-sphere radius with the quantity in which we are interested, . We can then apply a standard marginalization procedure: for each fixed value of and varying the other five parameters, we find the maximum value of the likelihood . Thus, we obtain a function of only.
The results of the numerical evaluations of this are shown in Fig.(4). The thin lines represent the neutrino energy threshold used in Malek et al. (Malek (2003)), , whereas the thick ones correspond to the threshold of that can be achieved with gadolinium. Three lines of each type are given, for the three different fits of the cosmic rate for core-collapse events. The and errors found from the curves are reported in Table (1).
We note that this procedure properly takes into account the correlations among the parameters, that are dictated by the likelihood function, without the need to explicitly calculate the covariance matrix.
5 Summary and discussion
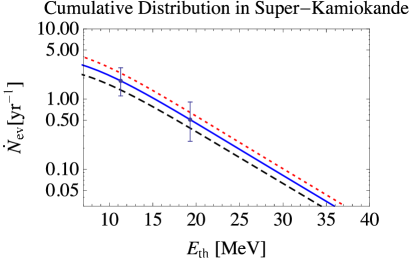
We have evaluated the signal expected for diffuse supernova neutrino background in Super-Kamiokande and its associated uncertainties, using SN1987A data to constrain the model of neutrino emission. The results are summarized in Fig.(5), where we show the cumulative rate of DSNB events in Super-Kamiokande as a function of the energy threshold for the three different fits of the core-collapse rate.
Following Horiuchi et al. (Horiuchi:2008jz (2009)), we used the three different fits as a “generous” assessment of the cosmological uncertainty, although we are unable to attach to this range a precise statistical meaning. The result is given in Table (1): the cosmological uncertainty is for the higher threshold and for the lower threshold, in reasonable agreement with Horiuchi, despite the different emission model used.
On the other hand, selecting the fiducial cosmological model for the rate, we evaluated the uncertainty on the DSNB due to the emission model. The (resp. ) percentage error is (resp. ) for the higher threshold and becomes (resp. ) for the lower threshold. The prediction is more precise in the second case since the SN1987A data provide a tighter constraint of the low energy region of the spectrum. On the basis of the results of Pagliaroli et al. (AP (2009)), we conservatively estimate a 10% systematic uncertainty in our spectrum, which is intrinsic to the parameterization used in the fit. Our ranges are curiously similar to those obtained by Ando & Sato (Ando (2004)), who use three different emission models obtained from numerical simulations.
It is difficult to combine the two errors in a robust way, since only the one related to the emission model has a precise statistical meaning. We thus construct a global range for the expected rate of DSNB events by the following conservative procedure. The upper value of the range is obtained by summing the best-fit value for the upper core collapse SN rate and its upward (resp., ) statistical error; similarly, for the lower value of the range. In particular for MeV, the expected event rate in Super-Kamiokande ranges between (resp., ) events per year and (resp., ) events per year, giving a global uncertainty of (resp., ). For the lower energy threshold MeV, the range becomes (resp., ) events per year with a percentage total error of (resp., ). As quantified by the percentage errors, most of the global uncertainty is due to the emission model uncertainty and to the low number of SN1987A data.
Appendix A An alternative expression for the rate
We introduce an alternative expression for that emphasizes the role of the supernova flux at the source providing additional insigh into the results. From the emission spectrum , we define an effective flux
| (5) |
where we have introduced the typical value for the cosmic density of SN/(Mpc3 yr) and the observational time . By using as an integration variable (i.e., the neutrino energy at the emission), we rewrite the signal rate in Eq. (4) mimicking closely the signal from a galactic supernova
| (6) |
The distribution of cosmic supernovae is contained in the function
| (7) |
This function leads to a severe cut in the rate of events given by Eq.(6). Above the energy threshold, this function can be approximated linearly as
| (8) |
which corresponds to DSNB selecting the highest energy tail of the spectrum. This is important in connection with SN1987A. We have only limited information on the highest energy tail of the spectrum, mostly thanks to IMB, as noted by Fukugita et al. Fukugita (2003). We can constrain far more reliably the spectrum at lower energies, thanks to data from Kamiokande-II and Baksan. Thus, we expect, by lowering the threshold, not only the number of events due to DSNB to increase, but also the accuracy of the predictions based in SN1987A to improve, in agreement with Fig. 5. We also note that the numerical value of in Eq. (5) agrees with the DSNB signal being modest.
References
- (1) M. Aglietta et al., 1987 Europhys. Lett. 3 1315-1320.
- (2) E.N. Alekseev et al. 1988 Phys.Lett.B 205 209.
- (3) S. Ando, K. Sato, T. Totani, 2003 Astropart. Phys. 18 307-318.
- (4) S. ’i. Ando, K. Sato, 2004 New J. Phys. 6 170.
- (5) I. K. Baldry and K. Glazebrook, 2003, Astrophys. J. 593, 258.
- (6) J. F. Beacom, M. R. Vagins, 2004 Phys. Rev. Lett. 93 171101.
- (7) J. F. Beacom, 2010 arXiv:1004.3311 [astro-ph.HE].
- (8) R. M. Bionta et al. 1987 [IMB Collaboration], Phys. Rev. Lett. 58 1494.
- (9) M. Fukugita, M. Kawasaki, 2003 Mon. Not. Roy. Astron. Soc. 340 L7.
- (10) K. Hirata et al 1987 [Kamiokande-II Collaboration], Phys. Rev. Lett. 58 1490.
- (11) S. Horiuchi, J. F. Beacom and E. Dwek, 2009 Phys. Rev. D 79 083013
- (12) N. Jarosik et al., 2010 arXiv:1001.4744 [astro-ph.CO].
- (13) M. T. Keil, G. G. Raffelt, H. -T. Janka, 2003 Astrophys. J. 590 971.
- (14) P. Kroupa, 2001 Mon. Not. Roy. Astron. Soc. 322, 231.
- (15) T. J. Loredo, D. Q. Lamb, 2002 Phys. Rev. D65 063002.
- (16) C. Lunardini, 2006 Astropart. Phys. 26 190-201.
- (17) M. Malek et al. [Super-Kamiokande Collaboration] 2003, Phys. Rev. Lett. 90 061101.
- (18) G. Pagliaroli, F. Vissani, M.L. Costantini and A. Ianni, 2009, Astropart. Phys. 31 163.
- (19) E. E. Salpeter, 1955, Astrophys. J. 121, 161.
- (20) A. Strumia and F. Vissani, 2003 Phys. Lett. B 564 42 [arXiv:astro-ph/0302055].
- (21) H. Yuksel, J. F. Beacom, 2007 Phys. Rev. D76 083007.