VLA and ATCA Search for Natal Star Clusters in Nearby Star-Forming Galaxies
Abstract
In order to investigate the relationship between the local environment and the properties of natal star clusters, we obtained radio observations of 25 star-forming galaxies within 20 Mpc using the Very Large Array (VLA) and the Australia Telescope Compact Array (ATCA). Natal star-forming regions can be identified by their characteristic thermal radio emission, which is manifest in their spectral index at centimeter wavelengths. The host galaxies in our sample were selected based upon their likelihood of harboring young star formation. In star-forming regions, the ionizing flux of massive embedded stars powers the dominant thermal free-free emission of those sources, resulting in a spectral index of (where ), which we compute. With the current sensitivity, we find that of the 25 galaxies in this sample only five have radio sources with spectral indices that are only consistent with a thermal origin; four have radio sources that are only consistent with a non-thermal origin; six have radio sources whose nature is ambiguous due to uncertainties in the spectral index; and sixteen have no detected radio sources. For those sources that appear to be dominated by thermal emission, we infer the ionizing flux of the star clusters and the number of equivalent O7.5 V stars that are required to produce the observed radio flux densities. The most radio-luminous clusters that we detect have an equivalent of O7.5 V stars, and the smallest only have an equivalent of O7.5 V stars; thus these star-forming regions span the range of large OB-associations to moderate “super star clusters” (SSCs). With the current detection limits, we also place upper limits on the masses of clusters that could have recently formed; for a number of galaxies we can conclusively rule out the presence of natal clusters significantly more massive than the Galactic star-forming region W49A ( M⊙). The dearth of current massive cluster formation in these galaxies suggests that either their current star formation intensities have fallen to near or below that of the Milky Way and/or that the evolutionary state that gives rise to thermal radio emission is short-lived.
1 Introduction
Most stars are born in clusters or associations of some kind (e.g. Lada & Lada, 2003; de Wit et al., 2005). As a result, the clustered mode of star formation plays a fundamental role in understanding star formation in general. In the Galaxy, stars within a cluster can often be individually resolved, and thus detailed studies of the resolved structure and interplay between stars are possible. However, our Galaxy only presents a narrow range of environmental conditions, and we are compelled to study more distant objects in order to investigate the impact of different environments on star cluster formation.
In relatively nearby starburst galaxies ( Mpc), recent star formation activity has typically been resolved in massive star clusters. The Hubble Space Telescope (HST) was instrumental in the discovery of the so-called “super star clusters” (SSCs), which have been detected in significant numbers (e.g. Whitmore, 2002). Large samples of less massive clusters have also been detected, typically following a power-law distribution down to the completeness limits of the data. However, despite the large samples of high quality optical data, the impact of the local environment on massive star cluster formation is far from understood. One of the primary obstacles has been the very nature of star formation, which is obscured at optical wavelengths. Once clusters have emerged from their birth material to be observable in optical light, their birth environments can no longer directly be probed.
To study the dependence of environment on star formation, it is necessary to penetrate through the optically thick cocoon before the system has had time to evolve and disperse its gas and dust, which Kobulnicky & Johnson (1999) have estimated to last 15% of the lifetimes of the embedded cluster’s stars. To find evidence of natal clusters of massive stars, observations at wavelengths a few m are necessary. High spatial resolution radio observations at centimeter wavelengths are a powerful way to identify the earliest phases of star-formation regions via their “inverted” spectral indices , where and ; this type of spectral energy distribution is similar to that of HII regions, which exist on a smaller scale around individual massive stars in our Galaxy, i.e., ultracompact HII regions (Wood & Churchwell, 1989). If the larger ultra-dense HII regions (UDHIIs) associated with natal clusters of massive stars emit sufficient thermal bremsstrahlung radiation, we can detect the signature of this radiation by its radio signature.
High spatial resolution radio observations have revealed a sample of very young massive star clusters still embedded in their birth material in a number of galaxies, including: NGC 5253 (Turner, Ho, & Beck, 1998), He 2-10 (Kobulnicky & Johnson, 1999; Johnson & Kobulnicky, 2003), NGC 2146 (Tarchi et al., 2000), NGC 4214 (Beck et al., 2000), Haro 3 (Johnson et al., 2004), NGC 4449 (Reines et al., 2008), and SBS 0335-052 (Johnson et al., 2009). These heavily enshrouded clusters contain hundreds to thousands of young massive stars; these nascent stars create compact HII regions within the dense environment and manifest themselves as optically thick free-free radio sources, some of which have been confirmed as luminous mid-infrared sources (Beck, Turner, & Gorjian, 2001; Gorjian, Turner, & Beck, 2001; Vacca, Johnson, & Conti, 2002; Reines et al., 2008).
Perhaps not surprisingly, the most massive and luminous natal clusters were the first to be identified in nearby galaxies (as in the sample cited above). However, if star cluster formation tends to follow a power-law, as suggested by optical studies (Whitmore, 2002), we should expect to find a continuum of extragalactic star clusters ranging from objects similar to individual Galactic UCHII regions to the massive proto-globular clusters common in starburst galaxies. Furthermore, current theory suggests that the properties of massive star clusters will largely be dependent on the pressure of their formation environment (Elmegreen & Efremov, 1997). Therefore, the most vigorous starbursts host the most massive star clusters, while relatively quiescent galaxies (like our own Milky Way) will tend to contain only low mass clusters and associations. If we wish to understand how massive star cluster formation depends on the local environmental properties as well as to understand it in a statistical sense, we must fill in the continuum between galactic UCHIIs and natal SSCs with the aim of building a large sample. For this purpose, the observations presented here are part of an effort to increase the known sample of natal clusters in relatively nearby galaxies. We use the NRAO111The National Radio Astronomy Observatory is a facility of the National Science Foundation operated under cooperative agreement by Associated Universities, Inc. Very Large Array (VLA) and the ATNF222The Australia Telescope National Facility, a division of the Commonwealth Scientific and Industrial Research Organisation, operates ATCA. Australia Telescope Compact Array (ATCA) to image 25 galaxies selected for their likelihood of containing natal star formation.
2 Observations
2.1 The Sample
This sample includes 25 galaxies that were selected for this study based on their distance and their likelihood of containing natal star formation. Indicators of possible natal star formation included either (1) membership in the Markarian UV catalog, the Arp catalog of irregular and tidally interacting galaxies, or the VV catalog of interacting galaxies (18 out of the 25 galaxies), or (2) evidence of Wolf-Rayet (W-R) features in the host galaxy’s spectra (10 out of the 25 galaxies), necessitating the presence of young massive stars, or (3) identification of the galaxy as a blue compact dwarf (BCD), again an indicator of recent star formation (6 out of the 25 galaxies). Several of the galaxies in this sample fall into more than one of these three categories. Due to sensitivity and spatial resolution limitations, only galaxies within 20 Mpc were included. We give a brief overview of the selected galaxies in §A.1-A.2, and their characteristics are summarized in Table 1.
2.2 VLA and ATCA Observations
We observed the eight southern hemisphere galaxies in our sample on 2002 March in 3 cm (8.6 GHz) and 6 cm (4.8 GHz) bands with the Australia Telescope Compact Array (ATCA) in the 6A configuration. With the Very Large Array (VLA), we observed the 19 northern hemisphere galaxies on 2002 February 15 and 2002 October 21 using the A-configuration for 3.6 cm (8.5 GHz) and the C-configuration for 1.3 cm (22 GHz) observations.
For the ATCA data, we excluded visibilities with values k in the 6 cm band to better match the largest spatial scale to which the 3 cm observations are sensitive. We then imaged the ATCA 3 cm data with a robustness parameter of 3.0 (close to natural weighting), which helped to mitigate noise levels in that band, and imaged the 6 cm data with a robustness of 0.0 to add more weight to longer baselines, thereby increasing the spatial resolution of the resulting images. Finally, we matched the convolution kernel of the ATCA 3 cm images to that of the 6 cm images during the imaging process.
We followed a similar procedure to create images of the VLA data. Since the VLA was in the A-configuration for the 3.6 cm observations, the resulting images have higher spatial resolution than images made with 1.3 cm observations in the C-configuration. Consequently, we imaged the 1.3 cm data with a robustness parameter of 3.0 and excluded all visibilities k in the uv plane. This process approximately matches the largest spatial scale to which the data are sensitive. The 3.6 cm data were imaged with a robustness parameter of 0.0 in order to obtain slightly higher angular resolution than with natural weighting.
We created images of all ATCA and VLA data with the IMAGR task of the Astronomical Image Processing System (AIPS). The parameters for the imaging process are summarized in Table 2, and the resulting radio contours for galaxies with detected emission are shown overlaid on optical or infrared images in Figures 1 to 9.
The nature of a radio source can be constrained using its spectral index , where . Supernova remnants typically have radio spectral indices of (e.g. Green, 1984; Weiler et al., 1986). Thermal sources (e.g. HII regions) can be identified by their signature thermal bremsstrahlung emission. Purely optically thin thermal emission has , while in the optically thick limit the emission has . The specific spectral morphology of an HII region at radio frequencies is due to a combination of size and density structure. The frequency at which thermal emission transitions from optically thick () to thin () is higher for denser HII regions.
In order to compute a spectral index
| (1) |
based on two flux densities and frequencies , it is important to match the spatial scales to which the different frequencies are sensitive in so far as possible. Given the nature of interferometers, it is virtually impossible to match the synthesized beams precisely, but steps can be taken to improve the extent to which the synthesized beams are compatible. To this end, when imaging the radio observations presented in this paper, we limited the coverage of each data set, we varied the weighting of longer and shorter baselines, and finally we convolved the frequencies to the same synthesized beam. (This final step does not compensate for any missing coverage; however, it is important to match the point response function.)
For the purposes of this paper, we consider a source to be dominated by thermal emission if it has a spectral index that is consistent with within uncertainty (Table 5). Likewise, we consider a source to be dominated by non-thermal emission if it has a spectral index that is consistent with given uncertainty. However, in many cases it is not possible to determine unambiguously whether a source is thermal, non-thermal, or a combination thereof for two main reasons: (1) several of the sources presented here are clearly extended and likely contain multiple components, and (2) the spectral indices have significant uncertainties, and many sources that nominally appear thermal could also be consistent (within uncertainty) with being non-thermal and vice versa; we classify these sources as “ambiguous.”
3 Results
Of the 25 galaxies in this study, only five have radio sources that are dominated by thermal emission, four have sources that are dominated by non-thermal emission, six have radio sources that are ambiguous within the uncertainty limits, and sixteen have no detected radio sources (Figures 1 to 9; Tables 3 and 4). To measure the flux densities, we used the AIPS++ VIEWER program333This capability is now available within CASA software. to create identical polygonal apertures around each of our sources at 3 and 6 cm for the ATCA data and at 1.3 and 3.6 cm for the VLA data. By using identical convolution kernels and apertures, we are able to maximize the accuracy of the relative photometry. Errors in the flux densities were determined by adding in quadrature the uncertainties due to the absolute flux calibration, variation from the sky background, and changes in the size and shape of the aperture. For the purposes of determining the uncertainties in the spectral index , the final term in the uncertainty due to variation in aperture is neglected as identical apertures are used at both frequencies. See Tables 3 and 4 for integrated and peak flux densities as well as spectral indices of each source.
3.1 Ionizing Luminosities and Cluster Masses
Massive, short-lived stars drive the thermal free-free emission we observe at radio wavelengths; hence, an understanding of the photo-ionization rate for each of our candidate UDHII regions enables us to predict the number of massive stars in a cluster. Lyman continuum photons ionize these HII regions; thus, with knowledge of the radio luminosities, we can predict a lower bound on the Lyman continuum flux (Condon, 1992),
| (2) |
A number of possible issues must be kept in mind when interpreting the values and radio flux densities. First, the application of this equation assumes the emission is purely thermal and optically thin. Contamination from non-thermal emission within the synthesized beams is also a possible issue at the spatial resolutions used here, and would inflate the resulting values. To partially mitigate these issues, it is advantageous to use flux densities obtained at the highest radio frequency available for two reasons: (1) the higher frequency emission suffers from less self-absorption and is therefore more likely to be optically thin, and (2) the higher the frequency, the less likely it is to contain a significant amount of non-thermal contaminating flux. Second, an electron temperature must also be assumed, and we adopt a “typical” HII region temperature of K; the uncertainty in due to this assumption is %. Finally, the actual values could be higher than observed if a significant fraction of the ionization radiation is either absorbed by dust within the HII region or suffers from significant leakage through a porous ISM. Thus, when these conditions are met, the values quoted here should be interpreted as lower limits.
The inferred values for of each of the identified thermal sources are shown in Table 5. Assuming each of these thermal sources contains an embedded star cluster, we also estimate the number of O7.5 V stars, each having a Lyman continuum flux s-1 (Vacca, 1994), required to produce the observed free-free, thermal radio flux (see Table 5).
We used the stellar synthesis code Starburst99 (Leitherer et al., 1999) in combination with to estimate the total stellar masses of the natal clusters. Following Johnson et al. (2003), we assume each cluster has a metallicity and a Salpeter IMF from 1 to 100 M☉. Assuming the values scale directly with the cluster mass and that the clusters are Myr old, we infer stellar masses for the radio detected star-forming regions ranging between M☉ and M☉ (see Table 5). The most massive of these star-forming regions also appear to be slightly spatially extended at the resolution of these observations and likely include a number of star clusters that are not resolved.
3.2 Inferred Sizes of Thermal Sources
In order to determine the sizes of the detected sources in Table 5, we initially fit a Gaussian profile to each source, from which the synthesized beam was deconvolved in order to estimate the actual source sizes. The major limitation of this method is that it requires the source to be roughly Gaussian, which is not true for many sources presented here, some of which appear to have quite complex structure. Nevertheless, this method will, at a minimum, provide information about whether or not a source is extended at the resolution of the observation. Using this method, we infer the physical sizes of the star forming regions based upon the distances in Table 6 and deconvolved angular sizes in Tables 3 and 4, with resulting sizes ranging between pc to a few pc. These sizes are much larger than one would expect for an individual cluster (a few pc); thus we conclude that most of the radio-detected star-forming regions presented here are likely to be groups of individual clusters, which may well be at slighltly different evolutionary states. Furthermore, these large inferred sizes allow for a complex origin for the observed emission and potential non-thermal contamination; there is ample room within these large regions for a large number of ultracompact HII regions, evolved HII regions, SNR, and other objects. Higher spatial resolution observations are clearly required in order to disentangle the components of the complex sources and facilitate more precise size measurements.
3.3 Comparison to Cas A and W49A
In order to provide a comparison for the relative fluxes of non-thermal and thermal sources, we calculate the expected flux densities and detection thresholds for the Galactic supernova remnant Cas A, an UCHII region complex W49A at the distance of the galaxies in this sample. Cas A is the canonical “young” core collapse SNR in the galaxy, with the highest luminosity and youngest age of any such remnant in the Milky Way (Baars et al., 1977; Fesen et al., 2006). Likewise, W49A is a benchmark star-forming region in the galaxy, with individual thermal radio sources and s-1 (e.g. De Pree et al., 2000). The expected signal-to-noise for analogs to Cas A and W49A in our sample galaxies at 3.6 cm are shown in Table 6. For example, if Cas A would have been a detection in a given galaxy, we would be unlikely to identify an individual supernova remnant. If W49A would have been a detection in a given galaxy and yet no thermal sources are detected, such a detection limit would suggest no current star formation above this limit in that galaxy.
Given our detection limits for objects similar to Cas A and W49A, there are a few striking non-detections that merit further investigation. For example, in the galaxy Mrk 1479 ( Mpc, Tully, 1988; Marakova & Karachentsev, 1998), Cas A and W49A would have exhibed detections at the level of and , respectively; yet no radio sources are detected. The lack of such natal clusters could suggest that the current star formation rate in Mrk 1479 is below that of the Milky Way. However, the inclusion of Mrk 1479 in both the Markarian catalog of ultraviolet bright galaxies and Vorontsov-Velyaminov (VV) catalog of interacting galaxies suggests that it must have recently been undergoing vigorous star formation. Thus, the lack of detected thermal radio sources in this case supports the hypothesis that the natal stage of a cluster’s evolution is extremely short.
4 Conclusions
In this radio study of 25 galaxies selected based upon their optical signposts of star formation, we expected to detect a number of thermal radio sources originating from massive nascent star clusters. However, we only detect definite thermal-dominated radio sources in five of the sample galaxies, with an additional six galaxies hosting radio sources whose origins are ambiguous within uncertainties. Using the benchmark Galactic star-forming region W49A, we put these non-detections in context; in several galaxies, W49A would have been a detection. For example, Mrk 1479 is a notable case of a UV galaxy, included in both the VV and Markarian catalogs, with no evidence of thermal radio emission coming from an object similar to W49A at a level. For the five galaxies with detected thermal radio sources, the inferred properties of the nascent clusters range from large OB-associations to moderate super star clusters—extending both above and below the mass of W49A.
One hypothesis to explain the dearth of natal clusters in this sample is that the timescale a star-forming region spends in a stage that is detectable in radio is extremely brief. Johnson (2004) suggest that SSCs may spend as little as to Myr in the embedded phase when they are detectable with thermal radio emission. Compared to galaxy evolution timescales, the time interval for star formation is very short. Our results are consistent with this hypothesis, however a more complete statistical sample is needed to better constrain the timescales. Such a larger and complete sample would allow us to compare the number of clusters in different evolutionary stages and track the emergence process.
While this study was intended to identify candidate natal star-forming regions in nearby galaxies, follow-up efforts are imperative. In particular, this work would benefit from higher spatial resolution observations than those presented here. Such observations will be critical for disentangling thermal and non-thermal sources in close proximity. In addition, higher frequency radio observations will provide much stronger constraints on the the spectral energy distributions of the thermal radio sources. In particular, high spatial resolution observations at GHz will be useful for better understanding the relationship between between cluster properties and the local environment in which they are formed.
Appendix A Notes on Individual Galaxies in this Sample
A.1 Galaxies Observed with the VLA
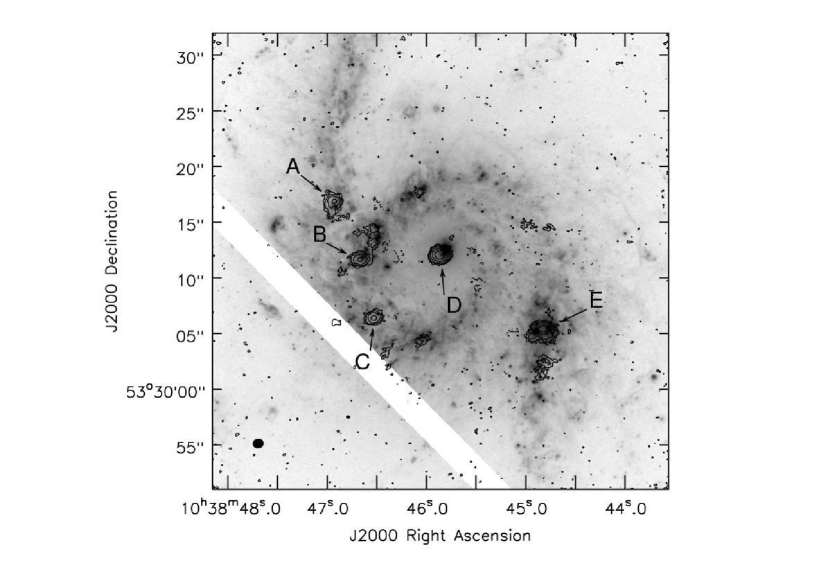
Arp 217 Arp 217 (NGC 3310, VV 356/406, UGC 5786)—peculiar SAB(r)bc galaxy with giant HII regions that may have merged with another galaxy in the past (Sharp, 1996). Situated at 19.6 Mpc with an angular size of , it contains W-R stars in its HII clouds, which are 12 arcsec southwest of its nucleus (Zezas et al., 1998). Rosa-González et al. (2007) estimate the SFR of Arp 217 to be 7.6 M☉ yr-1 and 9.8 M☉ yr-1 based on H and 1.4 GHz magnitudes, respectively. Using ROSAT and ASCA observations, Zezas et al. (1998) find hard x-ray emission in the direction of Arp 217. Based on observations at other wavelengths, this x-ray source could not be an AGN; therefore, Zezas et al. (2004), using Chandra, conclude that the source of x-rays is due to star formation. Elmegreen et al. (2002) find 17 superstar cluster candidates in the southern spiral arm of Arp 217.
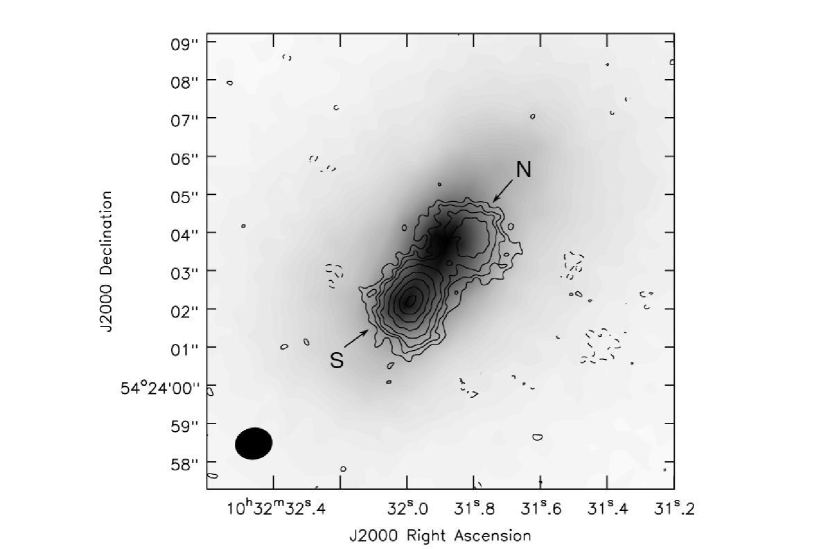
Arp 233 Arp 233 (Haro 2, Mrk 33, or UGC 05720)—irregular, BCD galaxy of at 22 Mpc. In their optical survey of BCD galaxies, Gil de Paz et al. (2003) deduce that because Arp 233 has a B-band absolute magnitude and a K-band absolute magnitude , it must be experiencing a massive starburst. Summers et al. (2001) estimate, based on evolutionary synthesis models and , that the age of the Arp 233 starburst is 5.8 Myr and that its mass is M☉.
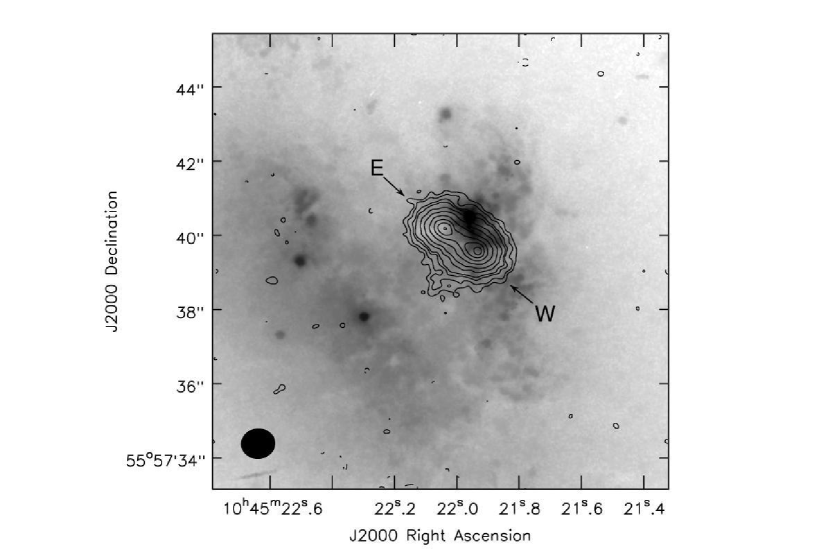
Mrk 35 Mrk 35 (NGC 3353, UGC 5860, Haro 3)—a BCD galaxy of . At 13.1 Mpc it has an optical diameter of kpc (Steel et al., 1996). Since W-R stars have been found in Mrk 35, it must have undergone recent star formation with a peak starburst event occurring within the last 3-6 Myr (Johnson et al., 2004).
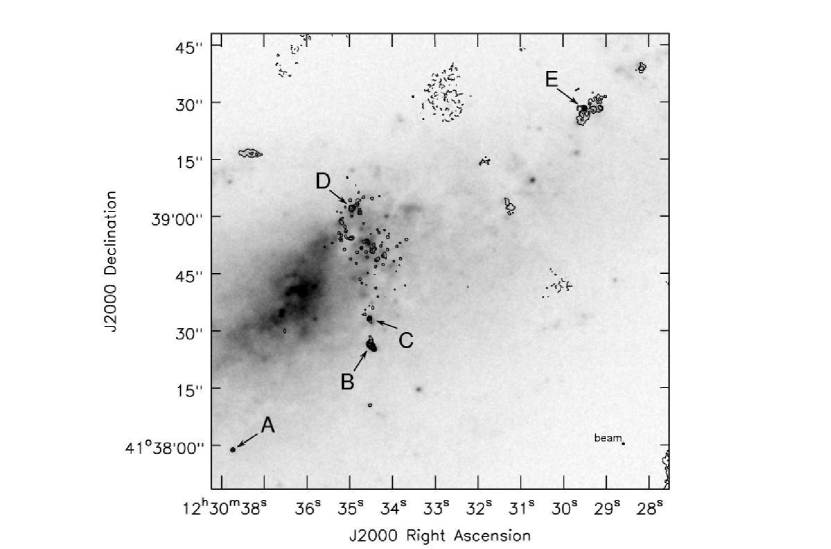
NGC 4490 NGC 4490 (UGC 7651, Arp269, VV 30a)—peculiar SB(s)d galaxy at 8.4 Mpc which has interacted with NGC 4485, northwest of NGC 4490. Elmegreen et al. (1998) have determined, with N-body simulations and an analysis of tidal morphologies, that the two interacting galaxies collided yr ago, about the same time the youngest star forming regions in the galaxy pair formed. Clemens et al. (1998) observed with the VLA a large H I envelope surrounding the galaxies and discuss the possibility that the H I might be primordial gas from which the NGC 4490/4485 pair formed.
Arp 32 Arp 32 (UGC 10770, VV89)—peculiar type SBm galaxy pair at a distance of 17 Mpc. Damjanov et al. (2006) performed multi-wavelength photometry on Arp 32 with GALEX UV, KPNO-4m optical, near-IR, Spitzer infrared, and 20 cm VLA radio data. They formed an SED of the galaxy pair and fit it to a galaxy model. The best fit model to the upper companion of Arp 32 suggests that it is an elliptical galaxy with a 5 Gyr stellar population with 10-30% of the stars Gyr. For the lower component of Arp 217, the UV SFR is 0.12 M☉ yr-1 while the IR SFR is larger, 1 M☉ yr-1; this suggests obscured star formation.
Arp 263 Arp 263 (NGC 3239, UGC 5637, VV 95)—peculiar IB(s)m galaxy at 9.1 Mpc. Krienke & Hodge (1990) use H and neutral hydrogen observations to detect evidence of new star formation in Arp 263. In addition to evidence of young star formation, they find a warped disk and tidal tails suggesting Arp 263 has interacted tidally with a currently unseen companion.
Arp 266 Arp 266 (NGC 4861, UGC 8098, IC 3961, VV 797, IZW49)—an SB(s)m starburst galaxy at 12 Mpc. Mrk 59 and I Zw 49 are the HII regions within the galaxy. From 4650 Å to 4750 Å, García-Lorenzo et al. (1999) find a W-R emission bump in the spectra of the nuclear, region of Arp 266. In their continuum map, they observe that Arp 266 has an elongated morphology, common in W-R and merging galaxies. Barth et al. (1994) observed—in H, H, and [O III] 5007—28 HII regions in Arp 266. They note a correlation between the equivalent widths of H emission and the excitation index .
Arp 277 Arp 277 (VV 313)—a galaxy pair composed of two Im galaxies at 12 Mpc: NGC 4809 and NGC 4810. NGC 4809 is the brighter of the two strongly-interacting galaxies. Casasola et al. (2004) report that NGC 4809 has an optical diameter of 5.0 kpc, blue luminosity of L☉, dust mass of M☉, H I mass of M☉, and a FIR luminosity of L☉. The H I mass and FIR luminosity, however, may include emission from both NGC 4809 and NGC 4810. From optical spectroscopy of its ionized gas, NGC 4809 has an average K, an average electron density of 98 cm-3, and an oxygen abundance of dex (1/3 Z☉) (Kniazev et al., 2004). NGC 4810 has a blue magnitude of mag (Albrecht et al., 2004). Using the H flux, James et al. (2004) measured the SFR of NGC 4809 as 0.25 M☉ yr-1 and NGC 4810 as 0.13 M☉ yr-1.
Arp 291 Arp 291 (UGC 5832, VV 112)—is a peculiar, ring galaxy at 15 Mpc. It has an optical diameter of 5.5 kpc, blue luminosity of L☉, dust mass of M☉, H I mass of M☉, and a FIR luminosity of L☉ (Casasola et al., 2004). Arp 291 has an NVSS 1.4 GHz flux of 4.1 mJy and W Hz-1 (Condon et al., 2002). At this luminosity the radio emission is most likely related to star formation and not an AGN, which implies a star formation rate of 0.2 M☉ yr-1 (Condon, 1992). Arp 291 is part of a group of galaxies behind the M 96 group and has M M☉ and a dynamical mass of M☉ (Schneider, 1989).
Mrk 1063 Mrk 1063 (NGC 1140, VV 482)—Seyfert type 2, dwarf, peculiar IBm galaxy at 20 Mpc. Using HST’s Planetary Camera, Hunter et al. (1994) find 6–7 SSCs in the central 0.5 kpc of Mrk 1063. de Grijs et al. (2004) find, based on the [Fe II] 1.6 µm emission line observed with Gemini South, that both the star formation regions of Mrk 1063 have a supernova rate of SN yr-1. They find that the young massive cluster (YMC) ages are all Myr.
Mrk 1080 Mrk 1080 (NGC 1507, UGC 2947)—edge-on SB(s)m galaxy at 11 Mpc. While Mrk 1080 is optically isolated with no bright companions, it does have an H I-rich companion with M☉ and a dynamical mass of M☉ (Wilcots et al., 1996). The H I distribution of Mrk 1080 also appears to be warped in the outer parts, possibly indicative of a recent interaction. It is an isolated galaxy with a blue luminosity of L☉ and L☉ (Lisenfeld et al., 2007), and is relatively gas-rich with M☉ L. Estimates of the star formation rate range from M☉ yr-1 (Meurer et al., 2006) from H observations and M☉ yr-1 calculated from the FIR using (Kennicutt, 1998) to M☉ yr-1 from 1.4 GHz radio continuum (Condon et al., 2002). Miller & Veilleux (2003) have detected extra-planar diffuse H emission in this galaxy, indicating that the star formation in Mrk 1080 strongly influences its morphology.
Mrk 1346 Mrk 1346 (NGC 5107, UGC 8396)—type SB(s)d galaxy at 14 Mpc. van Moorsel (1983) detect with the Westerbork Synthesis Radio Telescope a mass of H I northwest of the optical bulge of Mrk 1346. Leroy et al. (2005) place an upper limit on the CO in this galaxy of K km s-1. James et al. (2004) report a SFR of M⊙ yr-1.
Mrk 1479 Mrk 1479 (NGC 5238, VV 828, SBS 1331+518, IZW64)—type SAB(s)dm galaxy at 5 Mpc. This galaxy is a BCD and part of both the Markarian and VV catalogs, indicating that it is both UV-bright, and also shows signs of interaction; Vorontsov-Velyaminov (1977) classify it as a interacting double system. Arkhipova et al. (1987) note intense H emission along the length of the galaxy, and estimate its diameter as kpc. Huchtmeier & Richter (1988) estimate its total mass as M☉.
Mrk 86 Mrk 86 (NGC 2537, UGC 4274, Arp 6, VV 138)—peculiar SB(s)m galaxy at 6 Mpc. Gil de Paz et al. (2000) have found three distinct stellar populations in Mrk 86, one of which is a 30 Myr old central starburst with a mass of M☉. They also note that there must be a global triggering mechanism responsible for forming the at least 46 young star formation regions. Gil de Paz et al. (2002) observed the 12CO and lines of Mrk 86 and found a horseshoe-shaped distribution of gas surrounding the galaxy’s nuclear starburst.
Mrk 370 Mrk 370 (NGC 1036, UGC 2160, IC 1828)—a BCD, peculiar galaxy at 12 Mpc. Cairós et al. (2002) can reproduce their observed photometry of Mrk 370 if they assume an instantaneous starburst with a Salpeter initial mass function (IMF) with a mass limit of 100 M☉. They find that this starburst is Myr old.
Mrk 829 Mrk 829 (UGC 09560, IIZW70, VV 324b)—peculiar, BCD galaxy at 18 Mpc that is interacting with IIZW71. Rosa-González et al. (2007) estimate the SFR of Mrk 829 based on H and 1.4 GHz to be 0.2 and 0.1 M☉ yr-1, respectively. Kehrig et al. (2008) detect HeII 4686 emission, indicating hard ionizing radiation related to young massive stars. Kehrig et al. also determine an oxygen abundance for this system of .
NGC 1156 NGC 1156 (UGC 2455, VV 531)—galaxy of type IB(s)m at 6 Mpc. Karachentsev et al. (1996), after finding a distance to this Magellanic-type galaxy, note that it is “one of the least disturbed galaxies in the Nearby Universe” and that it is isolated from other galaxies. Despite its seeming quiescence, NGC 1156 shows signatures of recent star formation activity: W-R emission features and HII emission (Ho et al., 1995). Vacca & Conti (1992) argue that the number ratios of W-R- to O-type stars in galaxies showing W-R features indicate that the galaxy’s star formation must be occurring in short bursts of timescales yr.
NGC 3003 NGC 3003 (UGC 5251)—type SBbc, W-R galaxy. Although there is a W-R bump detected in NGC 3003 (Ho et al., 1995), there is also a notable lack of broad H component compared to other galaxies (Schaerer et al., 1999). Rossa & Dettmar (2003) note that the ratio of 60m to 100m fluxes suggests enhanced dust temperatures due to star formation activity. Rossa & Dettmar also find strong planar H emission along with several bright H emission knots.
A.2 Galaxies Observed with the ATCA
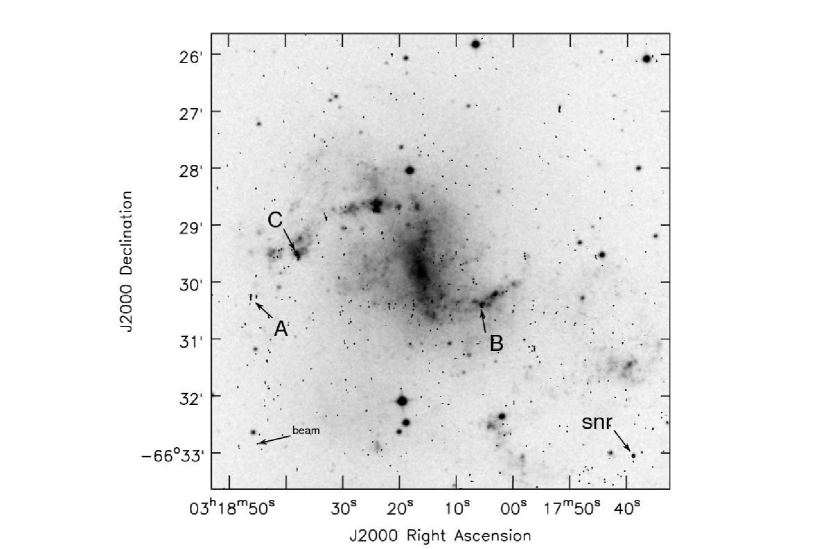
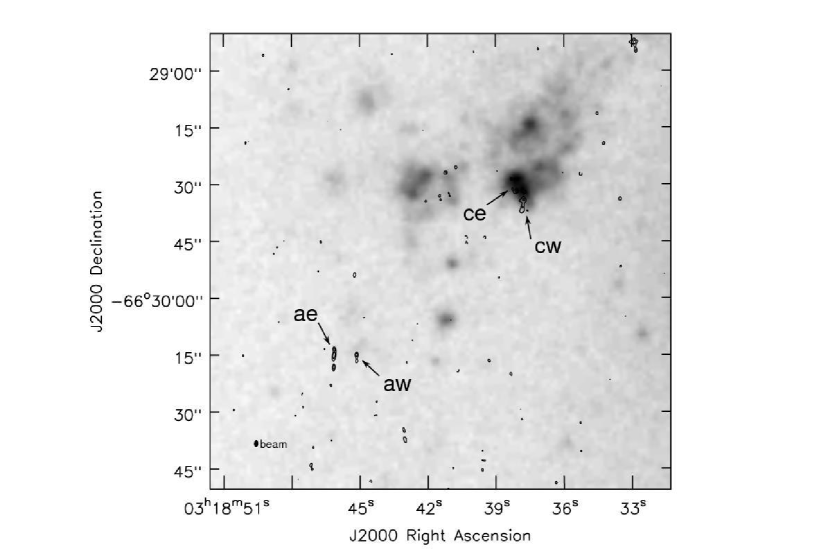
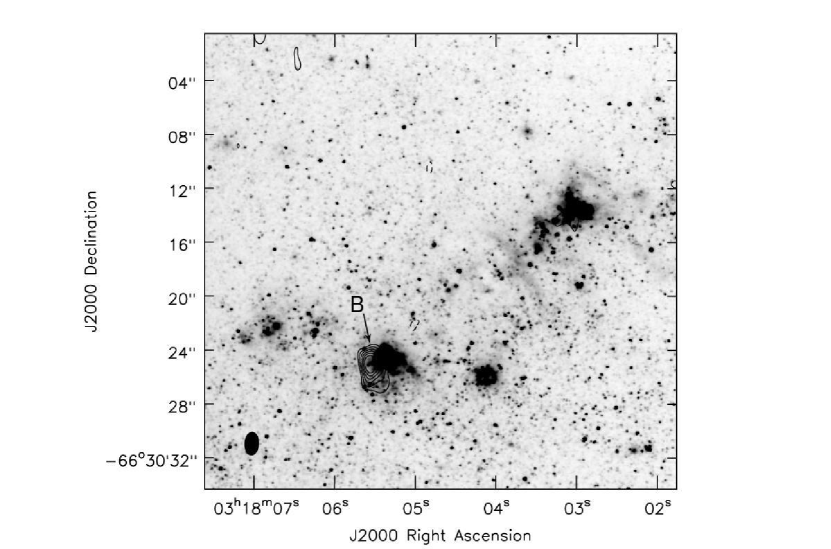
NGC 1313 NGC 1313 (VV 436)—With the largest angular extent of any of the southern hemisphere galaxies in this sample, it spans . It is a face-on SB(s)d galaxy at 4.2 Mpc. NGC 1313 contains the radio-bright remnant of the Type II supernova SNR 1978K (Ryder et al., 1993). Larsen (2004) identifies many young stellar clusters with ground-based and HST WFPC2 data in NGC 1313. Based on an extensive H I (1.4 GHz) map by Peters et al. (1994), the kinematics of NGC 1313 suggest that it interacted with a dwarf galaxy that has pulled a loop of hydrogen gas out of its plane. Far infrared (FIR) magnitudes imply NGC 1313 has an area-normalized star formation rate (SFR) M☉ yr-1 kpc-2 (Larsen & Richtler, 2000), or an estimated M☉ yr-1 throughout the whole galaxy. Wolf-Rayet (W-R) features are found at large galactocentric radii in NGC 1313 (Schaerer et al., 1999).
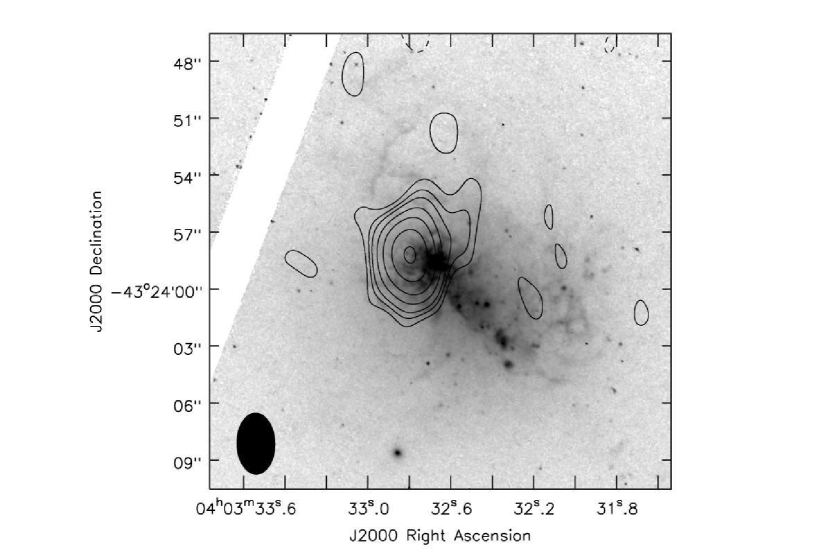
NGC 1510 NGC 1510— type E0 galaxy with two central “condensations,” one of which contains W-R stars (Schaerer et al., 1999; Conti, 1991). Eichendorf & Nieto (1984) suggest that an interaction with the nearby NGC 1512 has triggered a starburst in NGC 1510. Storchi-Bergmann et al. (1994) estimate the current SFR of NGC 1510 to be 0.3 M☉ yr-1.
NGC 1522 NGC 1522— S0 peculiar galaxy at 10.6 Mpc. It has a mag and a ergs s-1 (Gil de Paz et al., 2003). The source has been detected by FUSE in the UV (Fox et al., 2006). Both the H flux and the UV brightness point towards prolific star formation occurring in NGC 1522. Loose & Thuan (1986) classify the galaxy as an iE BCD, meaning that it has elliptical outer isophotes and irregular inner isophotes due to star formation. Malin & Carter (1983) note that the outer envelope is displaced, so this galaxy shows signatures of its interaction with NGC 1510. It is located in the NGC 1566 group of galaxies and has an H I mass of M☉ with a of 0.5 in solar units (Kilborn et al., 2005).
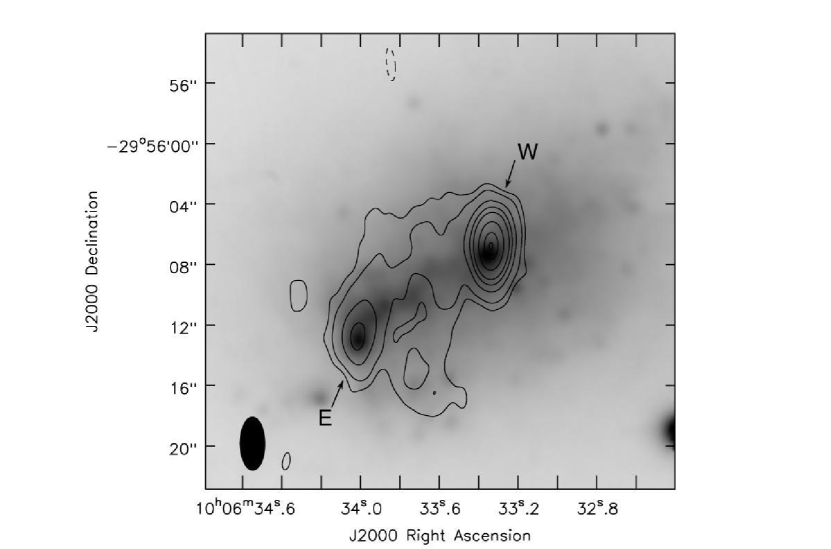
NGC 3125 NGC 3125 (Tol 3)—an irregular BCD galaxy with an angular size of . At a distance of 11.5 Mpc, it is comprised of two bright lobes (Schaerer et al., 1999). Hadfield & Crowther (2006) surveyed the W-R stars of this galaxy and found that there are fewer than suggested by previous UV studies. Alton et al. (1994) find, with an optical polarization map, that part of NGC 3125 is a reflection nebula illuminated by a central starburst region.
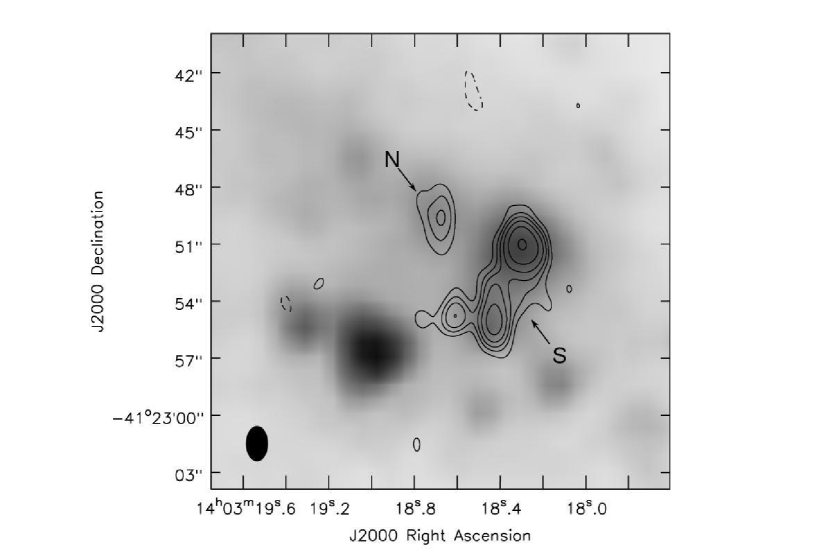
NGC 5408 NGC 5408 (Tol 116)— IB(s)m dwarf starburst galaxy at 4.8 Mpc. Using ATCA and Chandra observations, Soria et al. (2006) detect an ultra-luminous X-ray source in NGC 5408 that may have formed in recent starburst activity. NGC 5408, however, is not known to contain W-R features (Schaerer et al., 1999).
NGC 2101 NGC 2101—a type IB(s)m pec galaxy at 13.3 Mpc444From the NASA Extragalactic Database (NED) http://nedwww.ipac.caltech.edu/. Hunter & Elmegreen (2004) infer a total star formation rate of M⊙ yr-1 or M⊙ yr-1kpc-2, among the highest SFRs for any of the Im-type galaxies in their sample, and typical of the SFRs for blue compact dwarfs in their sample.
TOL 0957-278 TOL 0957-278 (TOL 2)—distance of 7.1 Mpc, mag, and ergs s-1 (Gil de Paz et al., 2003). Rosa-González et al. (2007) cites a slightly higher value for and derived a star formation rate of 0.3 M☉ yr-1. Loose & Thuan (1986) classify it as an iE BCD. It is a possibly merging HII galaxy with strong emission lines (Smith et al., 1976) and a possible signature of W-R stars (Kunth & Joubert, 1985; Conti, 1991; Vacca & Conti, 1992; Méndez & Esteban, 2000). The entire galaxy contains about M☉ of ionizing stars—about 540 O5V equivalent stars. The largest optical knot has a linear size of 225 pc (Méndez & Esteban, 2000). Ages of the knots, derived from optical emission lines and broadband colors, are 5-10 Myr (Méndez & Esteban, 2000). The galaxy has an H I mass of M☉ (Barnes & de Blok, 2001).
References
- Albrecht et al. (2004) Albrecht, M., Chini, R., Krügel, E., Müller, S. A. H., & Lemke, R. 2004, A&A, 414, 141
- Alton et al. (1994) Alton, P. B., Draper, P. W., Gledhill, T. M., Stockdale, D. P., Scarrott, S. M., & Wolstencroft, R. D. 1994, MNRAS, 270, 238
- Arkhipova et al. (1987) Arkhipova V.P., Noskova R.I., Sil’chenko O.K., Zasov A.V. 1987, PisAZ, 13, 575
- Baars et al. (1977) Baars, J. W. M., Genzel, R., Pauliny-Toth, I. I. K., & Witzel, A. 1977, A&A, 61, 99
- Barnes & de Blok (2001) Barnes, D. G., & de Blok, W. J. G. 2001, AJ, 122, 825
- Barth et al. (1994) Barth, C. S., Cepa, J., Vilchez, J. M., & Dottori, H. A. 1994, AJ, 108, 2069
- Beck et al. (2000) Beck, S. C., Turner, J. L., & Kovo, O. 2000, AJ, 120, 244
- Beck, Turner, & Gorjian (2001) Beck, S.C., Turner, J.L., & Gorjian, V. 2001, AJ, 122, 1365
- Cairós et al. (2002) Cairós, L. M., Caon, N., García-Lorenzo, B., Vílchez, J. M., & Muñoz-Tuñón, C. 2002, ApJ, 577, 164
- Casasola et al. (2004) Casasola, V., Bettoni, D., & Galletta, G. 2004, A&A, 422, 941
- Clemens et al. (1998) Clemens, M. S., Alexander, P., & Green, D. A. 1998, MNRAS, 297, 1015
- Condon et al. (2002) Condon, J. J., Cotton, W. D., & Broderick, J. J. 2002, AJ, 124, 675
- Condon (1992) Condon, J. J. 1992, ARA&A, 30, 575
- Conti (1991) Conti, P. S. 1991, ApJ, 377, 115
- Damjanov et al. (2006) Damjanov, I., Fadda, D., Marleau, F., Appleton, P., Choi, P., Lacy, M., Storrie-Lombardi, L., & Yan, L. 2006, ArXiv Astrophysics e-prints, arXiv:astro-ph/0604276
- De Pree et al. (2000) De Pree, C. G., Wilner, D. J., Goss, W. M., Welch, W. J., & McGrath, E. 2000, ApJ, 540, 308
- Eichendorf & Nieto (1984) Eichendorf, W., & Nieto, J.-L. 1984, A&A, 132, 342
- Elmegreen & Efremov (1997) Elmegreen, B. G., & Efremov, Y. N. 1997, ApJ, 480, 235
- Elmegreen et al. (1998) Elmegreen, D. M., Chromey, F. R., Knowles, B. D., & Wittenmyer, R. A. 1998, AJ, 115, 1433
- Elmegreen et al. (2002) Elmegreen, D. M., Chromey, F. R., McGrath, E. J., & Ostenson, J. M. 2002, AJ, 123, 1381
- Fesen et al. (2006) Fesen, R.A. et al. 2006, ApJ, 645, 283
- Fox et al. (2006) Fox, A. J., Savage, B. D., & Wakker, B. P. 2006, ApJS, 165, 229
- García-Lorenzo et al. (1999) García-Lorenzo, B., Mediavilla, E., & Arribas, S. 1999, Wolf-Rayet Phenomena in Massive Stars and Starburst Galaxies, 193, 598
- Gil de Paz et al. (2000) Gil de Paz, A., Zamorano, J., & Gallego, J. 2000, A&A, 361, 465
- Gil de Paz et al. (2002) Gil de Paz, A., Silich, S. A., Madore, B. F., Sánchez Contreras, C., Zamorano, J., & Gallego, J. 2002, ApJ, 573, L101
- Gil de Paz et al. (2003) Gil de Paz, A., Madore, B. F., & Pevunova, O. 2003, ApJS, 147, 29
- Gorjian, Turner, & Beck (2001) Gorjian, V., Turner, J.L., & Beck, S.C. 2001, ApJ, 554, 29
- Green (1984) Green, D. A. 1984, MNRAS, 209, 449
- de Grijs et al. (2004) de Grijs, R., et al. 2004, MNRAS, 352, 263
- Hadfield & Crowther (2006) Hadfield, L. J., & Crowther, P. A. 2006, MNRAS, 368, 1822
- Ho et al. (1995) Ho, L. C., Filippenko, A. V., & Sargent, W. L. 1995, ApJS, 98, 477
- Huchtmeier & Richter (1988) Huchtmeier, W.K. & Richter, O.-G. A&A, 203, 237
- Hunter et al. (1994) Hunter, D. A., O’Connell, R. W., & Gallagher, J. S., III 1994, AJ, 108, 84
- Hunter & Elmegreen (2004) Hunter, D. A. & Elmegreen, B. G., 2004, AJ, 128, 2170
- James et al. (2004) James, P. A., et al. 2004, A&A, 414, 23
- Johnson & Kobulnicky (2003) Johnson, K. E. & Kobulnicky, H. A. 2003, ApJ, 597, 923
- Johnson et al. (2003) Johnson, K. E., Indebetouw, R., & Pisano, D. J. 2003, AJ, 126, 101
- Johnson et al. (2004) Johnson, K. E., Indebetouw, R., Watson, C., & Kobulnicky, H. A. 2004, AJ, 128, 610
- Johnson et al. (2009) Johnson, K. E., Hunt, L. K., & Reines, A. E. 2009, AJ, 137, 3788
- Johnson (2004) Johnson, K. E. 2004, The Formation and Evolution of Massive Young Star Clusters, 322, 339
- Karachentsev et al. (1996) Karachentsev, I., Musella, I., & Grimaldi, A. 1996, A&A, 310, 722
- Kennicutt et al. (2003) Kennicutt, R. C., Jr., et al. 2003, PASP, 115, 928
- Kennicutt (1998) Kennicutt, R. C., Jr. 1998, ARA&A, 36, 189
- Kehrig et al. (2008) Kehrig, C., Vilchez, J. M., Sanchez, S. F., Telles, E., Perez-Montero, E., Martin-Gordon, D. 2008, A&A, 477, 813
- Kilborn et al. (2005) Kilborn, V. A., Koribalski, B. S., Forbes, D. A., Barnes, D. G., & Musgrave, R. C. 2005, MNRAS, 356, 77
- Kniazev et al. (2004) Kniazev, A. Y., Pustilnik, S. A., Grebel, E. K., Lee, H., & Pramskij, A. G. 2004, ApJS, 153, 429
- Kobulnicky & Johnson (1999) Kobulnicky, H. A., & Johnson, K. E. 1999, ApJ, 527, 154
- Krienke & Hodge (1990) Krienke, K., & Hodge, P. 1990, PASP, 102, 41
- Kunth & Joubert (1985) Kunth, D., & Joubert, M. 1985, A&A, 142, 411
- Lada & Lada (2003) Lada, C. J. & Lada, E. A., 2003 ARA&A, 41, 57]
- Larsen & Richtler (2000) Larsen, S. S., & Richtler, T. 2000, A&A, 354, 836
- Larsen (2004) Larsen, S. S. 2004, A&A, 416, 537
- Leitherer et al. (1999) Leitherer, C., et al. 1999, ApJS, 123, 3
- Leroy et al. (2005) Leroy, A., Bolatto, A. D., Simon, J. D., & Blitz, L. 2005, ApJ, 625, 763
- Lisenfeld et al. (2007) Lisenfeld, U., et al. 2007, A&A, 462, 507
- Loose & Thuan (1986) Loose, H.-H., & Thuan, T. X. 1986, in Star Forming Dwarf Galaxies and Related Objects, ed. D. Kunth, T. X. Thuan, & J. T. T. Van (Gif-sur-Yvette: Editions Frontiéres), 73
- Malin & Carter (1983) Malin, D. F., & Carter, D. 1983, ApJ, 274, 534
- Marakova & Karachentsev (1998) Makarova, L. N. & Karachentsev, I. D. 1998, A&AS
- Meurer et al. (2006) Meurer, G. R., et al. 2006, ApJS, 165, 307
- Mezger & Henderson (1967) Mezger, P. G., & Henderson, A. P. 1967, ApJ, 147, 471
- Méndez & Esteban (2000) Méndez, D. I., & Esteban, C. 2000, A&A, 359, 493
- Miller & Veilleux (2003) Miller, S. T., & Veilleux, S. 2003, ApJS, 148, 383
- Peters et al. (1994) Peters, W. L., Freeman, K. C., Forster, J. R., Manchester, R. N., & Ables, J. G. 1994, MNRAS, 269, 1025
- Reines et al. (2008) Reines, A. E., Johnson, K. E., & Goss, W. M. 2008, AJ, 135, 2222
- Rosa-González et al. (2007) Rosa-González, D., Schmitt, H. R., Terlevich, E., & Terlevich, R. 2007, ApJ, 654, 226
- Rossa & Dettmar (2003) Rossa, J. & Dettmar, R. J. 2003, A&A, 406, 505
- Ryder et al. (1993) Ryder, S., Staveley-Smith, L., Dopita, M., Petre, R., Colbert, E., Malin, D., & Schlegel, E. 1993, ApJ, 416, 167
- Schaerer et al. (1999) Schaerer, D., Contini, T., & Pindao, M. 1999, A&AS, 136, 35
- Schneider (1989) Schneider, S. E. 1989, ApJ, 343, 94
- Sharp (1996) Sharp, N. A. 1996, Bulletin of the American Astronomical Society, 28, 1359
- Smith et al. (1976) Smith, M. G., Aguirre, C., & Zemelman, M. 1976, ApJS, 32, 217
- Soria et al. (2006) Soria, R., Fender, R. P., Hannikainen, D. C., Read, A. M., & Stevens, I. R. 2006, MNRAS, 368, 1527
- Steel et al. (1996) Steel, S. J., Smith, N., Metcalfe, L., Rabbette, M., & McBreen, B. 1996, A&A, 311, 721
- Storchi-Bergmann et al. (1994) Storchi-Bergmann, T., Calzetti, D., & Kinney, A. L. 1994, ApJ, 429, 572
- Summers et al. (2001) Summers, L. K., Stevens, I. R., & Strickland, D. K. 2001, MNRAS, 327, 385
- Tarchi et al. (2000) Tarchi, A., Neininger, N., Greve, A., Klein, U., Garrington, S. T., Muxlow, T. W. B., Pedlar, A., & Glendenning, B. E. 2000, A&A, 358, 95
- Tully (1988) Tully, R. B. 1988, “Nearby Galaxies Catalog”, Cambridge and New York, Cambridge University Press
- Turner, Ho, & Beck (1998) Turner, J. L., Ho, P.T.P, & Beck, S. C. 1998, AJ, 116, 1212
- Vacca & Conti (1992) Vacca, W. D., & Conti, P. S. 1992, ApJ, 401, 543
- Vacca (1994) Vacca, W. D. 1994, ApJ, 421, 140
- Vacca, Johnson, & Conti (2002) Vacca, W.D., Johnson, K.E. & Conti, P.S. 2002, AJ, 123, 772
- Vorontsov-Velyaminov (1977) Vorontsov-Velyaminov, B. A. 1977, A&AS, 28, 1
- Weiler et al. (1986) Weiler, K. W., Sramek, R. A., Panagia, N., van der Hulst, J. M., Salvati, M. 1986, ApJ, 301, 790
- Whitmore (2002) Whitmore, B.C. 2002, in: A Decade of Hubble Space Telescope Science, M. Livio, K. Noll, M. Stiavelli, Eds. (Cambridge Univ. Press, Cambridge, 2002), pp. 153-180.
- Wilcots et al. (1996) Wilcots, E. M., Lehman, C., & Miller, B. 1996, AJ, 111, 1575
- de Wit et al. (2005) de Wit, W. J., Testi, L., Palla, F., Zinnecker, H. 2005, A&A, 437, 247
- van Moorsel (1983) van Moorsel, G. A. 1983, A&AS, 53, 271
- Wood & Churchwell (1989) Wood, D. O. S., & Churchwell, E. 1989, ApJS, 69, 831
- Zezas et al. (1998) Zezas, A. L., Georgantopoulos, I., & Ward, M. J. 1998, MNRAS, 301, 915
- Zezas et al. (2004) Zezas, A., Georgantopoulos, I., Ward, M., Fabbiano, G., & Prestwich, A. 2004, Bulletin of the American Astronomical Society, 36, 964
| Galaxy | Alternate Name | Classification(s)aaFrom the NASA Extragalactic Database (NED) http://nedwww.ipac.caltech.edu/ | Distance |
|---|---|---|---|
| (Mpc) | |||
| VLA Targets | |||
| Arp 217 | NGC 3310 | SAB(r)bc pec HII | 14.4 |
| Arp 233 | Haro 2 | Im pec HII | 20.4 |
| Arp 263 | NGC 3239 | IB(s)m pec | 9.1 |
| Arp 266 | NGC 4861 | SB(s)m: Sbrst | 11.9 |
| Arp 277 | VV313 | Mult pec | 11.8 |
| Arp 291 | UGC 05832 | Mult pec | 15.4 |
| Arp 32 | UGC 10770 | SBm pec | 17.8 |
| Mrk 1063 | NGC 1140 | IBm pec:;HII Sy2 | 20.2 |
| Mrk 1080 | NGC 1507 | SB(s)m pec? | 11.1 |
| Mrk 1346 | NGC 5107 | SB(s)d? sp | 13.8 |
| Mrk 1479 | NGC 5238 | SAB(s)dm | 4.9 |
| Mrk 35 | NGC 3353 | BCD/Irr HII | 13.8 |
| Mrk 370 | NGC 1036 | Pec? | 11.7 |
| Mrk 829 | UGC 09560 | pec; BCDG HII | 17.5 |
| Mrk 86 | NGC 2537 | SB(s)m pec | 6.14 |
| NGC 1156 | UGC 02455 | IB(s)m | 6.11 |
| NGC 3003 | UGC 05251 | SBbc | 19.8 |
| NGC 4490 | ARP 269 | SB(s)d pec | 8.36 |
| ATCA Targets | |||
| NGC 1313 | ESO 082- G 011 | SB(s)d HII | 4.19 |
| NGC 1510 | ESO 250- G 003 | SA0 0 pec?;HIIBCDG | 10.4 |
| NGC 1522 | ESO 156- G 038 | (R’)S0 0 : pec | 10.0 |
| NGC 2101 | ESO 205- G 001 | IB(s)m pec | 13.7 |
| NGC 3125 | ESO 435- G 041 | S BCDG | 12.3 |
| NGC 5408 | ESO 325- G?047 | IB(s)m HII | 5.01 |
| TOL 0957-278 | ESO 435-IG 020 | Merger? HII | 10.4 |
| Galaxy | Band | Convolved Beam SizeaaApplied via convolution in the imaging process | Position Angle | Noise |
|---|---|---|---|---|
| (cm) | (arcsec) | (deg) | (Jy bm-1) | |
| VLA Targets | ||||
| Arp 217 | 3.6 | -81.7 | 26 | |
| 1.3 | -81.7 | 39 | ||
| Arp 233 | 3.6 | -78.2 | 24 | |
| 1.3 | -78.2 | 37 | ||
| Arp 263bbNo radio sources detected in 3.6 cm observations, and thus 1.3 cm observations were not pursued. | 3.6 | -57.8 | 24 | |
| Arp 266bbNo radio sources detected in 3.6 cm observations, and thus 1.3 cm observations were not pursued. | 3.6 | 79.9 | 27 | |
| Arp 277bbNo radio sources detected in 3.6 cm observations, and thus 1.3 cm observations were not pursued. | 3.6 | 40.2 | 26 | |
| Arp 291bbNo radio sources detected in 3.6 cm observations, and thus 1.3 cm observations were not pursued. | 3.6 | -50.4 | 26 | |
| Arp 32bbNo radio sources detected in 3.6 cm observations, and thus 1.3 cm observations were not pursued. | 3.6 | -44.8 | 24 | |
| GO 20127bbNo radio sources detected in 3.6 cm observations, and thus 1.3 cm observations were not pursued. | 3.6 | -7.0 | 36 | |
| Mrk 1063bbNo radio sources detected in 3.6 cm observations, and thus 1.3 cm observations were not pursued. | 3.6 | -22.1 | 22 | |
| Mrk 1080bbNo radio sources detected in 3.6 cm observations, and thus 1.3 cm observations were not pursued. | 3.6 | -31.1 | 24 | |
| Mrk 1346bbNo radio sources detected in 3.6 cm observations, and thus 1.3 cm observations were not pursued. | 3.6 | 86.3 | 25 | |
| Mrk 1479bbNo radio sources detected in 3.6 cm observations, and thus 1.3 cm observations were not pursued. | 3.6 | -85.0 | 24 | |
| Mrk 35 | 3.6 | -85.2 | 25 | |
| 1.3 | -85.2 | 49 | ||
| Mrk 370bbNo radio sources detected in 3.6 cm observations, and thus 1.3 cm observations were not pursued. | 3.6 | -33.2 | 22 | |
| Mrk 829bbNo radio sources detected in 3.6 cm observations, and thus 1.3 cm observations were not pursued. | 3.6 | -83.7 | 24 | |
| Mrk 86bbNo radio sources detected in 3.6 cm observations, and thus 1.3 cm observations were not pursued. | 3.6 | -82.4 | 27 | |
| NGC 1156ccOnly one band available | 3.6 | -49.4 | 26 | |
| NGC 3003bbNo radio sources detected in 3.6 cm observations, and thus 1.3 cm observations were not pursued. | 3.6 | -63.7 | 30 | |
| NGC 4490 | 3.6 | 12.6 | 55 | |
| 1.3 | 12.6 | 20 | ||
| ATCA Targets | ||||
| NGC 1313 | 3 | -5.8 | 48 | |
| 6 | -5.8 | 53 | ||
| NGC 1510 | 3 | 1.0 | 41 | |
| 6 | 1.0 | 48 | ||
| NGC 1522 | 3 | -3.5 | 44 | |
| 6 | -3.5 | 45 | ||
| NGC 2101 | 3 | -5.7 | 36 | |
| 6 | -5.7 | 42 | ||
| NGC 3125 | 3 | 0.4 | 57 | |
| 6 | 0.4 | 61 | ||
| NGC 5408 | 3 | 0.1 | 60 | |
| 6 | 0.1 | 48 | ||
| TOL 0957-278 | 3 | -6.3 | 68 | |
| 6 | -6.3 | 78 |
| Source | Deconvolved SizebbSizes determined by best-fit Gaussian profile using the AIPS++ task IMAGEFITTER | Physical Size | Peak | Peak | ccUncertainty in includes uncertainty due to flux calibration and background variation, but not uncertainty due to aperture size, which is identical at the two frequencies. | ||||
|---|---|---|---|---|---|---|---|---|---|
| (J2000) | (J2000) | (arcsec) | (pc) | (mJy) | (mJy bm-1) | (mJy) | (mJy bm-1) | ||
| Arp 233naaGaussian profile did not fit source. | 10 32 31.80 | +54 24 04.0 | |||||||
| Arp 233s | 10 32 31.97 | +54 24 02.4 | |||||||
| Arp 217eaaGaussian profile did not fit source. | 10 38 44.83 | +53 30 05.0 | |||||||
| Arp 217d | 10 38 45.87 | +53 30 12.1 | — | ||||||
| Arp 217c | 10 38 46.53 | +53 30 06.4 | |||||||
| Arp 217b | 10 38 46.69 | +53 30 11.8 | |||||||
| Arp 217a | 10 38 46.93 | +53 30 16.8 | |||||||
| Mrk 35waaGaussian profile did not fit source. | 10 45 21.96 | +55 57 39.8 | |||||||
| Mrk 35eaaGaussian profile did not fit source. | 10 45 22.02 | +55 57 40.1 | |||||||
| NGC 4490e | 12 30 29.50 | +41 39 28.4 | |||||||
| NGC 4490bw | 12 30 34.44 | +41 38 25.4 | |||||||
| NGC 4490beaaGaussian profile did not fit source. | 12 30 34.50 | +41 38 26.2 | |||||||
| NGC 4490c | 12 30 34.53 | +41 38 33.3 | |||||||
| NGC 4490d | 12 30 34.91 | +41 39 02.5 | |||||||
| NGC 4490a | 12 30 37.73 | +41 37 58.8 |
Note. —
Note. — See Table 2 for upper limits on non-detections’ flux densities.
| Source | Deconvolved SizeddSizes determined by best-fit Gaussian profile using the AIPS++ task IMAGEFITTER | Physical Size | Peak | Peak | eeUncertainty in includes uncertainty due to flux calibration and background variation, but not uncertainty due to aperture size, which is identical at the two frequencies. | ||||
|---|---|---|---|---|---|---|---|---|---|
| (J2000) | (J2000) | (arcsec) | (pc) | (mJy) | (mJy bm-1) | (mJy) | (mJy bm-1) | ||
| NGC 1313snrbbKnown supernova remnant 1978K. | 03 17 38.66 | -66 33 03.6 | |||||||
| NGC 1313baaLarsen (2004) identifies this source as the star cluster n1313-341. | 03 18 05.52 | -66 30 25.2 | |||||||
| NGC 1313cwccGaussian profile did not fit source. | 03 18 37.73 | -66 29 33.7 | |||||||
| NGC 1313ceccGaussian profile did not fit source. | 03 18 38.05 | -66 29 31.8 | |||||||
| NGC 1313aw | 03 18 45.15 | -66 30 15.0 | |||||||
| NGC 1313ae | 03 18 46.04 | -66 30 15.2 | |||||||
| NGC 1510 | 04 03 32.80 | -43 23 58.1 | |||||||
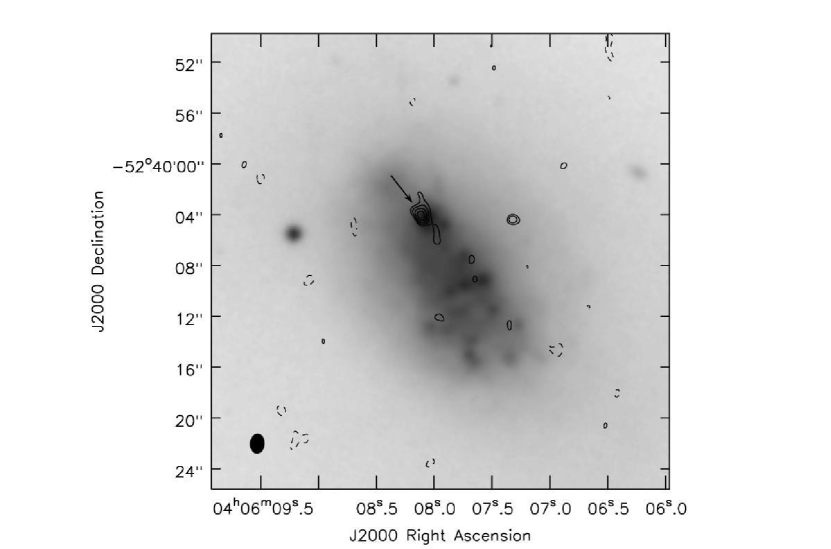
| NGC 1522 | 04 06 08.13 | -52 40 03.4 | |||||||
| NGC 3125w | 10 06 33.34 | -29 56 06.8 | |||||||
| NGC 3125e | 10 06 33.98 | -29 56 11.9 | |||||||
| NGC 5408s | 14 03 18.35 | -41 22 52.6 | |||||||
| NGC 5408n | 14 03 18.67 | -41 22 50.0 |
Note. —
Note. — See Table 2 for upper limits on non-detections’ flux densities.
| Source | SizebbThis lower limit is based upon the distances in Table 6 and deconvolved angular sizes in Tables 3 and 4. | Lower Limit | Stellar Mass | O7.5 V StarsccAssuming O7.5 V stars have a s-1 (Vacca, 1994) |
|---|---|---|---|---|
| (pc) | ( s-1) | () | (min. number) | |
| VLA Targets | ||||
| Arp 217a | 8 | |||
| Arp 217b | 7 | |||
| Arp 217e | 19 | |||
| Arp 233n | 30 | |||
| Arp 233s | 46 | |||
| Mrk 35e | 16 | |||
| Mrk 35w | 18 | |||
| NGC 4490a | 5 | |||
| ATCA Targets | ||||
| NGC 5408n | 0.4 |
Note. — Thermal sources tabulated here have spectral indices .
| Source | DistanceaaDistances are galactocentric. | Cas A Limit | “Non-thermal” | W49A Limit | “Thermal” | Ambiguous |
|---|---|---|---|---|---|---|
| (Mpc) | () | Sources | () | Sources | Sources | |
| VLA Targets | ||||||
| Arp 217 | 14.4 | 0.9 | 1 | 0.5 | 3 | 1 |
| Arp 233 | 20.4 | 0.5 | 0.3 | 2 | ||
| Arp 263 | 9.1 | 2.4 | 1.4 | |||
| Arp 266 | 11.9 | 1.3 | 0.7 | |||
| Arp 277 | 11.8 | 1.3 | 0.8 | |||
| Arp 291 | 15.4 | 0.8 | 0.5 | |||
| Arp 32 | 17.8 | 0.6 | 0.4 | |||
| Mrk 1063 | 20.2 | 0.5 | 0.3 | 6–7bbAlthough we did not detect thermal emission from Mrk 1063, we report the number of thermal sources Hunter et al. (1994) found. | ||
| Mrk 1080 | 11.1 | 1.6 | 1.0 | |||
| Mrk 1346 | 13.8 | 1.0 | 0.6 | |||
| Mrk 1479 | 4.6 | 9.5 | 5.6 | |||
| Mrk 35 | 13.8 | 1.0 | 0.6 | 2 | ||
| Mrk 370 | 11.7 | 1.6 | 0.9 | |||
| Mrk 829 | 17.5 | 0.7 | 0.4 | |||
| Mrk 86 | 6.1 | 4.7 | 2.8 | |||
| NGC 1156 | 6.1 | 4.9 | 2.9 | |||
| NGC 3003 | 19.8 | 0.4 | 0.2 | |||
| NGC 4490 | 8.4 | 1.2 | 2 | 0.7 | 2 | 2 |
| ATCA Targets | ||||||
| NGC 1313 | 4.2 | 5.8 | 2 | 3.4 | 4 | |
| NGC 1510 | 10.4 | 1.1 | 0.6 | 1 | ||
| NGC 1522 | 10.0 | 1.1 | 1 | 0.6 | ||
| NGC 2101 | 13.7 | 0.7 | 0.4 | |||
| NGC 3125 | 12.3 | 0.6 | 0.3 | 2 | ||
| NGC 5408 | 5.0 | 3.2 | 1.9 | 1 | 1 | |
| TOL 0957-278 | 10.4 | 0.7 | 0.4 |