Statistical properties of the GALEX spectroscopic stellar sample
Abstract
The GALEX General Data Release 4/5 includes 174 spectroscopic tiles, obtained from slitless grism observations, for a total of more than 60,000 ultraviolet spectra. We have determined statistical properties of the sample of GALEX stars. We have defined a suitable system of spectroscopic indices, which measure the main mid-UV features at the GALEX low spectral resolution and we have employed it to determine the atmospheric parameters of stars in the range K. Our preliminary results indicate that the majority of the sample is formed by main sequence F- and G-type stars, with metallicity dex.
Keywords ultraviolet: stars; stars: fundamental parameters; techniques: spectroscopic
Introduction
The ultraviolet (UV) radiation from space is absorbed by the Earth atmosphere, thus requiring observations from space-borne observatories. At present, the only fully UV-dedicated space mission is the Galaxy Evolution Explorer (GALEX), which has been observing the UV sky since 2003. Up to now, it has provided photometry of more than 200 million objects (see Bianchi, this volume), nevertheless its spectroscopic database is still almost completely unexploited. To our knowledge, just very few works have been published which made use of GALEX spectra (Bello-Ramírez & Rosa-González, 2009; Rosa-González et al., 2009; Barger & Cowie, 2010; Cowie et al., 2010; Feldman et al., 2010). In this work, we conduct a general analysis of the whole spectroscopic database aimed at identifying and characterizing the variety of observed stars, which could be later applied to studies of Galactic and extragalactic stellar populations. In particular, we define suitable spectral tools to determine statistical properties of the stellar sample, through their main atmospheric parameters.
1 The GALEX spectroscopic database.
GALEX is a NASA small explorer mission (Martin et al., 2005) whose main goal is to carry out a two-band UV photometric all-sky survey. Being equipped with a grism, it can also provide slitless spectroscopy of the entire field-of-view (1.2 deg) in the Far-UV (FUV; 1300–1820 Å) and Near-UV (NUV; 1820–3004 Å), at resolutions of and , respectively. The GALEX General Release 4/5111http://galex.stsci.edu/GR4/ contains 174 spectroscopic tiles for a total observing time of about 2.5 Msec. The database includes the spectra of more than 60000 objects. For extracting spectra, we have used the automatic pipeline222 http://www.galex.caltech.edu/DATA/gr1_docs/ GR1_Pipeline_and_advanced_data_description_v2.htm , which provides the wavelength calibrated and flux calibrated monodimensional spectra of the objects in each tile.
2 Flux calibration: GALEX vs. IUE
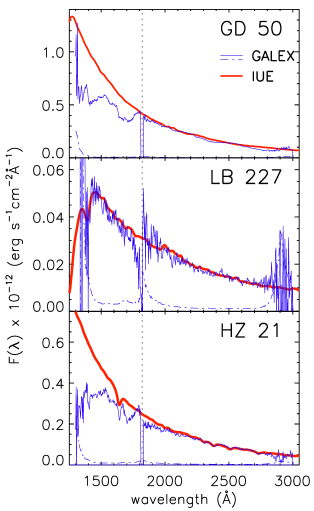
A reliable flux calibration is undoubtedly a crucial point whenever colors are considered or large wavelength intervals are used to extract stellar atmospheric parameters. The GALEX flux calibration (Morrissey et al., 2005, 2007) have been obtained from a series of observations of white dwarfs (WD) taken from the catalog of Bohlin et al. (2001). To verify the robustness of this calibration, we have compared the WDs in the GALEX spectroscopic database which are in common with the study of Holberg et al. (2003), who provide a series of high quality IUE spectra of Galactic white dwarfs. In Fig. 1, we plot the UV spectral energy distribution (SED) of three objects (GD 50, LB 227, and HZ 21) that show that the best agreement between IUE and GALEX data is achieved in the NUV interval, while the GALEX FUV range presents severe flux calibration problems, which consist in a overall underestimation of flux and the appearance of spurious features. We therefore limited our present study to NUV wavelengths between 2000 and 2830 Å, as, outside this interval, the GALEX NUV detector sensitivity decreases drastically. We would like to mention, however, that the “blue” (i.e., short-wavelength) edge of GALEX sensitivity in the NUV drops at shorter wavelengths than IUE, allowing a better spectral morphological analysis over the spectral window 2000–2300 Å.
3 The stellar sample.
Each spectroscopic tile has also been observed in imaging mode, so that it is possible to assign each spectrum to its corresponding source in the NUV image. We made use, for each of the 174 spectroscopic tiles, of the data present in the photometric catalog file (*-xd-mcat.fits) and the spectra provided by the GALEX automatic pipeline (*-xg-gsp.fits). Since the goal of this work is to assess the potential of GALEX data to determine the main properties of stars, we extracted point-like objects from the entire database by means of the following criteria:
-
•
ellipticity0.2 in the NUV image;
-
•
(SExtractor parameter) class_star0.8, in the NUV image, and
-
•
a median SNR/px5 in the NUV spectral interval. This criterion by itself decreases the number of spectra to about 11000.

The selected analysis sample is formed by a total of 6037 spectra.
3.1 Sample properties and non-stellar contamination.
The adopted selection criteria do not exclude the presence in the sample of other kind of sources, besides stars. Therefore, in order to have an indication on the amount of contamination, we proceeded to cross-correlate the position of all sources in our sample with the SIMBAD database333http://simbad.u-strasbg.fr/simbad/. We found a total of 2132 objects, which is about 35% of our total sample. They include 235 entries, which are classified as non-stellar (QSOs, galaxies, and so on), and 118 objects which are only identified as being sources emitting in UV, X, IR, submm, etc. We concluded that the expected fraction of contamination from non-stellar (or unclassified) objects of our sample should be around 16%, which imply a total number of stars of about 5000.
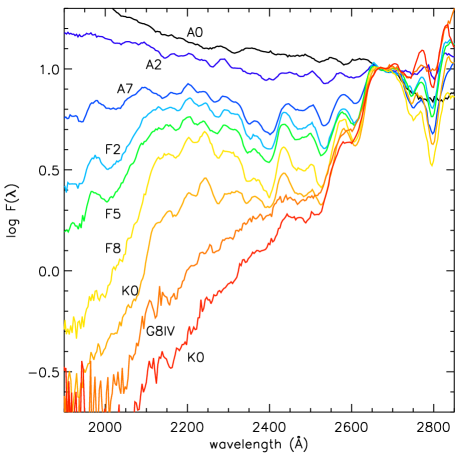
The distribution of the spectral types of the stars present in our sample is shown in Fig. 2: the peak corresponds to F and G types, with a significant contribution of A and K type stars. In an effective temperature scale, this translates to roughly the interval 4000–10000 K. In this plot we incorporate those stellar objects that have a spectral classification in SIMBAD. The fraction of white dwarfs with respect of all other stars can be biased from the fact that they were selected for calibration purposes. Examples of high SNR GALEX stellar spectra along the spectral type sequence are shown in Fig. 3.
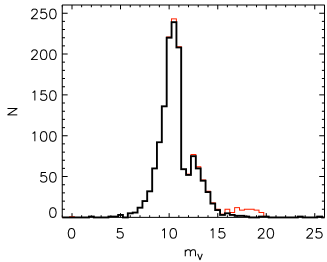
The apparent V magnitude distribution (Fig. 4) of the SIMBAD sample is highly peaked at around 9–11 mag. The distribution of stellar objects (thick black line) almost coincide with the total distribution up to 15 mag: this implies that they mostly belong to the Galactic thin and thick disk components444A typical G dwarf of mag would have a distance of 158 pc, if mag, and 1000 pc, if mag. (e.g., Jurić et al., 2008). Point-like non-stellar objects are the majority of dimmer objects in the 15–20 mag interval.
4 A new set of spectroscopic indices for GALEX observations.
| Index namea | Blue band | Index band | Red Band |
|---|---|---|---|
| gFei2260 | 2230–2256 | 2259–2285 | 2294–2320 |
| gFeii2332 | 2294–2320 | 2338–2364 | 2421–2447 |
| gFeii2402 | 2294–2320 | 2380–2406 | 2421–2447 |
| gBL2538 | 2448–2474 | 2511–2537 | 2644–2670 |
| gFeii2609 | 2448–2474 | 2597–2623 | 2644–2670 |
| gBL2730 | 2732–2758 | 2674–2703 | |
| gMgii2800 | 2784–2810 | 2674–2703 | |
| g2609/2680 | 2597–2623 | 2674–2703 | |
| g2000/2180 | 2000–2026 | 2156–2182 | |
| aThe g prefix is added to differentiate these indices | |||
| from those defined in the original Fanelli’s (IUE) system. | |||
The use of spectrophotometric indices to extract selected information from spectra has been a very common practice in the optical; for example, the Lick/IDS system (Trager et al., 1998, and references therein) has found a great number of applications in many different research fields. In the UV, however, the use of this kind of analytical tool has been much less widespread. Recently, Chavez et al. (2007, 2009) have studied the mid-UV spectral morphology of stars and evolved stellar populations by means of the Fanelli et al. (1992) set of indices computed in IUE observations.
For the analysis of our sample, we used a set of 9 spectrophotometric indices carefully defined to be suitable for the GALEX spectral resolution and to maximize the sensitivity to stellar parameter variations. Since the indices mainly depend on the strength of absorption features, they are most suitable for late-type stars, while they decrease their effectiveness for hot O–B stars.
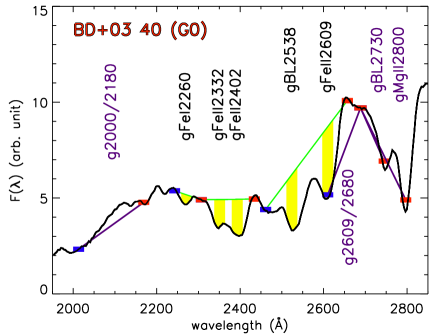
The index ID and passbands are reported in Table 1 and shown in Fig. 5. For 5 indices we have adopted the definition given by Eq. 5 in Fanelli et al. (1992). In this definition the flux in the index band is compared to a pseudo-continuum, obtained by the interpolation of the fluxes in the two side bands; the other 4 indices are narrow-band colors, which measure the difference in magnitude between the blue and red band. Note that, due to the red edge cut-off sensitivity, it was not possible to define a suitable red band for the indices measuring the strength of the Mg ii doublet at 2800 Å and the blend around 2730 Å: we have therefore defined two colors, where the blue and red bands are inverted; in this way, the indices have increasing values with increasing line absorption. The first 8 indices of the table measure the intensity of the same spectral features of the Fanelli et al. system, apart from gBL2730, which merges together the two IUE absorption blends at 2720 and 2740 Å due to the lower GALEX spectral resolution. The brand new index that we have defined, the color g2000/2180, takes advantage of the higher sensitivity of GALEX at Å with respect to IUE. This property also allows more precise measurements of the gFeii2332 and gFeii2402 indices, which Chavez et al. (2009) point out as being good tracers of relatively young and metal rich stellar populations.
The new indices were measured in three different spectral samples:
-
•
the 6037 selected GALEX point-like sources;
-
•
the ATLAS library of synthetic stellar SEDs of Castelli & Kurucz (2003)555http://wwwuser.oat.ts.astro.it/castelli/, after having homogenized them to the same spectral resolution and wavelength sampling of the GALEX data. Since the flux is sampled at Å, this library is suitable for analysing GALEX spectra;
- •
| Index | a | b | used | excl. | |
|---|---|---|---|---|---|
| gFei2260 | 0.016 | 0.597 | 0.022 | 71 | 23 |
| gFeii2332 | 0.029 | 1.369 | 0.128 | 79 | 15 |
| gFeii2402 | 0.062 | 1.699 | 0.177 | 82 | 13 |
| gBL2538 | 0.025 | 1.419 | 0.095 | 61 | 34 |
| gFeii2609 | -0.008 | 1.285 | 0.097 | 67 | 28 |
| gBL2730 | 0.023 | 1.430 | 0.127 | 79 | 15 |
| gMgii2800 | 0.223 | 1.133 | 0.274 | 84 | 10 |
| g2609/2680 | 0.019 | 1.151 | 0.088 | 72 | 23 |
| g2000/2180 | 0.125 | 1.365 | 0.426 | 80 | 13 |
 |
 |
 |
4.1 Calibration of the theoretical indices.
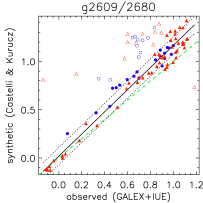
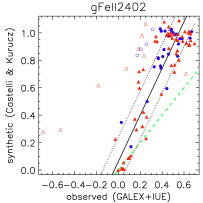
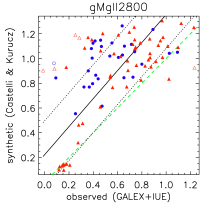
Since the ATLAS SEDs do not perfectly reproduce the spectra of real stars (Bertone et al., 2004, 2008; Rodriguez-Merino et al., 2005), the theoretical indices must be converted to the observed system, before applying them to the analysis of the GALEX sample. We performed this calibration, as in Chavez et al. (2007), by means of a sample of stars, which were observed by GALEX and whose complete set of atmospheric parameters (,,[M/H]) is given in the PASTEL catalog (Soubiran et al., 2010). Since the total number of these stars is not large enough to provide a good calibration, we added a sample of IUE star from the Wu et al. (1983) catalog. The theoretical spectra, with parameters corresponding to each of the calibration stars, were obtained by a tri-linear interpolation of the Castelli & Kurucz (2003) grid. Figure 6 shows the comparison between the observed and the theoretical indices for three indices, which are representative of the different degrees of agreement, from one of the best cases (g2609/2680) to the worst (gMgii2800). The trasformation equations are obtained by an iterative process of linear interpolation (), excluding at each step the outliers which stand more than 2 away from the fitted value. In Tab. 2 we report, along with the , parameters, the final rms and the number of stars used and excluded in the fitting process. There is a clear tendency of the theoretical value to be higher than the observed data, the only exception being the gFei2260 index. This disagreement makes the tranformation process compulsory if the goal is to apply this set of theoretical indices to the determination of the atmospheric parameters of stars.
4.2 Theoretical indices vs. stellar atmospheric parameters.
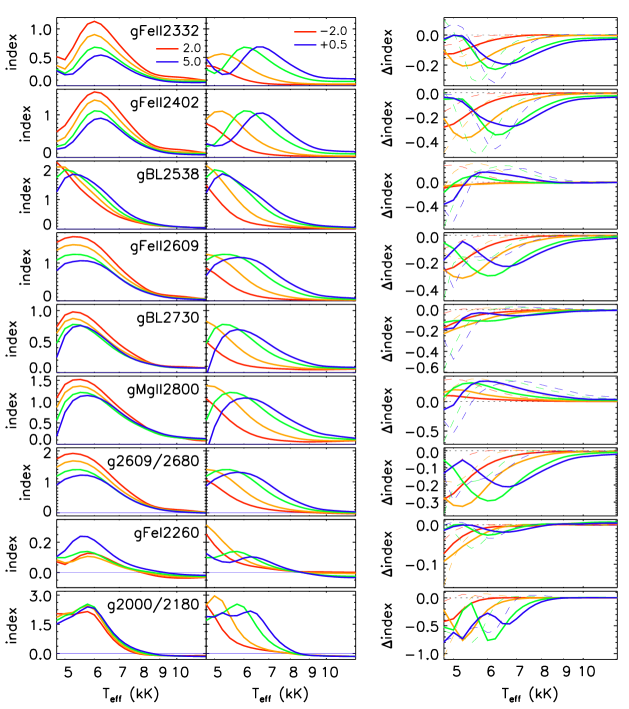
Within the theoretical framework, we explored the sensitivity of each index with respect to the fundamental stellar atmospheric parameters: effective temperature (), surface gravity (), global metallicity ([M/H]), and the [/Fe] enhancement. The results are displayed in Fig. 7. The indices that measure common spectral features with those of Fanelli et al. (1992) show similar trends, with respect to , , and [M/H], as those calculated with the Fanelli’s passbands definition (Rodriguez-Merino, 2004; Chavez et al., 2007). Apart from the two bluest indices, the values are larger for lower gravities. The slope g2000/2180 is an interesting case, since it is almost independent of gravity over the whole temperature range. As far as [M/H] is concerned, all indices show a strong dependence and a similar pattern: the temperature at the peak increases with increasing metal abundance.
Chavez et al. (2009) found a strong effect of the -enhancement in the SEDs of stars and simple stellar populations all over the mid-UV interval. In what follows, we explore its impact on the spectroscopic indices. In the Castelli & Kurucz (2003) library, the -enhanced models and fluxes were computed by adding an extra abundance of +0.4 dex to each element, which causes an increase of about +0.3 dex to the global metallicity with respect to the nominal one. Therefore, to compare the results at equal , we scaled down all abundances of the [/Fe]=+0.4 models to reach the same global metallicity as the solar-scaled models and we computed the correspondent SEDs by linear interpolation in the grid of theoretical fluxes. The abundance rescaling produces a significant reduction of the non- elements, in particular of the Fe, which is reflected in a decrement of almost all the GALEX indices, whose intensity is strongly dependent from the absorption of iron atoms, which is one of the main sources of opacity in the mid-UV. The indices gBL2538 and gMgii2800 are the only ones which present non negligible positive differences in -enhanced spectra: this is due, in both cases, to the presence of magnesium and, subordinately, titanium absorption lines inside the central index band. In Fig. 7, we also trace a comparison of the indices computed for the original Castelli & Kurucz (2003) [/Fe]=+0.4 SEDs and the correspondent solar-scaled ones: in this case, besides the effect of the enhancement of the elements, the difference takes into account the global increasing in metallicity; therefore, the difference has higher values (i.e., less negative) at higher temperatures, where the index strength increases with increasing global metallicity, and, viceversa, -enhanced indices are lower were the index dependence to metallicity is reversed.
We conducted a complementary analysis assessing the effect of interstellar extinction on the indices. For this test we considered =0.1, which is a typical value for the objects of our sample. The results indicate that index variations due to extinction are negligible.
 |
 |
 |
5 Atmospheric parameters of the GALEX objects.
We have used the set of indices defined here to determine the three main stellar atmospheric parameters for all the objects of the selected sample. For non-stellar objects contaminating the sample the results are, of course, meaningless. In this first work on GALEX spectra, we restricted the examination of the results to a statistical analysis.
We obtained effective temperature, surface gravity, and global metallicity of each object by minimizing the chi-square distances between the observed set of indices and the theoretical ones. The reduced chi-square is defined as:
| (1) |
where runs over the spectroscopic indices , while indicates the theoretical model and is the number of indices which could be computed from the spectrum. The error for each observed index is determined via a Montecarlo computation: a random error taken from a Gaussian distribution, with standard deviation equal to the observed flux error, is added to the original GALEX spectrum and the indices are computed on this new spectrum. This is repeated 200 times and the error of each index is given by the standard deviation of the index distribution.
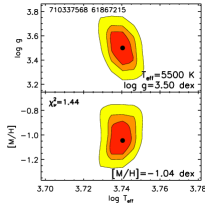
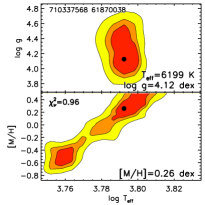
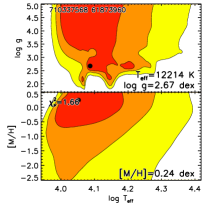
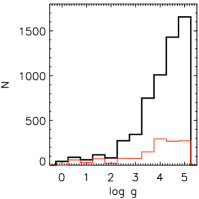
We searched for the combination of , , and [M/H] that presents the minimum , so that we could extract the planes at fixed metallicity and at fixed gravity that included this point. We then refined the determination of the minimum on the two surfaces after smoothing them with a quintic surface, by means of the tri_surf IDL function. The loci of the minima allow the determination of the best values of , , and [M/H] of each object. In Fig. 8, we present three examples of the contour plots of the in the vs. and [M/H] vs. planes: they show one case where the procedure provides a precise determination of the stellar parameters (upper panel), a second case where the –[M/H] degeneracy generates two 1- regions (middle panel), and finally an example of a failure of the method to determine the parameters with an adequate precision (lower panel).
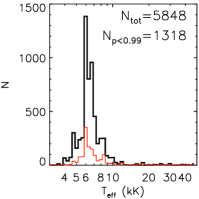
The distributions of the results are shown in Fig. 9. The histogram of the effective temperature peaks at K, typical of early-G or late-F spectral types, and show very large numbers up to K (the F-type interval). A significant fraction of objects have a temperature of later G- and K- (approximately 4000–5800 K) and A-type (7000–10000 K) stars, while outside this interval the numbers are very small. This distribution well agrees with the stellar type histogram of the SIMBAD stellar sub-sample (Fig. 2).
 |
 |
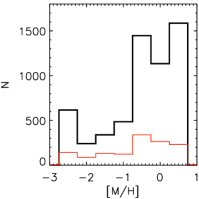 |
The surface gravity distribution indicates a preponderance of main sequence objects ( dex) with respect to more evolved stars, while the histogram of the global metallicity shows a majority of stars with dex. This is in agreement with the properties of the Galactic stellar populations of the thin and thick disks (e.g., Buser et al., 1999, and references therein).
Since the theoretical stellar library includes only two values of -enhancement, we excluded, for now, the determination of this further parameter. We can say, nevertheless, that, according to the behaviour of the indices with [/Fe] shown in Fig. 7, we expect to have slightly overestimated the effective temperature and underestimated the global metallicity if an enhancement is present in some of the stars.
Acknowledgements The authors acknowledge partial financial support from Mexican CONACyT via grant 49231-E. This research has made use of the SIMBAD database, operated at CDS, Strasbourg, France.
References
- Barger & Cowie (2010) Barger, A. J., & Cowie, L. L. 2010, Astrophys. J., 718, 1235
- Bello-Ramírez & Rosa-González (2009) Bello-Ramírez, M., & Rosa-González, D. 2009, New Quests in Stellar Astrophysics. II. Ultraviolet Properties of Evolved Stellar Populations, 113
- Bertone et al. (2004) Bertone, E., Buzzoni, A., Chavez, M., & Rodriguez-Merino, L. H. 2004, Astron. J., 128, 829
- Bertone et al. (2008) Bertone, E., Buzzoni, A., Chávez, M., & Rodríguez-Merino, L. H. 2008, Astron. Astrophys., 485, 823
- Bohlin et al. (2001) Bohlin, R. C., Dickinson, M. E., & Calzetti, D. 2001, Astron. J., 122, 2118
- Buser et al. (1999) Buser, R., Rong, J., & Karaali, S. 1999, Astron. Astrophys., 348, 98
- Castelli & Kurucz (2003) Castelli, F., & Kurucz, R. L. 2003, in Modelling of Stellar Atmospheres, 210, 20P
- Chavez et al. (2007) Chavez, M., Bertone, E., Buzzoni, A., Franchini, M., Malagnini, M. L., Morossi, C., & Rodriguez-Merino, L. H. 2007, Astrophys. J., 657, 1046
- Chavez et al. (2009) Chavez, M., Bertone, E., Morales-Hernandez, J., & Bressan, A. 2009, Astrophys. J., 700, 694
- Cowie et al. (2010) Cowie, L. L., Barger, A. J., & Hu, E. M. 2010, Astrophys. J., 711, 928
- Durand et al. (1949) Durand, E., Oberly, J. J., & Tousey, R. 1949, Astrophys. J., 109, 1
- Fanelli et al. (1992) Fanelli, M. N., O’Connell, R. W., Burstein, D., & Wu, C. 1992, Astrophys. J. Suppl. Ser., 82, 197
- Feldman et al. (2010) Feldman, P. D., McCandliss, S. R., Morgenthaler, J. P., Lisse, C. M., Weaver, H. A., & A’Hearn, M. F. 2010, Astrophys. J., 711, 1051
- Holberg et al. (2003) Holberg, J. B., Barstow, M. A., & Burleigh, M. R. 2003, Astrophys. J. Suppl. Ser., 147, 145
- Jurić et al. (2008) Jurić, M., et al. 2008, Astrophys. J., 673, 864
- Martin et al. (2005) Martin, D. C., et al. 2005, Astrophys. J., L1
- Morrissey et al. (2005) Morrissey, P., et al. 2005, Astrophys. J. Lett., 619, L7
- Morrissey et al. (2007) Morrissey, P., et al. 2007, Astrophys. J. Suppl. Ser., 173, 682
- Rodriguez-Merino (2004) Rodríguez-Merino, L. H. 2004, PhD Thesis, INAOE, Mexico
- Rodriguez-Merino et al. (2005) Rodríguez-Merino, L. H., Chavez, M., Bertone, E., & Buzzoni, A. 2005, Astrophys. J., 626, 411
- Rosa-González et al. (2009) Rosa-González, D., Buat, V., Burgarella, D., Boissier, S., Boselli, A., & Gil de Paz, A. 2009, New Quests in Stellar Astrophysics. II. Ultraviolet Properties of Evolved Stellar Populations, 109
- Soubiran et al. (2010) Soubiran, C., Le Campion, J.-F., Cayrel de Strobel, G., & Caillo, A. 2010, Astron. Astrophys., 515, A111
- Trager et al. (1998) Trager S. C., Worthey G., Faber S. M., Burstein D., Gonzalez J. J., 1998, ApJS, 116, 1
- Wu et al. (1983) Wu, C. C., Boggess, A., Bohlin, R. C., Imhoff, C. L., Holm, A. V., Levay, Z. G., Panek, R. J., Schiffer, F. H., & Turnrose, B. E. 1983, Greenbelt: NASA-GSFC