Concurrent X-ray, near-infrared, sub-millimeter,
and GeV gamma-ray observations of Sgr A⋆
Abstract
Aims. The radiative counterpart of the supermassive black hole at the Galactic center (GC), Sgr A⋆, is subject to frequent flares visible simultaneously in X-rays and near-infrared (NIR). Often, enhanced radio variability from centimeter to sub-millimeter wavelengths is observed to follow these X-ray/NIR eruptions. We present here a multi-wavelength campaign carried out in April 2009, with the aim of characterizing this broadband flaring activity.
Methods. Concurrent data from the XMM-Newton/EPIC (2–10 keV), VLT/NACO (2.1 m, 3.8 m), APEX/LABOCA (870 m), and Fermi/LAT (0.1–200 GeV) instruments are employed to derive light curves and spectral energy distributions of new flares from Sgr A⋆.
Results. We detected two relatively bright NIR flares both associated with weak X-ray activity, one of which was followed by a strong sub-mm outburst 200 min later. Photometric spectral information on a NIR flare was obtained for the first time with NACO giving a power-law photon index (). The first attempt to detect flaring activity from the Fermi GC source 1FGL J1745.6–2900 is also reported. NIR, X-ray, and sub-mm flares are finally modeled in the context of non-thermal emission processes. It is found that the simplest scenario involving a single expanding plasmoid releasing synchrotron NIR/sub-mm and synchrotron self-Compton X-ray radiation is inadequate to reproduce the data, but suggestions to reconcile the basic elements of the theory and the observations are proposed.
Key Words.:
Galaxy: center – Black hole physics – Radiation mechanisms: non-thermal – X-rays: general – Infrared: general – sub-millimeter – Gamma-rays: observations1 Introduction
The tracing of stellar orbits in the heart of the Milky Way since the early 90’s has definitely established the presence of a central high concentration of mass, , confined to a region no bigger than the Solar System (Ghez et al., 2008; Gillessen et al., 2009). This is the best evidence to date for the existence of a supermassive black hole at the Galactic center (GC, see Melia, 2007, for a comprehensive review). The relative proximity of this black hole (8 kpc, Reid et al., 2009) has enabled thorough observations of its weak point-like radiative manisfestation, Sagittarius A⋆ (Sgr A⋆), all accross the electromagnetic spectrum. In spite of a high interstellar extinction, wich precludes detections at optical and ultraviolet wavelengths, Sgr A⋆ has now been positively detected in radio (from cm to sub-mm wavelengths, Balick & Brown, 1974; Zylka & Mezger, 1988), near-infrared (NIR, Genzel et al., 2003), and X-rays (Baganoff et al., 2003). In the vast -ray domain, point-like sources coincident with the position of Sgr A⋆ have been found at the 10 keV (IGR J17456–2901, Bélanger et al., 2004), GeV (1FGL J1745.6–2900, Abdo et al., 2010), and TeV (HESS J1745–290, Aharonian et al., 2004) levels, though their association with the supermassive black hole is less evident.
One striking feature of Sgr A⋆ is its temporal variability. Albeit much more quiet than typical active galactic nuclei (AGNs), Sgr A⋆ displays rapid flares from time to time, in X-rays and NIR, thus temporarily enhancing its luminosity by factors up to 160 on timescales of 1–2 hr. X-ray flares have been discovered at a rate of about one event per day by the Chandra (Baganoff et al., 2001) and XMM-Newton (Goldwurm et al., 2003) satellites, while NIR flares seem to recur more frequently (2–6 events per day) as observed by the VLT (Genzel et al., 2003), the Keck (Ghez et al., 2004), the HST (Yusef-Zadeh et al., 2006a), and Subaru (Nishiyama et al., 2009).
These flares usually present short timescale variations pointing to an emitting region with a size on the order of 10 or less, where is the Schwarzschild radius of the black hole. They have thus offered new probes into the central engine and received considerable attention via extensive multi-wavelength campaigns since their discoveries. On the one hand, such campaigns revealed that all X-ray flares seem to have a simultaneous NIR counterpart (Eckart et al., 2004, 2006a, 2008a; Hornstein et al., 2007; Yusef-Zadeh et al., 2006a, 2009; Dodds-Eden et al., 2009), while not all NIR flares have detectable X-ray counterparts (Hornstein et al., 2007). Considering also the linear polarization properties of NIR flares (e.g., Eckart et al., 2006b), a general consensus emerged in which the origin of NIR flares was ascribed to synchrotron radiation of transiently accelerated electrons and X-ray flares to the corresponding inverse Compton emission, especially synchrotron self-Compton (SSC) (e.g., Liu et al., 2006a, b). However, the recent study of an exceptionally bright X-ray/NIR flare detected on April , 2007, challenged the SSC model (Dodds-Eden et al., 2009; Trap et al., 2010). This proved the necessity to measure contemporaneous spectra (with good statistics) in infrared and in X-rays, to constrain the overall spectral energy distribution (SED) of the flares. Yet, past attempts to obtain NIR spectral information on Sgr A⋆ have given various and sometimes conflicting results (e.g., Gillessen et al., 2006; Hornstein et al., 2007).
On the other hand, broadband campaigns found indications that contemporaneous X-ray/NIR flares could be accompanied by delayed radio activity (Yusef-Zadeh et al., 2006a; Eckart et al., 2006a). This was interpreted as a sign of expanding plasmoids in the vicinity of the supermassive black hole, releasing optically thin and thick synchrotron emission whose peak evolves with frequency (van der Laan, 1966). Recently, Marrone et al. (2008) and Yusef-Zadeh et al. (2008) clearly detected an increase in the mm and sub-mm emission, using the Sub-Millimeter Array (SMA) and the Caltech Sub-millimeter Observatory (CSO) respectively, following an X-ray/NIR flare detected by Chandra and the Keck observatories. In the frame of an SSC/expanding blob model, Marrone et al. (2008) argued that there should be an observable correlation between the X-ray to NIR peak ratio and the sub-mm time delay, which could help test this picture.
We present here a new X-ray, NIR, and sub-mm campaign involving the X-ray Multi-Miror (XMM)-Newton satellite, the Very Large Telescope (VLT), and the Atacama Pathfinder EXperiment (APEX) observatory, respectively. The data obtained enable us to investigate the aforementioned issues by measuring Sgr A⋆’s time variability and spectrum across a broad range of wavelengths. Concurrent public GeV -ray data from the Fermi satellite are also examined. Additional radio data will be reported elsewhere.
This paper is organized as follows. In Sect. 2, we give brief summaries of the data acquisition and reduction of each telescope. In Sect. 3, we describe the respective light curves of Sgr A⋆, identify new flares, and compare their properties to past detections. Sect. 4 is dedicated to the NIR color measurements performed on one particular flare, while Sect. 5 discusses possible phenomenological interpretations of the light curves and SEDs of all the newly detected flares.
2 Observations and data analysis
We observed the GC in early April 2009 in the context of a large multi-wavelength campaign that was initiated by an XMM-Newton/VLT joint program and followed by an APEX monitoring scheduled accordingly. A detailed observation journal for this set of instruments is given in Tab. 1. Fermi data too were recorded at the epoch of this campaign as part of the ongoing monitoring of the GeV -ray sky. We present these data and their respective treatments below.
| Orbit | ObsID | Start date | Exp. | Band |
| [UTC] | [ks] | |||
| XMM-Newton/PN | ||||
| 1705 | 554750401 | 2009 Apr 1, 01:18:30 | 37.8 | 2–10 keV |
| 1706 | 554750501 | 2009 Apr 3, 01:56:31 | 42.0 | 2–10 keV |
| 1707 | 554750601 | 2009 Apr 5, 03:53:34 | 32.4 | 2–10 keV |
| VLT/NACO | ||||
| 082.B-0952A | 2009 Apr 1, 06:46:59 | 11.5 | 3.8 m () | |
| 082.B-0952A | 2009 Apr 3, 07:25:41 | 9.7 | 2.1 m () | |
| 082.B-0952A | 2009 Apr 3, 07:28:42 | 9.7 | 3.8 m () | |
| 082.B-0952A | 2009 Apr 5, 08:44:10 | 6.6 | 3.8 m () | |
| APEX/LABOCA | ||||
| 183.B-0100A | 2009 Apr 1, 05:31:43 | 30.7 | 870 m | |
| 183.B-0100A | 2009 Apr 3, 11:07:43 | 8.2 | 870 m | |
| 183.B-0100A | 2009 Apr 5, 06:40:10 | 25.6 | 870 m |
2.1 XMM-Newton (2–10 keV)
The X-ray satellite XMM-Newton (Jansen et al., 2001) pointed toward the GC on three occasions between April 1st and Apr 5th 2009 ( ks). In the following, we will consider the data recorded with the Medium filter by the European Photon Imaging Camera (EPIC), i.e. the PN (Strüder et al., 2001) and the MOS 1–2 cameras (Turner et al., 2001) instruments, all operated in Prime Full Window mode. The data were reduced and analyzed with the Science Analysis Software (SAS) package (version 8.0.0) and the latest calibration files available at the time of the analysis. They were not contaminated by soft proton flares from solar activity. Starting with the original Observation Data Files, event lists were generated through the emchain and epchain routines, and filtered with PATTERN <= 4 or 12 (for PN and MOS respectively), to ensure the selection of X-rays and rejection of cosmic rays. In order to prevent the use of X-ray photons that fell on bad pixels, we also applied the #XMMEA_EP and #XMMEA_EM filters on the event lists. Finally, artefacts from the calibrated, and concatenated datasets and events near CCD gaps were discarded by setting FLAG == 0 as selection criterion. We note that the high interstellar absorption toward the GC ( cm-2) prevents the use of photons below 2 keV, so that the following count rates, fluxes, and luminosities will refer to the 2–10 keV band.
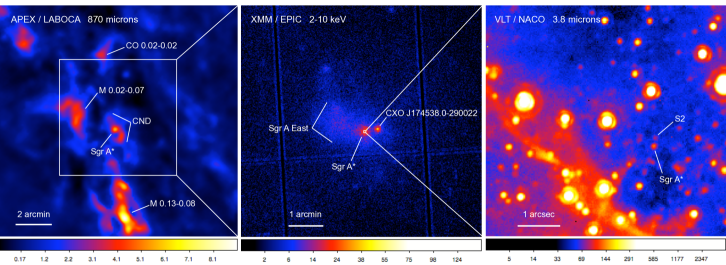
The image obtained by the PN detector and reproduced in Fig. 1 (middle panel), reveals the usual constituents of the Galactic nucleus visible via XMM-Newton: extended thermal emission from the shell of the supernova remnant Sgr A East (Sakano et al., 2004) and point-like emission conincident with the position of Sgr A⋆. In addition, these observations allowed to locate another point source at only 27′′ from Sgr A⋆, which we identify with the weak transient CXOGC J174538.0–290022 ( erg s-1 at 8 kpc, Ponti et al., 2009).
To search for time variability of Sgr A⋆, we first fitted the positions of the point sources by running the edetect_chain procedure. A light curve of Sgr A⋆ was then extracted from a radius circular region centered on the fitted position in each EPIC detectors. These light curves were background subtracted, with the background regions selected following the prescriptions given in Kirsch (2005) and the counts scaled to the same extraction area as Sgr A⋆. Finally, the 2–10 keV background subtracted PN, MOS 1, and MOS 2 light curves were summed and rebinned with a sampling of 600 s for the 1st and 3rd observations, and 400 s for the 2nd. Note that, as resolved by previous Chandra deep observations, the persistent X-ray emission from a radius region centered on Sgr A⋆, not only contains the X-ray counterpart of Sgr A⋆, but also includes persistent compact sources such as the star group IRS 13 (Baganoff et al., 2003) and the pulsar wind nebula candidate G 359.95–0.04 (Wang et al., 2006), possible transient point sources (Muno et al., 2005), as well as a diffuse component (Muno et al., 2003).
2.2 VLT (2.1 m and 3.8 m)
The three X-ray observations described in the last paragraph were partly covered by NIR observations with the NACO instrument, NAOS (Nasmyth Adaptive Optics System, Lenzen et al., 2003) + CONICA (COudé Near Infrared CAmera, Rousset et al., 2003), mounted on the fourth unit telescope, Yepun, at ESO’s VLT in Paranal, Chile. These observations were divided into three half nights (April 1st, 3rd, and 5th 2009), which all started in the middle of the night and were extended as long as possible until sunrise.
We acquired data solely in the -band (3.8 m) during the 1st and 3rd nights, while during the 2nd night, atmospheric conditions were favorable to also collect images in the -short () band at 2.1 m. During this latter night, we attempted a novel filter switching technique with NACO in order to study the color of Sgr A⋆ from broadband quasi-simultaneous NIR measurements. Up to now, it has only been possible to investigate the spectrum of Sgr A⋆ at the VLT through the integral field spectrograph SINFONI over relatively narrow bands: the +-band (1.7–2.4 m, Eisenhauer et al., 2005) and the -band (2.0–2.4 m, Gillessen et al., 2006). Using NACO, we obtained for the first time spectral data over a wider wavelength range and with better Strehl ratios, by constantly cycling back and forth between and photometric filters throughout the night. We carried out successive full switches (switching - to -band, acquiring two -band images, switching - to -band and acquiring two -band images) on a timescale of only 5–5.5 min. All the data examined here were collected with the supergiant IRS 7 as natural guide star and the infrared wavefront sensor to close the adaptive optics loop of NAOS. Images were individually sky-subtracted, flat-fielded, and corrected for dead/hot pixels (see Fig. 1, right panel).
In Fig. 3, 4, and 5 we display the light curves of Sgr A⋆ corrected for extinction with the usual values mag and mag, in order to allow comparison with previous works (e.g., Genzel et al. 2003; Dodds-Eden et al. 2009). They were obtained via aperture photometry and calibrated with the fluxes of nearby stars of known and stable brightness: all fluxes were scaled so that the median flux of the relatively isolated star S 65 always corresponds to an apparent magnitude of 13.7 mag (Gillessen et al., 2009) and the median flux of IRS 16 NW to an apparent magnitude of 8.38 mag (Viehmann et al., 2005). More details on the 2nd night light curves are given in Sect. 4. The duration of the 3rd night light curve is reduced compared to the other two due to a technical problem with the telescope. We stress that, at the time of these observations, Sgr A⋆ was confused with the star S 17, whose contribution to the light curves is expected to be a constant value of 5.4 mJy and 3.5 mJy in the - and -band, respectively (see S 17 magnitudes reported in Ghez et al., 2005, corrected with the aforementioned values of ).
2.3 APEX (870 m)
In parallel to the X-ray and NIR surveys, a total of 20 hr of sub-mm GC data were taken at 870 m (345 GHz). We used the Large APEX bolometer camera (LABOCA, Siringo et al., 2009), on the APEX telescope (Güsten et al., 2006) at Llano Chajnantor, Chile. LABOCA is an array of 295 composite bolometers operating in the 345 GHz transmission window. The angular resolution (FWHM) of each beam is for a bandwidth of 60 GHz. LABOCA’s layout leads to a double beam spaced distribution of the individual beams in a hexagonal configuration over a field of view (FOV).
The observations performed on the 1st and the 5th of April spanned 8.5 and 7.5 hr, respectively, with an interruption of 1 hr and 15 min between UT 8:45 and 10:00. During this time interval, the GC passed above the telescope’s elevation limit of 80∘. Observations on April 3rd only covered the period after this GC transit (UT 11:00 – 13:30). Note that the APEX and VLT sites have basically the same longitude, but, contrary to the VLT, APEX could continue observing past sunrise, till the elevation of the GC was too low to allow for reliable monitoring purposes (elevation between 30∘ and 40∘, depending on weather conditions). The precipitable water vapor during the three runs was 2, 0.9, and 0.2–0.4 mm, respectively.
The GC was observed using “on the fly” maps with scanning angles of 15∘, 0∘, or 15∘ relative to the orthogonal direction across the Galactic plane. The maps were built with a scanning speed of 2 arcmin s-1 and steps orthogonal to the scanning direction of . The total integration time of each map was 315 s. Each GC map was followed by observations of G 10.62 and G 5.89, standard LABOCA secondary calibrators. The atmospheric zenith opacity was determined via skydips every 1–2 hr. With this observing setup, Sgr A⋆ flux was monitored every 8 min.
The data were reduced using the BoA software package. Reduction steps on the bolometer time series include temperature drift correction based on two “blind” bolometers, flat-fielding, calibration, opacity correction, correlated noise removal on the full array as well as on groups of bolometers related by the wiring and in the electronics, flagging of bad bolometers, and finally de-spiking. Each reduced scan was then gridded into a spatial intensity and weighting map. These reduction steps were applied to the GC and both calibrators scans. Flux calibration was achieved using G 10.62, which has a known flux density of Jy for LABOCA (Siringo et al., 2009). The absolute calibration accuracy is roughly 10%. To infer the relative calibration error, we applied the calibration curve of G 10.62 to G 5.89 and determined the dispersion of the measured G 5.89 fluxes over the observing period. This yielded a relative calibration accuracy of 3%.
For the determination of Sgr A⋆’s light curve we first generated a model of the sub-mm emission of the region by co-adding all calibrated and pointing drift corrected GC maps. In this high signal to noise map (see Fig. 1, left panel), we note the presence of several molecular clouds in accordance with previous sub-mm GC surveys (Pierce-Price et al., 2000), and the point source Sgr A⋆, which was fitted with a gaussian and later subtracted from the co-added map. We finally re-reduced all GC scans and subtracted the model signal from the time serie of each bolometer. The resulting maps only contain the point source Sgr A⋆. The light curves were eventually constructed by fitting a gaussian to each individual map (see Fig. 3, 4, and 5). The error bars were estimated through the RMS of the calibrator G 5.89 (2.7 %). Note that Sgr A⋆ does not suffer from any significant interstellar extinction at 870 m.
2.4 Fermi (0.1–200 GeV)
The Fermi space observatory carries the Large Area Telescope (LAT, Atwood et al., 2009), a high-energy -ray pair-conversion telescope covering the 30 MeV to 300 GeV band with a wide FOV (2.4 sr). It operates almost as an all-sky monitor and can provide regular 50 min uninterrupted exposures on the GC. Using the public Fermi data archive, we explored the periods covered by the aforementioned observations of April 2009, and searched for a potential -ray flaring activity correlated with variability in other spectral domains.
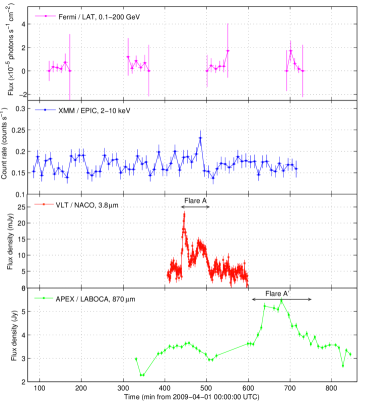
The LAT data were analyzed with the Fermi Science Tools and following the analysis threads distributed by the Fermi Science Support Center. We created events cube with the gtselect routine by selecting only -ray photons (“diffuse” class events, N∘3). We then used gtmktime and the “spacecraft” file which keeps track of the satellite’s attitude as a function of time, to perform good time intervals selections. A zenith-angle cut was thereby applied (∘), rejecting -rays emanating from Earth albedo. The light curves were derived via aperture photometry (gtbin) with a circular extraction region of radius 1∘, centered on the position of Sgr A⋆. The fluxes thus measured include the diffuse -ray emission associated with cosmic ray interactions in GC molecular clouds. The number of counts in each bin, , being governed by Poissonian statistics, 1 (84% confidence level) error bars were approximated by (Gehrels, 1986). Finally, we computed the exposures of each time bin in s-1 cm-2 with gtexposure. The resulting 0.1–200 GeV light curves are presented in the top panels of Fig. 3, 4, and 5, with a time bin of 600 s (10 min).
For illustration purposes, we produced an average LAT image of the GC (Fig. 2) using all the data from the 1st year of full sky survey, from August 2008 to August 2009. Only high energy photons from the 1–200 GeV band were considered to optimize the single photon angular resolution (∘ at energies GeV).
3 Light curves and flares
In this Section, we discuss the properties of the multi-wavelength light curves and compare them with the relevant literature.
3.1 NIR
The 1st night of observations was marked by a strong NIR flare detected in the -band between 440–515 min past midnight (Fig. 3), hereafter referred to as “Flare A”. It was brighter than the star S 2 (see the pale red dot north of Sgr A⋆ in Fig. 1, right panel) and peaked at mJy (background subtracted), which makes it the 2nd brightest flare covered in X-rays and one of the few powerful NIR flares so far detected that are on the order of 20 mJy (in all NIR bands considered) or beyond (Dodds-Eden et al., 2009; Eckart et al., 2008a, b; Meyer et al., 2006b, 2007). It is worth noting that Flare A has a complex non-symmetrical morphology, characterized by a very sharp rise (a continuous gain of 19 mJy in 7 min) followed by a slower and non-monotonic decay. This rise time is one of the fastest ever reported and is actually rather unusual among strong NIR flares. It hence places a stringent upper limit on the size of the overall flare emitting region of 10 (or 1 AU), with a causality argument () and considering a mass of for the black hole.
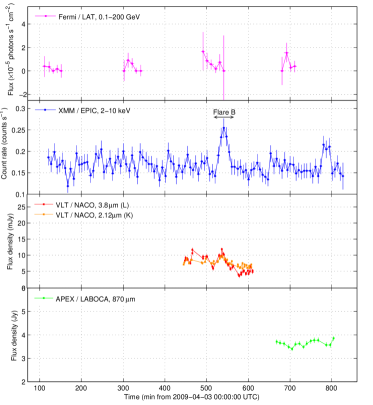
During the 2nd night, the time resolution of the light curves was not as good as during the other nights, given the continuous cycling through the and filters, and hence makes the identification of flares more difficult. Sgr A⋆ seems to have been continuously variable in both bands at a significant level (see Fig. 7, top panel, and § 4), at least during the first two thirds of the observation. Our X-ray coverage allows us to clearly isolate a new eruption—Flare B—between 520 and 560 min after 2009–04–03 00:00:00 UTC though (see paragraph 3.2 and Sect. 4). This time, the shape of the flare’s light curve is more symmetrical, with no time delay between the peaks of the - and -bands larger than 5 min, the time resolution of the light curve. The peak fluxes of Flare B are and mJy (background subtracted) in the - and -band, respectively.
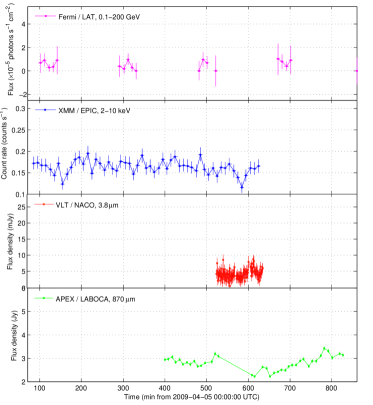
No significant flare was recorded during the 3rd night, which had an observed mean flux density of 4 mJy.
| References 111References: [1] This work, [2] Porquet et al. (2008), [3] Dodds-Eden et al. (2009), [4] Yusef-Zadeh et al. (2009), [5] Bélanger et al. (2005), [6] Yusef-Zadeh et al. (2006a), [7] Hornstein et al. (2007), [8] Eckart et al. (2008a), [9] Eckart et al. (2006a), [10] Eckart et al. (2004). | Date | Instruments | NIR filter 222The HST 1.6 and 1.7 m pass-bands correspond to the NICMOS filters F160W and F170M, respectively. | 333Peak X-ray luminosity (2–10 keV) in units of the quiescent level ( erg s-1, Baganoff et al., 2003). ‘’ and ‘’ signs were added when the peak flux was missed or not simultaneous to the NIR peak. | 444Background subtracted peak NIR fluxes in the bands indicated in the fourth column, dereddened assuming mag, mag, mag, and mag. | 555Equivalent NIR flux in the -band extrapolated assuming a power-law spectral index (see Sect. 4). | Id. |
| [mJy] | [mJy] | ||||||
| [1] | 1 Apr 2009 | XMM / VLT | m () | … | A | ||
| [1] | 3 Apr 2009 | XMM / VLT | m () | … | B | ||
| [2,3] | 4 Apr 2007 | XMM / VLT | m () | … | C | ||
| [2,4] | 4 Apr 2007 | XMM / HST | m | D | |||
| [2,4] | 4 Apr 2007 | XMM / HST | m | E | |||
| [2,4] | 2 Apr 2007 | XMM / HST | m | F | |||
| [5,6] | 31 Aug 2004 | XMM / HST | m | G | |||
| [7] | 31 Jul 2005 | Chandra / Keck | m () | … | H | ||
| [7] | 17 Jul 2006 | Chandra / Keck | m () | … | I | ||
| [8] | 30 Jun 2005 | Chandra / VLT | m () | J | |||
| [9] | 7 Jul 2005 | Chandra / VLT | m () | K | |||
| [10] | 19 Jun 2003 | Chandra / VLT | m () | L |
3.2 X-rays
No prominent X-ray flare ( times the quiescent level) was detected in April 2009. We concentrate, hereafter, on the significant peaks (3) of the X-ray light curves detected in parallel to the NIR flares mentioned above.
Flare A coincided with a very little increase of the XMM-Newton/EPIC cameras count rate (see Fig. 3, top and middle panels). Though barely significant (3.5), this could be the X-ray counterpart to Flare A and thus would be the faintest X-ray flare so far identified with XMM-Newton, all previous ones being, at least, a factor 2 brighter (Goldwurm et al., 2003; Porquet et al., 2003; Bélanger et al., 2005; Porquet et al., 2008). When considering the overall flare, the X-ray excess occurs in the middle of the NIR flare, which is consistent with the flares that have been entirely covered in NIR and X-rays over the past (Eckart et al., 2006a, 2008a; Dodds-Eden et al., 2009). In view of the low statistics of this X-ray signal, we cannot extract proper spectral information. Assuming a typical photon spectral index, (with ph s-1 cm-2 keV-1), and a typical column density, cm-2, we estimate through WebPIMMS that Flare A reached an unabsorbed, background subtracted666An average level of quiescent count rate including the constant contibution of neighboring sources (§ 2.1), was removed as in Goldwurm et al. (2003)., flux of erg s-1 cm-2 in the 2–10 keV band. This translates to a peak luminosity of erg s-1 at 8 kpc, i.e. 7 times the quiscent level ( erg s-1, Baganoff et al., 2003). This very low significance X-ray flare associated with a relatively bright NIR flare is quite surprising in regard to the bright X-ray flare (100 the quiescence, Porquet et al., 2008) detected simultaneously to a strong NIR flare (30 mJy) in April 2007 (Dodds-Eden et al., 2009). It is however somewhat reminescent of the X-ray non-detection by the Chandra observatory of a 15 mJy flare observed in July 2005 by Hornstein et al. (2007). Yet, we stress that the point spread functions (PSFs) and spectral responses of the Chandra/ACIS and XMM-Newton/EPIC instruments differ, which prevents straightforward comparisons. Actually, the fact that the EPIC’s PSF is broader than ACIS’s makes the XMM-Newton satellite less sensitive than Chandra to soft () and faint X-ray flares. The background subtracted peak XMM-Newton count rate of Flare A converts, indeed, to a Chandra/ACIS-I rate of 0.034 counts s-1 in the 2–8 keV band. This would have lead to a clear Chandra detection, even more significant than two other faint X-ray/NIR flares observed with Chandra by Eckart et al. (2004, 2008a).
Flare B, on the other hand, was more significantly detected by XMM-Newton and observed to last longer (40 min), in sync with the NIR light curve (see Fig. 4, top and middle panels). Using the same method as above, we estimate its background subtracted and unabsorbed peak flux is erg s-1 cm-2 in the 2–10 keV band, i.e. erg s-1 (10 the quiescence). Note that, with Chandra, it would have been detected at a rate of 0.049 counts s-1 (2–8 keV), which is still faint compared to the other X-ray flares with a NIR counterpart known as we discuss below. The fact that the NIR flux was relatively high about 100 min before Flare B with no simultaneous detectable X-ray emission is striking and could be another example of a “NIR only flare” (Hornstein et al., 2007) or indicate that NIR flares can start earlier than the X-ray ones (Dodds-Eden et al., 2009).
Comparing Flare A and B, it is manifest that the ratio of the peak NIR flux over the peak X-ray flux is highly variable from one flare to another. It is known that the NIR flares occurence rate is higher than the X-ray one, so it was expected that there should exist NIR flares with very little or even no detectable X-ray emission. But a somewhat counterintuitive fact that emerges now is that the brightest NIR flares are not necessarily accompanied by bright X-ray flares. Indications of that result had been obtained with the analysis of the July 2005 and July 2006 flares in Hornstein et al. (2007), although the peak NIR flux of the July 2005 event was missed. Similarly, Yusef-Zadeh et al. (2009) showed in their Fig. 21 (a) and (b), with a consistent XMM-Newton/HST dataset, that the NIR to X-ray ratio fluctuates.
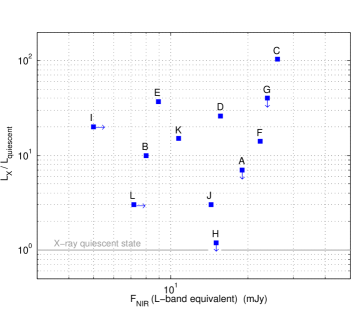
To allow better comparisons between flares concurrently observed in X-rays and NIR, and visualize their disparities, we give an inventory of all the results published thus far in Tab. 2 and plot the X-ray peak fluxes Vs. peak NIR fluxes in Fig. 6. Despite a relatively easy comparison between the measurements conducted by XMM-Newton and Chandra, NIR comparisons between various authors are more difficult because of different observational setups and flux corrections (e.g., background removal, extinction correction). Flares A, B, C (Tab. 2) are still easy to compare, since they were observed by the same instruments in the same pass-bands, at roughly the same epoch. Flares H and I can also be added to this group, provided a background correction is applied and consistent extinctions employed777We used a background of 3.6 mJy as given in caption of Fig. 5 and converted the extinctions quoted in caption of Tab. 1 (Hornstein et al., 2007).. Finally, peak NIR flux of the remaining seven flares (D, E, F, G, J, K, L) need to be extrapolated to the -band, assuming a particular infrared spectral index (see Sect. 4), to ensure consistency with the other flares.
As shown in Fig. 6, no particular correlation between the X-ray and NIR strengths is apparent with the currently attainable statistics. Though the logarithmic scales of the plot axes do not reveal it, Flare C really stands out of the group as a strong event in both X-rays and NIR.
3.3 Sub-mm
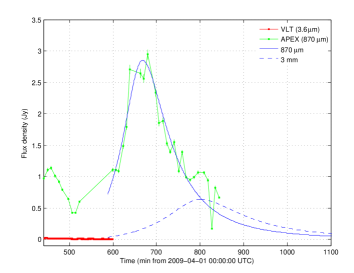
On April 1st 2009, sub-mm observations overlapped with the NIR and X-ray coverages (Fig. 3). Sgr A⋆ is found to be continuously variable at 870 m, though on a longer time scale than at shorter wavelengths888Analogous variability, on timescales ranging from hours to days, was also reported at wavelengths longward of 1 mm (see e.g., Wright & Backer, 1993; Bower et al., 2002; Zhao et al., 2003; Herrnstein et al., 2004; Miyazaki et al., 2004; Mauerhan et al., 2005; Yusef-Zadeh et al., 2007).. We first note that there are no abrupt changes in the APEX light curve at the time the VLT detects the rise of Flare A. This means that a simultaneous sub-mm counterpart to this NIR flare is not detected as such, and corroborates similar past non-detections (Marrone et al., 2008; Yusef-Zadeh et al., 2008; Eckart et al., 2008b).
6794 min after 2009–04–01 00:00:00 (UTC), the sub-mm flux of Sgr A⋆ peaked at 5.40.2 Jy, and marks the summit of a dramatic sub-mm flare, among the brightest ever detected, that lasted for 150 min and that we will refer to as Flare A’. When we subtract the background emission (taken as the minimum flux of the observation, 2.2 Jy), the peak is reduced to 3.20.2 mJy. The rise time of Flare A’ is on the order of 20 min, which limits the size of the sub-mm flaring region to only 30 with the same argument as the one used in § 3.1. Yet, this size constraint will probably be revised soon when Very Long Baseline Interferometry (VLBI) measurements is achieved in the sub-mm range. Recent size measurements at 1.3 mm have indeed already yielded an intriguing upper limit to the quiescent size of Sgr A⋆ of as (Doeleman et al., 2008).
Interestingly, Flare A’ lags Flare A by 200 min and is not associated with any other flaring episode, at least as far as we can tell from the X-ray light curve. As summarized in Tab. 3, this new flare detected with high confidence adds to a handful of past detections (sometimes yet debatable) of short mm/sub-mm activity in the aftermath of X-ray and/or NIR flares. One way often proposed to relate these phenomena is that X-ray/NIR flares are associated with a plasmoid expansion radiating via synchrotron emission (van der Laan, 1966, see Paragraph 5.1). If this plasmoid is also responsible for the production of X-rays through SSC emission, then as pointed out by Marrone et al. (2008), there is a tight relation connecting the time lag between the X-ray/NIR peak fluxes (, ) and the peak flux at a smaller frequency . This lag is given by:
| (1) |
where is the inital magnetic field, the spectral index of the radiating particles (), and is a parameter depicting the speed at which the radius of the plasmoid grows (). So far, only three flares were fully covered by contemporaneous X-ray, NIR, and sub-mm observations and allow for a test of this relation: Flares A, H, and I. The comparison between H and I was done by Marrone et al. (2008), who showed a consistency between the data and the plasmoid/SSC picture. Yet, when considering Flare A/A’, this tendency of “the higher the ratio , the longer the delay” no longer holds. Indeed, Flare I has a ratio about 10 times the ratio of Flare A, and still presents a delay about twice shorter. This tends to indicate that X-ray/NIR flare and sub-mm flare emissions may not originate from the same particles (see also § 5.1).
Regarding the other two APEX observing runs of April 2009, no sub-mm flares were detected, notwithstanding an obvious flux decrease observed during the last run. The minimum flux reached was 2.2 Jy, justifying our previous choice for the steady quiescent background level.
| References 999References: [1] This work, [2] Marrone et al. (2008), [3] Yusef-Zadeh et al. (2008), [4] Yusef-Zadeh et al. (2009), [5] Eckart et al. (2008b), [6] Eckart et al. (2006a), [7] Eckart et al. (2009), [8] Yusef-Zadeh et al. (2006a). | Date | Instruments | Time lag 101010Time by which the sub-mm peak lags the X-ray or NIR peak. |
|---|---|---|---|
| [min] | |||
| [1] | 1 Apr 2009 | APEX (870 m) | 200 |
| [2,3,4] | 17 Jul 2006 | SMA (1.3 mm) / CSO (850 m) | 100 |
| [2] | 31 Jul 2005 | SMA (1.3 mm) | 20 |
| [5] | 3 Jun 2008 | APEX (870 m) | 90 |
| [6,7] | 7 Jul 2004 | SMA (890 m) | |
| [4] | 5 Apr 2007 | SMA (1.3 mm) | 160 |
| [8] | 3 Sep 2004 | CSO (850 m) | 160 |
3.4 GeV -rays
The Fermi light curves in the top panels of Fig. 3, 4, and 5, are characterized by frequent data gaps on the order of 2 hr during which the GC is outside of the LAT’s FOV. The statistics within each bin is remarkably poor; many 10 min bins do not contain any photon at all. No significant peak in the light curves is detected.
Though Flare A and most of Flare A’ fell outside the coverage of the GC by the LAT, the rising flank of Flare B was coincident with the end of a LAT exposure. Zero photons were detected in the time bin at the peak of Flare B. Given the Poissonian statistics, the 3 (99.87% confidence level) upper limit on the count rate of any source in the extraction region is 6.6 photons (Gehrels, 1986) for the bin considered, which has an exposure of s-1 cm-2. This converts to a flux upper limit for Flare B of ph s-1 cm-2, or erg s-1 cm-2, and a luminosity upper limit of erg s-1 (0.1–200 GeV) at 8 kpc.
This is not very constraining in regards of the flux quoted for the GC Fermi central point source, 1FGL J1745.6–2900, in the 1st year catalogue111111 These measurements were obtained with a modeling of the underlying diffuse emission. A variability index of 18 was measured taking 11 time segments into account and implies that 1FGL J1745.6–2900 is non-variable on a monthly timescale. (Abdo et al., 2010): ph s-1 cm-2 (0.1–100 GeV) for a photon spectral index of 2.2. Fermi thus confirms the presence of a GeV source in the GC, as once detected by the Energetic Gamma-Ray ExperimenT (EGRET) onboard the Compton Gamma-ray Observatory (Mayer-Hasselwander et al., 1998). The origin of 1FGL J1745.6–2900 is unknown. It is quite possible that this GeV emission is produced in GC molecular clouds just as the TeV emission of the same region (Ballantyne et al., 2007; Melia & Fatuzzo, 2010). But Sgr A⋆ itself is also of course a valid candidate, given the positional coincidence of the LAT source and the supermassive black hole: 1FGL J1745.6–2900 lies at the galactic coordinates [∘, ∘] with a 95% confidence radius of , which is only away from Sgr A⋆. One way to unambiguously attribute this source to the supermassive black hole could have been the detection of a flaring activity correlated with the X-ray one. However, we did not detect any GeV signal with the sensitivity we achieved during Flare B (which limited our detection capability to large GeV flares of amplitude at least 65 times the steady flux of 1FGL J1745.6–2900). The present study is hence analogous to the unfruitful previous attempts to discover correlated emission between the X-ray flares of Sgr A⋆ and the flux of the -ray sources IGR J17456–2901 and HESS J1745–290 (see Trap et al., 2010; Aharonian et al., 2008, for the INTEGRAL and HESS non-detections, respectively).
4 NIR colors of Sgr A⋆
| References 121212References: [1] This work, [2] Hornstein et al. (2007), [3] Yusef-Zadeh et al. (2009), [4] Dodds-Eden et al. (2009), [5] Trap et al. (2010), [6] Krabbe et al. (2006), [7] Gillessen et al. (2006), [8] Eisenhauer et al. (2005), [9] Ghez et al. (2005). | Dates | Instruments | Bands | 131313 is defined by . † indicates when there is a correlation observed between the flux and the spectral index. In the case of Yusef-Zadeh et al. (2009), only the brightest flares are reported. |
| [1] | 3 Apr 2009 | VLT / NACO | 2.1, 3.8 m | |
| [2] | 16, 31 Jul 2005, 2 May, 17 Jul 2006 | Keck / NIRC2 | 1.6, 2.1, 3.8, 4.7 m | |
| [3] | 2, 5 Apr 2007 | HST / NICMOS | 1.45, 1.7 m | , † |
| [4,5] | 4 Apr 2007 | VLT / NACO, VISIR | 3.8, 11.8 m | |
| [6] | 29 Apr 2005 | Keck / OSIRIS | 2.02–2.38 m | |
| [7] | 18 Jun 2005 | VLT / SINFONI | 2–2.45 m | (0.6–† |
| [8] | 15, 17 Jul 2004 | VLT / SINFONI | 1.7–2.45 m | |
| [9] | 26 Jul 2004 | Keck / NIRC2 | 2.1, 3.8 m |
Here we describe the results of the spectral imaging of Sgr A⋆ we made during the 2nd night of VLT/NACO observations.
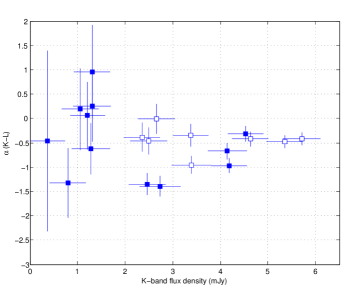
To compute the NIR photon spectral index , defined by , we produced the - and -band light curves of Sgr A⋆ presented in Fig. 7 (top panel), for which we averaged the pairs of images taken at each filter switch. The error bars incorporate the standard deviation of these values as well as the error determined from the standard deviation of a comparison star of similar flux. Data points were interpolated to the same times and a large aperture was used in both bands to fully include the contribution of S 17. A global background correction (including S 17) was made by subtracting the lowest flux value. It is important to note that is highly dependent on the excess color , since:
| (2) |
where are the reddened fluxes. Using known early-type stars141414We used S 2, S 65, S 66, S 72, and S 87 which have magnitudes between 13.5–14.6 mag and are spectroscopically identified to have spectral types between O9–B2 (Eisenhauer et al., 2005). in the vicinity of Sgr A⋆, we determined an average color excess (see e.g. Hornstein et al., 2007). The corresponding values of are plotted in Fig. 7 (bottom panel) as a function of the -band flux. Given the statistics of the data, no particular correlation between and the flux is found. The mean value obtained over the duration of Flare B is .
For comparison, we list in Tab. 4 all the previous attempts to measure the spectral indices of flares from Sgr A⋆. The different values of thus obtained are however difficult to compare, since each of these works either probed different spectral ranges/flux amplitudes/epochs or used different instruments/techniques/reddening laws/backgrounds. Owing to the experimental setup used in this study, our result can only be easily compared to the work of Hornstein et al. (2007). Likewise, these authors made use of a ground telescope with adaptive optics and the filter cycling technique, though they also accumulated data in the - and -bands, and used Keck’s laser guide star. They found a constant “universal” value for the index of several flares, no matter the instantaneous flux, of , which is fully consistent with our result. Such a stable index seems to support a sort of a IR “quiescence” on average even though this is debated (Dodds-Eden et al., 2010a).
It seems that all the values for recently obtained suggest , which translates to (with ), thus justifying that “infrared flares are blue” and arise from a particle population distinct from the one producing the quiescent “sub-mm bump” (Dodds-Eden et al., 2009; Trap et al., 2010). Presuming a synchrotron origin for the NIR flares and the radiating electrons distributed in a power-law of index (), this suggests that , which has important implications for the fit of flare spectra and in particular the SSC components (see Paragraph 5.2).
5 Discussion
Below, we discuss a simple modeling of Flare A/A’ light curves and SED based on the expansion of a plasmoid releasing synchrotron and SSC radiation. Flare B SED is then analyzed in the context of different non-thermal emission processes. Models for SEDs are essentially static and only meant to show in which direction our data may constrain the theory of Sgr A⋆’s flares. Evolutionary effects and the physical conditions leading to such scenarios will have to be studied in more details in future works.
5.1 Plasmoid expansion
Over the past years, several authors have employed the adiabatic expansion of a plasmoid (van der Laan, 1966) in the context of cm to sub-mm variability of Sgr A⋆, often observed to follow X-ray/NIR flares (e.g., Yusef-Zadeh et al., 2006b; Eckart et al., 2006a, and the references listed in Tab. 3). The use of this expansion model for the flares of Sgr A⋆ is motivated by:
-
•
the timelags separating X-ray/NIR flares from sub-mm flares (Tab. 3);
- •
-
•
the timelags between different radio bands within the same flare (Yusef-Zadeh et al., 2006b)151515Detailed models of these observations seem to exclude the simplest expansion scenario though, because the observed sizes of the radio emitting regions are bigger than van der Laan predicted sizes (Falcke et al., 2009; Maitra et al., 2009).;
-
•
the increase of linear polarization as sub-mm flares reach their maximum (Marrone et al., 2008);
-
•
the similarity between the flare timescales in X-ray/NIR and mm/sub-mm, which suggests that energy losses are not dominated by radiative cooling, with expansion a good alternative candidate161616Radiative cooling effects may however also affect the expansion model in the mm range (Li et al., 2009)..
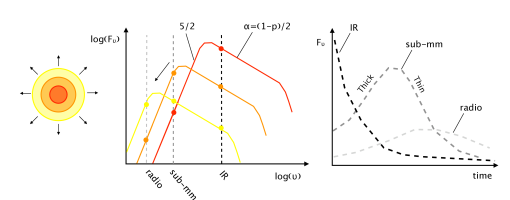
Fig. 8 captures the essence of the model and gives the respective initial positions in the spectral domain of the wavebands used in this work. A ball of plasma of initial radius , is filled with relavistic electrons of uniform volumic number density , arranged in a power-law (, ). This plasmon is pervaded by a magnetic field, , and yields an initial synchrotron spectrum made of two connected power-laws (Fig. 8, middle panel, red curve). Below the initial synchrotron self-absorption (SSA) frequency (, Gould, 1979) at which the flux attains its maximal value, , the spectrum is optically thick (). For , the spectrum is optically thin () and breaks exponentially at a frequency proportional to . The dependence of the flux, , on the radius, , is given by:
| (3) |
where the optical depth, , obeys the equation:
| (4) |
and where the optical depth at is set by the condition that be maximal , or:
| (5) |
In the following, we adopt a constant velocity, , for the expansion so that:
| (6) |
To test this model with our multi-wavelength data of April 1, we propose two phenomenological scenarios (I and II) with different sets of values for the parameters (, , , , , , see Tab. 5). To assess the viability of these models not only with the light curves but also spectrally, we calculate the plasmoid initial synchrotron spectra with particular values of , , , and , and also consider the naturally associated SSC emission, using the formalism of Krawczynski et al. (2004)171717In the progress of this work, we found a problem in the treatment of the SSA in H. Krawczynski’s code, which derived from a typo in the numerical expression in SI units of the absorption coefficient given by Longair (1994), that should be written: .. In all cases, the NIR emission is assumed to be optically thin, and so (Fig. 8, middle panel). The NIR counterpart of Sgr A⋆ is indeed known to be highly linearly polarized (Eckart et al., 2006b; Meyer et al., 2006a, b, 2007; Trippe et al., 2007) and, if it was optically thick, then an expansion model would anyhow predict a sub-mm peak flux lower than the NIR one (Fig. 8, right panel), which is inconsistent with the observations.
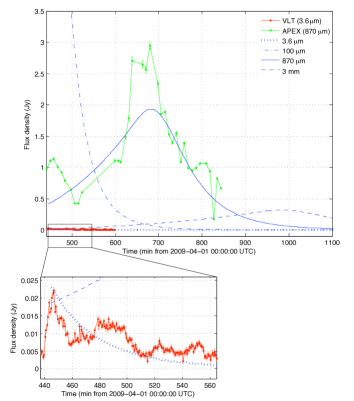
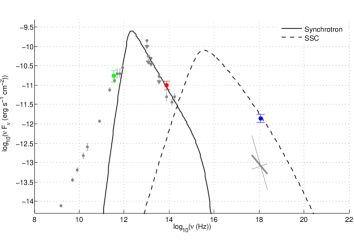
Model I. The scenario that requires the least number of ingredients to accomodate the NIR, sub-mm, and X-ray light data all at once, is a plasmon initially producing the NIR and X-ray flare by synchrotron and SSC, respectively. As it then expands, the NIR/X-ray flare decays and the sub-mm flare arises. Given the great difference between the NIR and sub-mm fluxes, this model demands an extremely steep power-law distribution () and a high maximum flux ( Jy) at the SSA turnover. We choose the different parameters so as to respect the flare size constraint () and the essential idea of the van der Laan (1966) model (, where , is the gyration frequency, and is the mass of the electron). Fig. 9 (top and middle panels) shows that the overall NIR/sub-mm timescales and flux characteristics of Flare A/A’ can be roughly reproduced (predictions at 100 m and 3 mm are also plotted), and Fig. 9 (bottom panel) that the observed initial SED constraints can be met. However, the initial steep NIR spectrum contradicts the measurements of made with Flare B for example and exceeds the mid-infrared (MIR) upper limit obtained with VLT/VISIR during the April 2007 campaign (Trap et al., 2010) by a factor 4. We therefore disfavor model I, although we cannot categorically exclude it given our lack of infrared spectral information on Flare A.
Model II. We now assume that Flare A and A’ are not directly connected by the same synchrotron power-law, and that Flare A simply acts as a trigger for a plasmoid expansion that will in term give rise to Flare A’. The plasmon power-law index can thus be chosen less steep () and the couple of parameters (, ) so that the initial plasmoid spectrum breaks in the far-infrared (FIR). It thus gives no significant synchrotron emission in the NIR and X-ray bands, and the same holds for the SSC radiation. Yet, if the expansion starts at the beginning of the NIR flare, the relatively long time interval until the maximum of the sub-mm flare makes it difficult to obtain a narrow peak in the light curve at 870 m. Therefore, we allow the time at which the expansion is initiated to be postponed by 140 min, which gives an excellent fit to the APEX light curve (Fig. 10). This is our favored model and it could be tested with radio millimeter data, since it predicts a distinctive 3 mm flare peaking at 0.6 Jy around 350 min after the onset of the NIR/X-ray flare. We stress that, though ad hoc at this stage, this delayed expansion can be physically motivated in a “coronal mass ejection” picture by the fact that it would take the accelerated particles 200 min to be advected out of the inner parts of the accretion flow, where the high viscosity would prevent an immediate adiabatic expansion (see Dodds-Eden et al., 2010b).
In all the above cases, we always used . But, as formulae 3 and 4 only involve the ratio , we would have obtained the exact same sub-mm light curves by multiplying by any factor , provided the velocity quoted in Tab. 5 was multiplied by the same . Since is an upper limit on the size of the flaring region, we find that the maximum expansion speed required is 0.05 , which is consistent with the other sub-relativistic expansions found previously (Yusef-Zadeh et al., 2008; Eckart et al., 2008b, 2009). This means, incidentally, that the plasmoid cannot escape the gravitational potential well of the black hole, unless it has a relativistic bulk motion, inside of a jet for example (Falcke et al., 2009; Maitra et al., 2009).
The modeling we present here compares well with previous works involving similar spectral windows (Eckart et al., 2008b, 2009), although we used only one plasmon compared to the multi-component models needed in these works. Nevertheless, our main result is that the simplest form of an abiabatic expansion scenario (model I) is inadequate to reproduce all our NIR/sub-mm/X-ray data at once, so that we favor expansion models in which NIR/X-ray flares are not initiated by the particles of the plasmon creating the sub-mm flare. This is in contrast with the study of Eckart et al. (2008b), in which models analogous to model I are generally favored. We note in particular that “model BI” of Eckart et al. (2008b) violates MIR upper limits on Sgr A⋆, and so does “model AB” in Eckart et al. (2009), in spite of the NIR exponential break invoked to avoid the over-production of NIR flux.
We note also that a similar conclusion, disconnecting the NIR and radio portions of the spectrum in the frame of the van der Laan (1966) model, was reached by Mirabel et al. (1998) in the study of discrete ejections from the microquasar GRS 1915+105.
Expansion models for the sub-mm flares of Sgr A⋆ should have two major telltale signatures: spectral indices in the sub-mm/mm range indicating an evolution from a thick to thin regime over the course of a flare, and high fluxes in the FIR (100–300 m, Fig. 9, top panel). The upcoming observations of the Galactic nucleus with Herschel and the Stratospheric Observatory for Infrared Astronomy (SOFIA) will perhaps allow the testing of these predictions.
| Flare A | Flare B | ||||
|---|---|---|---|---|---|
| Parameters | Model I | Model II | SSC1 | SSC2 | SB |
| 5 | 2 | 2 | 2.4 | 2.4–3.4 | |
| () | 1 | 1 | 1 | 1 | 1 |
| (Hz) | — | — | — | ||
| (Jy) | 22 | 17 | — | — | — |
| () | 0.0017 | 0.005 | — | — | — |
| (min) | 445 | 588 | — | — | — |
| 20 | 1 | 1 | 1 | 1 | |
| 100 | |||||
| (G) | 90 | 100 | 2 | 5 | 21 |
| (cm-3) | |||||
5.2 SED modeling
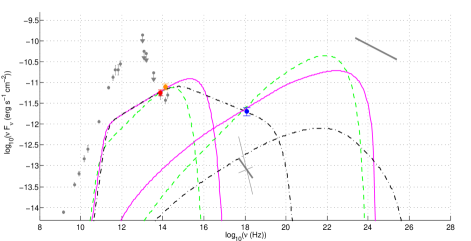
Though sub-mm and NIR flares may be unrelated, NIR and X-ray flares clearly derive from the same radiating particles given their simultaneity. Past theories of Sgr A⋆ flares usually invoked a combination of synchrotron and inverse Compton mechanisms (Markoff et al., 2001, 2007; Liu & Melia, 2002; Liu et al., 2004, 2006a, 2006b; Yuan et al., 2003, 2004). We analyze here synchrotron and SSC emission for Flare B, for which we have NIR spectral information. This imposes a relatively hard electron spectrum (, see Sect. 4) contrary to model I for Flare A, which had a softer spectrum () as required by the expansion scenario. Since we do not have spectral information in X-rays, we propose three possible models (see Tab. 5 and Fig. 11) to represent the SED of this flare, each having an X-ray slope either hard (SSC1), intermediate hard (SSC2), or soft (SB). In all three, the NIR flare is due to synchrotron emission. For SSC1 and SSC2, the X-ray flare results from SSC emission, which is the most commonly used configuration in the literature. Nonetheless, if the X-ray slope is soft, as for Flare #2 in Porquet et al. (2008), then the SSC modeling is no longer valid, since it requires an enormous magnetic field strength of order 1000 G (Dodds-Eden et al., 2009; Trap et al., 2010). In this case, a broadband synchrotron spectrum with a break (SB) due to radiative cooling could give rise to a soft X-ray flare (see Dodds-Eden et al., 2009, 2010b; Trap et al., 2010).
We note in Fig. 11 that these flare spectra are all well below the 1–100 GeV spectrum of 1FGL J1745.6–2900, which is consistent with the non-detection reported in § 3.4. In the progress of this work, we noticed a paper by Kusunose & Takahara (2010) modeling the time evolution of purely synchrotron (SB) scenarios for X-ray/NIR flares of Sgr A⋆. They predicted possible SSC counterparts observable with Fermi in a specific class of models, where the ratio of magnetic energy over particle energy is small. We have shown here that there was no detectable GeV excess during Flare B but, we stress that given our low statistics, we could only constrain a putative GeV flare to a flux smaller than a few times erg s-1 cm-2, whereas their “model C” induced a flux of only erg s-1 cm-2 at maximum. Except for an extraordinarily bright event, it is very likely that such models will not be testable with Fermi data.
6 Conclusions
Only a handful of flaring events have been observed simultaneously accross a broad range of wavelengths up to now. Here, we have reported the detection of two new X-ray/NIR flares, a strong sub-mm outburst possibly associated with one of them, and their GeV -ray non-detection. These data allowed us to further characterize Sgr A⋆’s variability and test non-thermal radiative mechanisms usually employed to describe the physics of the flares.
One flare was followed at the VLT in two NIR spectral bands, thus demonstrating the feasibility of a filter switching technique to measure the color of Sgr A⋆ with NACO. The resulting spectrum is found to be consistent with a power-law of index (), which is a “blue” spectrum ( with ), implying that NIR flares arise from a particle population different from the one responsible for the quiescent sub-mm bump. For this flare, we could also check that there was no detectable in sync variation of the GeV -ray GC source. The other NIR/X-ray flare was followed by a strong sub-mm flare, and was used to test the adiabatic expansion model which is often used to account for the longer wavelength flare delays. In this context, we find it difficult to relate the NIR and sub-mm events by the same single synchrotron plasmoid, as it would induce a too steep infrared spectrum in regards of other flares. Even assuming the NIR/X-ray event just acted as a trigger for the plasmon expansion, the long delay observed between the NIR/X-ray and sub-mm peaks spreads the theoretical light curve of the sub-mm flare too much to reproduce the data. However, we suggest an expanding plasmon could still drive the sub-mm flare light curve provided it started expanding about a couple of hours after the X-ray/NIR event. These models can all be tested by radio observations obtained in April 2009 and predict a significant flux in the FIR that could be observed by the Herschel and SOFIA observatories in the near future. Hopefully, the source expansion scenario will also soon be put to test by VLBI direct size measurements in the sub-mm range (Doeleman et al., 2009). These studies of Sgr A⋆’s present variability and the ones pursuing giant outbursts experienced by Sgr A⋆ in a recent past (Terrier et al., 2010; Ponti et al., 2010), should thus gradually bring an overall characterization of our Galactic nucleus’ activity and help us put it into the general perspective of AGNs.
Acknowledgements.
GT and KDE warmly thank C. Lidman and G. Carraro for assistance with the NIR observations at Paranal, and the observers at the Chajnantor site (C. De Breuck, A. Lundgren, M. Dumke) for their efforts in planning and making the APEX obs. GT is also grateful to V. Reveret, F. Mattana, M. Sakano, and D. Marrone for enlightening discussions. This work has been partly supported by the french Agence Nationale pour la Recherche through grant ANR–06–JC–0047. GP acknowledges support via an EU Marie Curie Intra-European Fellowship under contract FP7–PEOPLE–2009–IEF–254279. The XMM-Newton project is an ESA Science Mission with instruments and contributions directly funded by ESA Member States and the USA (NASA). Parts of this study are based on observations made with ESO Telescopes at Paranal and Chajnantor Observatories under the programs LP 183.B-0100 and 69.A-0123.References
- Abdo et al. (2010) Abdo, A. A., Ackermann, M., Ajello, M., et al. 2010, ApJ Submitted
- Aharonian et al. (2004) Aharonian, F., Akhperjanian, A. G., Aye, K.-M., et al. 2004, A&A, 425, L13
- Aharonian et al. (2008) Aharonian, F., Akhperjanian, A. G., Barres de Almeida, U., et al. 2008, A&A, 492, L25
- Atwood et al. (2009) Atwood, W. B., Abdo, A. A., Ackermann, M., et al. 2009, ApJ, 697, 1071
- Baganoff et al. (2003) Baganoff, F., Maeda, Y., Morris, M., et al. 2003, ApJ 591, 891
- Baganoff et al. (2001) Baganoff, F. K., Bautz, M. W., Brandt, W. N., et al. 2001, Nature, 413, 45
- Balick & Brown (1974) Balick, B. & Brown, R. 1974, ApJ, 194, 265
- Ballantyne et al. (2007) Ballantyne, D. R., Melia, F., Liu, S., & Crocker, R. M. 2007, ApJ, 657, L13
- Bélanger et al. (2004) Bélanger, G., Goldwurm, A., Goldoni, P., et al. 2004, ApJ, 601, L163
- Bélanger et al. (2005) Bélanger, G., Goldwurm, A., Melia, F., et al. 2005, ApJ, 635, 1095
- Bower et al. (2002) Bower, G. C., Falcke, H., Sault, R. J., & Backer, D. C. 2002, ApJ, 571, 843
- Dodds-Eden et al. (2010a) Dodds-Eden, K., Gillessen, S., Fritz, T. K., et al. 2010a, ArXiv:1008.1984
- Dodds-Eden et al. (2009) Dodds-Eden, K., Porquet, D., Trap, G., et al. 2009, ApJ, 698, 676
- Dodds-Eden et al. (2010b) Dodds-Eden, K., Sharma, P., Quataert, E., et al. 2010b, ArXiv:1005.0389
- Doeleman et al. (2009) Doeleman, S. S., Fish, V. L., Broderick, A. E., Loeb, A., & Rogers, A. E. E. 2009, ApJ, 695, 59
- Doeleman et al. (2008) Doeleman, S. S., Weintroub, J., Rogers, A. E. E., et al. 2008, Nature, 455, 78
- Eckart et al. (2004) Eckart, A., Baganoff, F. K., Morris, M., et al. 2004, A&A, 427, 1
- Eckart et al. (2009) Eckart, A., Baganoff, F. K., Morris, M. R., et al. 2009, A&A, 500, 935
- Eckart et al. (2006a) Eckart, A., Baganoff, F. K., Schödel, R., et al. 2006a, A&A, 450, 535
- Eckart et al. (2008a) Eckart, A., Baganoff, F. K., Zamaninasab, M., et al. 2008a, A&A, 479, 625
- Eckart et al. (2008b) Eckart, A., Schödel, R., García-Marín, M., et al. 2008b, A&A, 492, 337
- Eckart et al. (2006b) Eckart, A., Schödel, R., Meyer, L., et al. 2006b, A&A, 455, 1
- Eisenhauer et al. (2005) Eisenhauer, F., Genzel, R., Alexander, T., et al. 2005, ApJ, 628, 246
- Falcke et al. (2009) Falcke, H., Markoff, S., & Bower, G. C. 2009, A&A, 496, 77
- Gehrels (1986) Gehrels, N. 1986, ApJ, 303, 336
- Genzel et al. (2003) Genzel, R., Schödel, R., Ott, T., et al. 2003, Nature, 425, 934
- Ghez et al. (2004) Ghez, A., Wright, S., Matthews, K., et al. 2004, ApJ, 601, L159
- Ghez et al. (2005) Ghez, A. M., Hornstein, S. D., Lu, J. R., et al. 2005, ApJ, 635, 1087
- Ghez et al. (2008) Ghez, A. M., Salim, S., Weinberg, N. N., et al. 2008, ApJ, 689, 1044
- Gillessen et al. (2006) Gillessen, S., Eisenhauer, F., Quataert, E., et al. 2006, ApJ, 640, L163
- Gillessen et al. (2009) Gillessen, S., Eisenhauer, F., Trippe, S., et al. 2009, ApJ, 692, 1075
- Goldwurm et al. (2003) Goldwurm, A., Brion, E., Goldoni, P., et al. 2003, ApJ, 584, 751
- Gould (1979) Gould, R. J. 1979, A&A, 76, 306
- Güsten et al. (2006) Güsten, R., Nyman, L. Å., Schilke, P., et al. 2006, A&A, 454, L13
- Herrnstein et al. (2004) Herrnstein, R. M., Zhao, J.-H., Bower, G. C., & Goss, W. M. 2004, AJ, 127, 3399
- Hornstein et al. (2007) Hornstein, S. D., Matthews, K., Ghez, A. M., et al. 2007, ApJ, 667, 900
- Jansen et al. (2001) Jansen, F., Lumb, D., Altieri, B., et al. 2001, A&A, 365, L1
- Kirsch (2005) Kirsch, M. 2005, XMM-SOC-CAL-TN-0018: EPIC Status of Calibration and Data Analysis, Tech. rep., XMM-Newton Science Operations Centre
- Krabbe et al. (2006) Krabbe, A., Iserlohe, C., Larkin, J. E., et al. 2006, ApJ, 642, L145
- Krawczynski et al. (2004) Krawczynski, H., Hughes, S. B., Horan, D., et al. 2004, ApJ, 601, 151
- Kunneriath et al. (2008) Kunneriath, D., Eckart, A., Vogel, S., et al. 2008, Journal of Physics Conference Series, 131, 012006
- Kusunose & Takahara (2010) Kusunose, M. & Takahara, F. 2010, ArXiv:1011.1712
- Lenzen et al. (2003) Lenzen, R., Hartung, M., Brandner, W., et al. 2003, in Society of Photo-Optical Instrumentation Engineers (SPIE) Conference Series, ed. M. Iye & A. F. M. Moorwood, Vol. 4841, 944–952
- Li et al. (2009) Li, J., Shen, Z., Miyazaki, A., et al. 2009, ApJ, 700, 417
- Liu & Melia (2002) Liu, S. & Melia, F. 2002, ApJ, 566, 77
- Liu et al. (2006a) Liu, S., Melia, F., & Petrosian, V. 2006a, ApJ, 636, 798
- Liu et al. (2004) Liu, S., Petrosian, V., & Melia, F. 2004, ApJ, 611, L101
- Liu et al. (2006b) Liu, S., Petrosian, V., Melia, F., & Fryer, C. L. 2006b, ApJ, 648, 1020
- Longair (1994) Longair, M. S. 1994, High energy astrophysics. Volume 2. Stars, the Galaxy and the interstellar medium. No. ISBN 0-521-43439-4 (Cambridge, UK: Cambridge University Press)
- Maitra et al. (2009) Maitra, D., Markoff, S., & Falcke, H. 2009, A&A, 508, L13
- Markoff et al. (2007) Markoff, S., Bower, G. C., & Falcke, H. 2007, MNRAS, 379, 1519
- Markoff et al. (2001) Markoff, S., Falcke, H., Yuan, F., & Biermann, P. 2001, A&A, 379, L13
- Marrone et al. (2008) Marrone, D. P., Baganoff, F. K., Morris, M. R., et al. 2008, ApJ, 682, 373
- Mauerhan et al. (2005) Mauerhan, J. C., Morris, M., Walter, F., & Baganoff, F. K. 2005, ApJ, 623, L25
- Mayer-Hasselwander et al. (1998) Mayer-Hasselwander, H., Bertsch, D., Dingus, B., et al. 1998, A&A, 335, 161
- Melia (2007) Melia, F. 2007, The Galactic Supermassive Black Hole No. ISBN-13: 978-0691131290 (41 William Street, Princeton, New Jersey 08540: Princeton University Press)
- Melia & Fatuzzo (2010) Melia, F. & Fatuzzo, M. 2010, MNRAS, L172
- Meyer et al. (2006a) Meyer, L., Eckart, A., Schödel, R., et al. 2006a, A&A, 460, 15
- Meyer et al. (2007) Meyer, L., Schödel, R., Eckart, A., et al. 2007, A&A, 473, 707
- Meyer et al. (2006b) Meyer, L., Schödel, R., Eckart, A., et al. 2006b, A&A, 458, L25
- Mirabel et al. (1998) Mirabel, I. F., Dhawan, V., Chaty, S., et al. 1998, A&A, 330, L9
- Miyazaki et al. (2004) Miyazaki, A., Tsutsumi, T., & Tsuboi, M. 2004, ApJ, 611, L97
- Muno et al. (2003) Muno, M., Baganoff, F., Bautz, M., et al. 2003, ApJ, 589, 225
- Muno et al. (2005) Muno, M., Pfahl, E., Baganoff, F., et al. 2005, ApJ, 622, L113
- Nishiyama et al. (2009) Nishiyama, S., Tamura, M., Hatano, H., et al. 2009, ApJ, 702, L56
- Pierce-Price et al. (2000) Pierce-Price, D., Richer, J. S., Greaves, J. S., et al. 2000, ApJ, 545, L121
- Ponti et al. (2010) Ponti, G., Terrier, R., Goldwurm, A., Belanger, G., & Trap, G. 2010, ApJ, 714, 732
- Ponti et al. (2009) Ponti, G., Trap, G., Goldwurm, A., et al. 2009, The Astronomer’s Telegram, 2038, 1
- Porquet et al. (2008) Porquet, D., Grosso, N., Predehl, P., et al. 2008, A&A, 488, 549
- Porquet et al. (2003) Porquet, D., Predehl, P., Aschenbach, B., et al. 2003, A&A, 407, L17
- Reid et al. (2009) Reid, M. J., Menten, K. M., Zheng, X. W., Brunthaler, A., & Xu, Y. 2009, ApJ, 705, 1548
- Rousset et al. (2003) Rousset, G., Lacombe, F., Puget, P., et al. 2003, in Society of Photo-Optical Instrumentation Engineers (SPIE) Conference Series, ed. P. L. Wizinowich & D. Bonaccini, Vol. 4839, 140–149
- Sakano et al. (2004) Sakano, M., Warwick, R., Decourchelle, A., & Predehl, P. 2004, MNRAS, 350, 129
- Siringo et al. (2009) Siringo, G., Kreysa, E., Kovács, A., et al. 2009, A&A, 497, 945
- Strüder et al. (2001) Strüder, L., Briel, U., Dennerl, K., et al. 2001, A&A, 365, L18
- Terrier et al. (2010) Terrier, R., Ponti, G., Bélanger, G., et al. 2010, ApJ, 719, 143
- Trap et al. (2010) Trap, G., Goldwurm, A., Terrier, R., et al. 2010, Adv. Space Res., 45, 507
- Trippe et al. (2007) Trippe, S., Paumard, T., Ott, T., et al. 2007, MNRAS, 375, 764
- Turner et al. (2001) Turner, M. J. L., Abbey, A., Arnaud, M., et al. 2001, A&A, 365, L27
- van der Laan (1966) van der Laan, H. 1966, Nature, 211, 1131
- Viehmann et al. (2005) Viehmann, T., Eckart, A., Schödel, R., et al. 2005, A&A, 433, 117
- Wang et al. (2006) Wang, Q. D., Lu, F. J., & Gotthelf, E. V. 2006, MNRAS, 367, 937
- Wright & Backer (1993) Wright, M. C. H. & Backer, D. C. 1993, ApJ, 417, 560
- Yuan et al. (2003) Yuan, F., Quataert, E., & Narayan, R. 2003, ApJ, 598, 301
- Yuan et al. (2004) Yuan, F., Quataert, E., & Narayan, R. 2004, ApJ, 606, 894
- Yusef-Zadeh et al. (2006a) Yusef-Zadeh, F., Bushouse, H., Dowell, C. D., et al. 2006a, ApJ, 644, 198
- Yusef-Zadeh et al. (2009) Yusef-Zadeh, F., Bushouse, H., Wardle, M., et al. 2009, ApJ, 706, 348
- Yusef-Zadeh et al. (2006b) Yusef-Zadeh, F., Roberts, D., Wardle, M., Heinke, C. O., & Bower, G. C. 2006b, ApJ, 650, 189
- Yusef-Zadeh et al. (2007) Yusef-Zadeh, F., Wardle, M., Cotton, W. D., Heinke, C. O., & Roberts, D. A. 2007, ApJ, 668, L47
- Yusef-Zadeh et al. (2008) Yusef-Zadeh, F., Wardle, M., Heinke, C., et al. 2008, ApJ, 682, 361
- Zhao et al. (2003) Zhao, J.-H., Young, K. H., Herrnstein, R. M., et al. 2003, ApJ, 586, L29
- Zylka & Mezger (1988) Zylka, R. & Mezger, P. G. 1988, A&A, 190, L25