Propagating Intensity Disturbances in Fan-like Coronal Loops: Flows or Waves?
Abstract
Quasi-periodic intensity disturbances propagating upward along the coronal structure have been extensively studied using EUV imaging observations from SOHO/EIT and TRACE. They were interpreted as either slow mode magnetoacoustic waves or intermittent upflows. In this study we aim at demonstrating that time series of spectroscopic observations are critical to solve this puzzle. Propagating intensity and Doppler shift disturbances in fanlike coronal loops are analyzed in multiple wavelengths using sit-and-stare observations from Hinode/EIS. We find that the disturbances did not cause the blue-wing asymmetry of spectral profiles in the warm (1.5 MK) coronal lines. The estimated small line-of-sight velocities also did not support the intermittent upflow interpretation. In the hot (2 MK) coronal lines the disturbances did cause the blue-wing asymmetry, but the double fits revealed that a high-velocity minor component is steady and persistent, while the propagating intensity and Doppler shift disturbances are mainly due to variations of the core component, therefore, supporting the slow wave interpretation. However, the cause for blueward line asymmetries remains unclear.
1 Introduction
Upwardly propagating quasi-periodic intensity disturbances are known to exist in coronal loops (Berghmans & Clette 1999; De Moortel et al. 2000) and have been studied extensively using EUV images from SOHO/EIT and TRACE (see a recent review by de Moortel 2009). These propagating disturbances were interpreted as slow magnetoacoustic waves (Nakariakov et al. 2000) since their propagating speeds (100 km s-1) are close to the sound speed in the corona and periodicities appear depending on the underlying driver such as the leakage of the photospheric -modes (De Moortel et al. 2002; De Pontieu et al. 2005).
However, similar phenomena were re-discovered with Hinode/XRT recently and interpreted as high-speed outflows because these disturbances were found associated with outflows at the loop’s footpoints with Hinode/EIS (Sakao et al. 2007; Harra et al. 2008). Based on EIS observations of blueward asymmetries of spectral profiles, some authors suggested that these propagating disturbances are most likely transient outflows produced by episodic coronal heating events (McIntosh & De Pontieu 2009; De Pontieu et al. 2009; De Pontieu & McIntosh 2010). However, the blueward spectral asymmetry is also consistent with the wave interpretation (Verwichte et al. 2010).
Wang et al. (2009) first studied these propagating disturbances using the EIS time series and found that the Doppler shift variations have small amplitudes of only about 12 km s-1, and are in phase with the intensity variations. These features are consistent with slow magnetoacoustic waves propagating upwards along coronal structures. In this study we examine the effect of the disturbances on the evolution of spectral profiles. The purpose is to determine whether the apparent propagating disturbances are the slow waves or high-velocity upflows, or possible coexistence of both.
2 Observations and Data Analysis
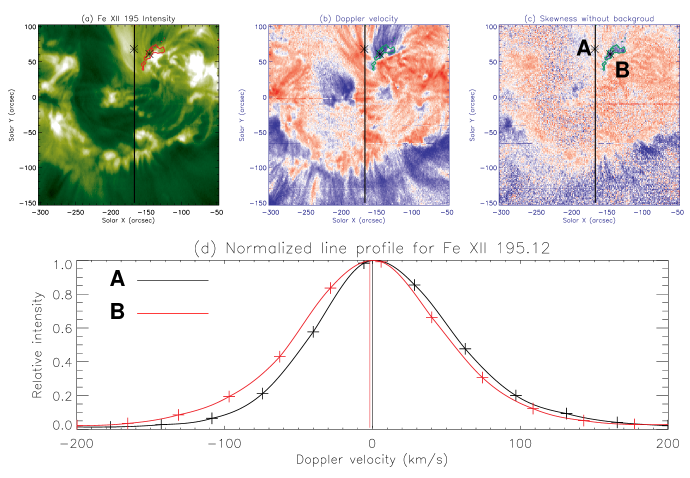
The observations were obtained on February 1, 2007 in AR 10940. The analysis of EIS sit-and-stare observations for propagating disturbances in Fe xii 195.12 Å was presented by Wang et al. (2009). They found quasi-periodic (12 and 25 min) propagating disturbances in both intensity and Doppler shift along the fanlike loops. De Pontieu & McIntosh (2010) performed a “Red Minus Blue” (R-B) profile asymmetry analysis on the Fe xii 195.12, Fe xiii 202.04, and Fe xiv 274.20 Å spectral lines, and discussed the cause of the quasi-periodicities in the R-B asymmetry using the forward modeling and R-B guided double fits techniques. Using a different approach, our study focuses on direct examination of the influence of individual disturbances on the line profile shape. We also examine the line asymmetry using the skewness. The skewness is a typical measure of line asymmetry, defined as , where and are the mean and standard deviation of the line. Figure 1 shows the Fe xii raster image, Doppler shift, and skewness maps. Since the Fe xii 195.12 Å line is self-blended with a weak line (195.18 Å; Young et al. 2009), a constant background has been removed from the skewness map. The skewness with large negative values indicates line profiles having evident blueward asymmetries (Figures 1c and d). To find the change of a spectral profile in shape relative to the background profile, we first interpolate the spectral profile, and then normalize it to the peak intensity. We calibrate Doppler velocities measured with EIS in different emission lines by choosing Si x 258.37 Å in the long wavelength band and Fe xii 195.12 Å in the short wavelength band as the reference lines and adopting the relative wavelengths measured above the limb by Warren et al. (2011). We adjust the wavelength scale of the reference lines by letting the quiet corona have no net velocities in these lines.
3 Results for Spectral Profile Examination in Multiple Wavelengths
3.1 Warm Coronal Lines: Fe xii 195 Å and Fe xiii 202 Å
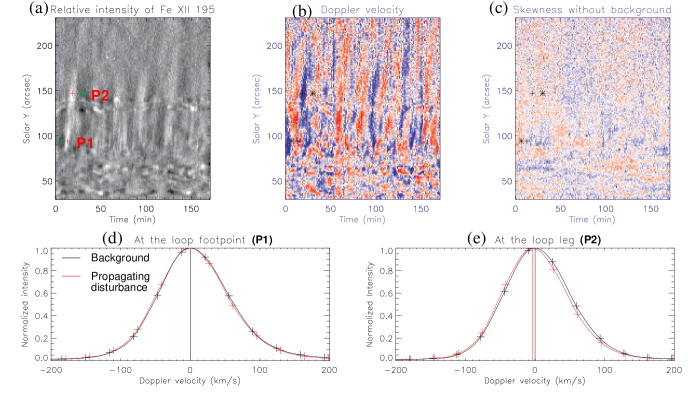
Figure 1 shows that the strong blueward asymmetry of Fe xii 195 Å mainly occurred at the footpoints of weak loops associated with upflows, while in bright fanlike loops associated with downflows, signatures of the blueward asymmetry are less evident. Figure 2 shows the propagating disturbances in intensity and Doppler shift of Fe xii along the bright fanlike loops. No propagating features found in time series of the skewness indicate that the disturbances did not cause changes in the line shape. This is confirmed by comparisons of the normalized line profiles at times on and off the propagating brightenings (Figures 2d and 2e).
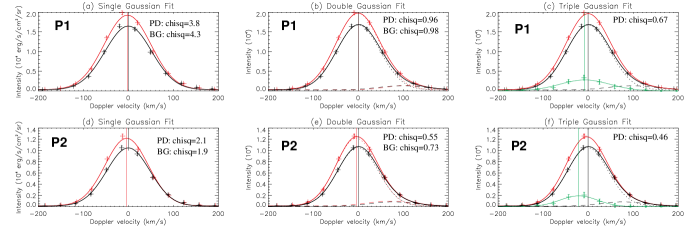
The line asymmetry also can be examined by the multiple fit analysis. Figure 3 shows that single Gaussian fits did not fully capture the data (with large reduced chi-squared statistics) because of the blending. The double Gaussian fits including the blended line of Fe xii 195.18 Å match well to the data. For such line profiles, it is impossible to add an extra component in free multiple Gaussian fits. To check the suggestion by De Pontieu & McIntosh (2010) that bright disturbances are caused by the quasi-periodic transient upflows, we make the hypothesis that the excess of the line profile for a bright disturbance (also called transient jets by some authors) relative to that taken before or after this disturbance at the same position (referred to as the background) is fully contributed by an upflow, and then we can make a multiple Gaussian fit to the line profile for the disturbance by fixing the background components (Figures 3c and 3f). From the fits, we can estimate the line-of-sight velocity of the hypothetical upflow, which is found to be about 7 and 20 km s-1 relative to the background component for the positions at the footpoint and the leg of the loops, respectively. We also notice that the Gaussian width of the fitted upflow component is larger than that of the background component by 16% at the position of the loop’s footpoint, whereas it is smaller than that of the background component by 8% at the position of the leg.
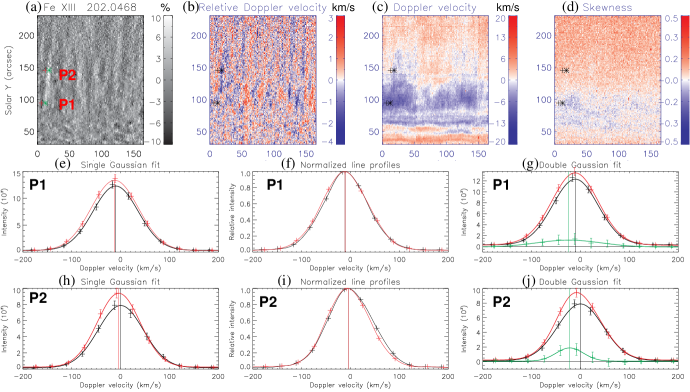
Although the Fe xii 195 Å observations have the highest signal-to-noise ratio, the self-blending made its analysis complicated as shown above. To confirm the results found in Fe xii 195 Å, we compare with the analysis of a clean line, Fe xiii 202.05 Å. Figures 4a and 4b show that the propagating intensity and Doppler shift disturbances observed in Fe xiii are very close to those seen in Fe xii. The negative skewness in the region – indicates that the blueward line asymmetry may result from the associated upflows in this region (Figures 4c and 4d). However, the disturbances can propagate high above the region of the blueward asymmetry, and the skewness evolution shows no evidence for similar propagating features. These facts suggest that the upflows near the footpoints of the loop are persistent and stable during the observations, which cannot account for the quasi-periodic disturbances propagating to a high level. The line profile analysis shows that the estimated line-of-sight velocity of the hypothetical upflow is about 13 km s-1 at the footpoint (Fig. 4g), while about 22 km s-1 at the leg of the loop (Figure 4j). This result agrees well with that for Fe xii. The line width of the flow component estimated for Fe xiii is 42% larger at the footpoint, but 40% smaller at the leg of the loop than that of the background, which follows the same rule as for Fe xii. In addition, the line-of-sight velocity of the hypothetical upflows estimated for Si x 258.37Å (1.3 MK) are 11–13 km s-1, also consistent with the above results.
Under the hypothesis that the propagating disturbances are transient upflows, the line-of-sight component of 10–20 km s-1 along with the transverse component (assumed to be the observed propagating speed) of 100 km s-1 implies an inclination of the magnetic field in coronal loops to the vertical in the range 79∘–84∘, which is too large to be acceptable. Marsh et al. (2009) measured the 3D geometry of fanlike loops using STEREO EUVI observations, and found their inclination to be to the local normal. Moreover, the fact that the line width of the hypothetical upflow at the footpoint of the loop is much larger than that at the leg is unexpected, while this may be explained by the presence of multiple harmonics of the waves (Wang et al. 2009). Therefore, the above upflow hypothesis is not supported, instead the wave interpretation is preferred.
3.2 Hot Coronal lines: Fe xiv 274 Å and Fe xv 284 Å
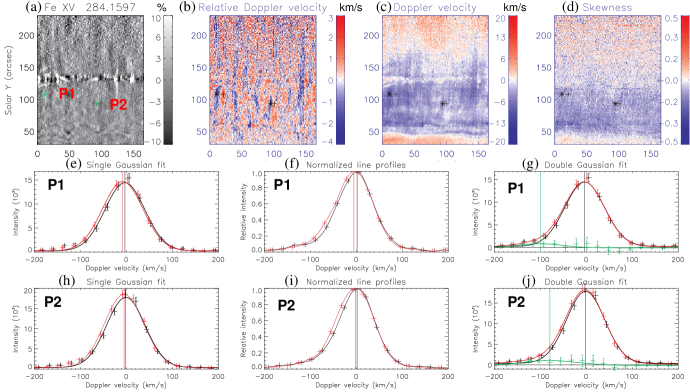
The propagating disturbances along hot coronal loops in the Fe xiv 274.20 Å and Fe xv 284.16 Å emission lines look similar, but appear different from those seen in the warm lines discussed in the last section. We find that the propagating disturbances detected in intensity and Doppler shift between warm and hot coronal lines are less correlated (not shown). Figures 5a and 5b show that the propagating disturbances are weak in intensity, but more evident in Doppler shift and located near the footpoints of the loop. The presence of persistent upflows is revealed in these hot coronal lines, which are characterized by evident blueward line asymmetries in Fe xv indicated by the skewness (Figures 5c and 5d). Single Gaussian fits show evident excess emission in the blue wing above 100 km s-1 (Figures 5e and 5h). Comparisons of the normalized line profiles reveal the enhancement in the blue wing of Fe xv due to the disturbances (Figures 5f and 5i). But this feature was not found in the warm coronal lines (Figures 4f and 5i).
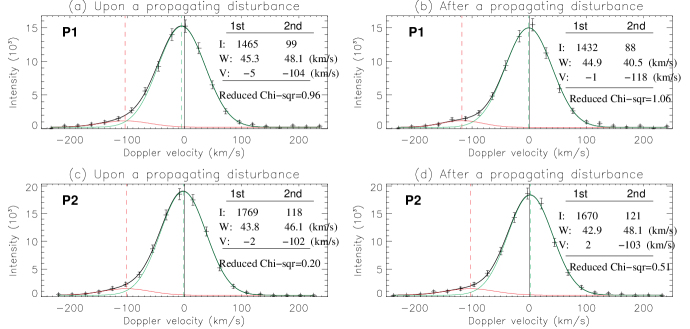
Using the double fits by taking the background line profile as a fixed component, we estimate the line-of-sight velocity of the hypothetical upflow to be 97 and 78 km s-1 for two selected disturbances (Figures 5g and 5j). However, it is noticed that the line profiles for both the disturbance and the background have evident blueward line asymmetries, indicating the presence of a persistent upflow. We use the constrained double Gaussian fits as suggested in Peter (2010) to analyze the effect of the disturbances on the evolution of the core component and the second minor component. Figure 6 shows the line profiles of Fe xv 284 Å along with the double fits upon and after the disturbances, where the second minor component was forced to have a blueshift of at least 70 km s-1. We find that the intensity increase of the core component accounts for about 75% of the total increase in Fe xv intensity for case P1, while it is more than the total increase for case P2. The core component was blueshifted by 4 km s-1 due to the bright disturbance in both cases, while the Doppler velocity of the minor component kept at about 100120 km s-1 with a small decrease upon the disturbance relative to the background (taken after the disturbances). This result indicates that the propagating intensity and Doppler shift disturbances with small amplitudes obtained in single fits are mainly ascribed to variations of the core component (loop emission) but not of the second component (high-speed upflows) in double fits for the hot coronal lines. Therefore, our result supports the interpretation of the propagating disturbances as slow mode magnetoacoustic waves propagating in coronal loops.
4 Discussion and Conclusion
We have presented a detailed analysis of propagating intensity and Doppler shift disturbances in fanlike coronal loops using EIS sit-and-stare multi-wavelength observations. We adopted several techniques such as the skewness, the line profile normalization, and the multiple Gaussian fits to examine changes of the spectral profile shape caused by these disturbances in warm coronal lines (e.g., Fe xii 195 Å and Fe xiii 202 Å) and in hot coronal lines (e.g., Fe xv 284 Å).
Blue-wing asymmetries associated with Doppler blueshifts are found to exist near the footpoints of coronal loops from the skewness analysis, they are more evident in hot lines. No propagating features found in time series of the skewness suggest that the associated upflows are persistent during the observations. We find that these disturbances appear uncorrelated between the warm and hot lines, suggesting that they may propagate in different loops of different temperatures. The warm coronal lines show no evidence that the disturbances led to blue-wing asymmetries. The observed high (100–120 km s-1) propagating speeds are not likely to be the result of hypothetical periodic upflows whose line-of-sight velocity is estimated to be only about 10–20 km s-1. The hot coronal lines have a high-velocity (100 km s-1) component persistently existing in the blue wing during the period of observations, suggesting the presence of a steady upflow in hot coronal loops. The restricted double fits show that the propagating intensity enhancements are mainly contributed from the increase in the core component but not due to variations of the second minor component. Variations of the core component in intensity and Doppler shift having small amplitudes are consistent with propagating slow-mode waves. However, the disturbance-related excess in the blue wing of hot coronal lines revealed by comparisons of the normalized line profiles (Figures 5f and 5i) could not be explained by the superposition of the core component with Doppler shift oscillations caused by a slow wave and the background component produced by a steady upflow or static plasma based on a simple forward modeling, and the cause requires further investigation.
Long-period (12 and 24 min) slow waves are not likely to be the direct result of photospheric -mode leakage. Instead their association with steady upflows may suggest that these waves are produced by the same mechanism that drives the steady upflows. As these upflows are progressively larger in lines formed at higher temperatures, Del Zanna (2008) suggested that they could be due to chromospheric evaporation following magnetic reconnection. The generation of slow waves is expected since they are a natural response to the impulsive heating (Nakariakov et al. 2004; Taroyan et al. 2007). Therefore, observations of these waves may provide a potential diagnostic of coronal heating. More recently, Del Zanna et al. (2011) proposed a rarefaction wave model based on reconnection between field lines of active regions and the nearby coronal hole, which can also explain the existence of persistent upflows and slow waves. But the reason why the upflows are persistent while the waves appear as quasi-periodic pulses is unknown and should be further studied in the future.
Acknowledgments
Hinode is a Japanese mission developed, launched, and operated by ISAS/JAXA in partnership with NAOJ, NASA, and STFC (UK). Additional operation support is provided by ESA and NSC (Norway). The work of TW and LO was supported by NASA grants NNX10AN10G and NNX09AG10G.
References
- Berghmans & Clette (1999) Berghmans, D., & Clette, F. 1999, Solar Phys., 186, 207
- de Moortel (2009) de Moortel, I. 2009, Space Sci. Rev., 149, 65
- De Moortel et al. (2000) De Moortel, I., Ireland, J., & Walsh, R. W. 2000, A&A, 355, L23
- De Moortel et al. (2002) De Moortel, I., Ireland, J., Walsh, R. W., & Hood, A. W. 2002, Solar Phys., 209, 61
- De Pontieu et al. (2005) De Pontieu, B., Erdélyi, R., & De Moortel, I. 2005, ApJ, 624, L61
- De Pontieu & McIntosh (2010) De Pontieu, B., & McIntosh, S. W. 2010, ApJ, 722, 1013
- De Pontieu et al. (2009) De Pontieu, B., McIntosh, S. W., Hansteen, V. H., & Schrijver, C. J. 2009, ApJ, 701, L1
- Del Zanna (2008) Del Zanna, G. 2008, A&A, 481, L49
- Del Zanna et al. (2011) Del Zanna, G., Aulanier, G., Klein, K.-L., & Török, T. 2011, A&A, 526, A137
- Harra et al. (2008) Harra, L. K., Sakao, T., Mandrini, C. H., Hara, H., Imada, S., Young, P. R., van Driel-Gesztelyi, L., & Baker, D. 2008, ApJ, 676, L147
- Marsh et al. (2009) Marsh, M. S., Walsh, R. W., & Plunkett, S. 2009, ApJ, 697, 1674
- McIntosh & De Pontieu (2009) McIntosh, S. W., & De Pontieu, B. 2009, ApJ, 706, L80
- Nakariakov et al. (2004) Nakariakov, V. M., Tsiklauri, D., Kelly, A., Arber, T. D., & Aschwanden, M. J. 2004, A&A, 414, L25
- Nakariakov et al. (2000) Nakariakov, V. M., Verwichte, E., Berghmans, D., & Robbrecht, E. 2000, A&A, 362, 1151
- Peter (2010) Peter, H. 2010, A&A, 521, A51
- Sakao et al. (2007) Sakao, T., Kano, R., Narukage, N., Kotoku, J., Bando, T., DeLuca, E. E., Lundquist, L. L., Tsuneta, S., Harra, L. K., Katsukawa, Y., Kubo, M., Hara, H., Matsuzaki, K., Shimojo, M., Bookbinder, J. A., Golub, L., Korreck, K. E., Su, Y., Shibasaki, K., Shimizu, T., & Nakatani, I. 2007, Science, 318, 1585
- Taroyan et al. (2007) Taroyan, Y., Erdélyi, R., Wang, T. J., & Bradshaw, S. J. 2007, ApJ, 659, L173
- Verwichte et al. (2010) Verwichte, E., Marsh, M., Foullon, C., Van Doorsselaere, T., De Moortel, I., Hood, A. W., & Nakariakov, V. M. 2010, ApJ, 724, L194
- Wang et al. (2009) Wang, T. J., Ofman, L., Davila, J. M., & Mariska, J. T. 2009, A&A, 503, L25
- Warren et al. (2011) Warren, H. P., Ugarte-Urra, I., Young, P. R., & Stenborg, G. 2011, ApJ, 727, 58
- Young et al. (2009) Young, P. R., Watanabe, T., Hara, H., & Mariska, J. T. 2009, A&A, 495, 587