The first Fermi multifrequency campaign on BL Lacertae:
characterizing the low-activity state of the eponymous blazar
Abstract
We report on observations of BL Lacertae during the first 18 months of Fermi LAT science operations and present results from a 48-day multifrequency coordinated campaign from 2008 August 19 to 2008 October 7. The radio to gamma-ray behavior of BL Lac is unveiled during a low activity state thanks to the coordinated observations of radio-band (Metsähovi and VLBA), near-IR/optical (Tuorla, Steward, OAGH and MDM) and X-ray (RXTE and Swift ) observatories. No variability was resolved in gamma-rays during the campaign, and the brightness level was 15 times lower than the level of the 1997 EGRET outburst. Moderate and uncorrelated variability has been detected in UV and X-rays. The X-ray spectrum is found to be concave indicating the transition region between the low and high energy component of the spectral energy distribution (SED). VLBA observation detected a synchrotron spectrum self-absorption turnover in the innermost part of the radio jet appearing to be elongated and inhomogeneous, and constrained the average magnetic field there to be less than 3 G. Over the following months BL Lac appeared variable in gamma-rays, showing flares (in 2009 April and 2010 January). There is no evidence for correlation of the gamma-rays with the optical flux monitored from the ground in 18 months. The SED may be described by a single zone or two zone synchrotron self-Compton (SSC) model, but a hybrid SSC plus external radiation Compton (ERC) model seems preferred based on the observed variability and the fact that it provides a fit closest to equipartition.
Subject headings:
Gamma rays: galaxies – BL Lacertae objects: individual: BL Lac (catalog ) – BL Lacertae objects: general – X-rays: galaxies – galaxies: jets – radiation mechanisms: non-thermal1. Introduction
BL Lacertae (BL Lac, S4 2200+42, OY 401, B3 2200+420, 1ES 2200+420, 3EG J2202+4217, 1FGL J2202.8+4216) at redshift (e.g., Vermeulen et al.,, 1995) was historically the prototype of the class of active galactic nuclei (AGN) for which BL Lac has become the eponym. It is categorized as an intermediate synchrotron peaked (ISP) BL Lac object. This is based on the latest HSP/ISP/LSP classification proposed by Abdo et al. (2010a) to replace the older HBL-IBL-LBL scheme (Padovani & Giommi, 1995; Fossati et al., 1998). BL Lac occasionally showed peculiar behavior that has questioned both this classification and a simple interpretation of its broad-band emission in terms of synchrotron and synchrotron self-Compton (SSC) emission produced by a single blob. In fact, BL Lac is a source that has shown quite complex and distinct X-ray spectral behavior (Madejski et al., 1999; Ravasio et al., 2002; Böttcher & Reimer, 2004) and during several epochs broad H and H emission lines with luminosity () comparable to those of type I Seyfert galaxies (Vermeulen et al.,, 1995; Corbett et al.,, 1996, 2000). There is evidence for an increase by in ten years of the broad H line and an underluminous broad line region (BLR), compared to other AGN. The narrow lines and radio luminosities of BL Lac match those of of low-excitation and miniature radio galaxies (Capetti et al., 2010). Long term radio-optical flux density monitoring and several multiwavelength campaigns have been carried out on BL Lac, like the past campaigns of the Whole Earth Blazar Telescope (WEBT, Villata et al., 2002a, b) dedicated to this source, providing very complete datasets (for example, Bloom et al.,, 1997; Sambruna et al.,, 1999; Madejski et al., 1999; Ravasio et al., 2003; Böttcher et al., 2003; Villata et al., 2002a, 2004a, 2004b, 2009; Raiteri et al., 2009, 2010; Marscher et al., 2008). In particular in summer 1997 BL Lac showed the largest optical outburst ever recorded in almost 33 years (Nesci et al., 1998; Tosti et al., 1999; Villata et al., 2004b).
In the X-ray band the two broad components of the spectral energy distribution (SED) are overlapping and the radiation at this band is at times dominated by the high-energy end of the synchrotron emission, while at other occasions it is dominated by the low-frequency portion of the high-energy component (e.g., Madejski et al., 1999; Ravasio et al., 2002). The rapid X-ray variability is mainly restricted to the low-energy excess portion of the X-ray spectrum, presumably produced by synchrotron radiation (Ravasio et al., 2002, 2003). The X-ray variability of BL Lac, except for a few major flaring events, has a log-normal distribution (Giebels & Degrange, 2009), meaning that the emission is a multiplicative product of a large number of independent random events.
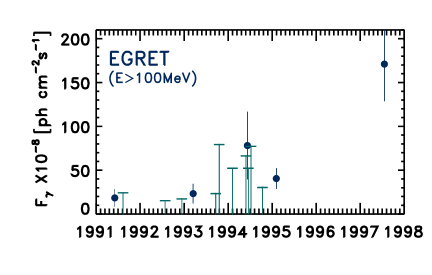
Gamma-ray observations by EGRET resulted in several detections (Figure 1). Observations after 1995 resulted in an average -ray flux above 100 MeV of ph cm-2 s(Catanese et al., 1997) and in a flare in 1997 at a level ph cm-2 swith 10.2 significance (Bloom et al.,, 1997). Correlated -rays and optical flaring emission were observed during the EGRET era (Bloom et al.,, 1997). Very high energy (VHE) -ray emission was claimed by the Crimean GT-48 (Neshpor et al., 2001) and HEGRA (Kranich, 2003) atmospheric Cherenkov telescopes. A significant () detection above 200 GeV was made only by the MAGIC telescope in 2005 (Albert et al., 2007). Gamma-ray emission was explained with the requirement of Comptonization of external-jet photons (external-radiation Compton, ERC) in addition to the SSC (in-jet) emission (Madejski et al., 1999; Böttcher & Bloom, 2000). Superluminal motion of up to has been observed in this object (Lister et al., 2009; Denn et al.,, 2000). Following results of past multifrequency campaigns, possibly distinct VLBI jet structures are assumed to contribute, sometimes with delays, to the radio flux density light curves, and sometimes are suggested to be responsible for optical to TeV -ray flares (for example, Bach et al., 2006; Marscher et al., 2008).
In this paper, we report on LAT observations of BL Lac during the first 18 months of Fermi science operations (from 2008 August 04 to 2010 February 04). The LAT’s reasonably uniform exposure, high sensitivity, and continuous sky monitoring make it an excellent instrument around which to organize a simultaneous multifrequency campaign. The so-called Fermi planned intensive campaign (PIC) dedicated to BL Lac was performed in 2008 August 19 – 2008 October 7 (MJD 54697.8 – 54746), during roughly the first two months of science operations, irrespective of the brightness of the source. This was part of a series of Fermi-LAT-collaboration PICs (Tosti, 2007; Thompson, 2007), involving observing proposals submitted to the RXTE (Cycle 12) and Swift (Cycle 4) X-ray satellites, and organized in advance of the Fermi launch. This ensured access to the facilities allowing the best multiwavelength (MW) coverage. The aim of the campaign is to shed light for the first time on the broad-band radio-to--ray SED, including the high energy (X-ray and -ray) behavior, during a low activity phase of the source. The 18-month LAT light curve shows that BL Lac was variable in -rays for most of these 18 months, with the exception of the first 2 months, which corresponds to the period of the MW campaign. In section 2 the light curve by Fermi -LAT during the first 18 months of survey and simultaneous optical long-term monitoring data are presented joined to the analysis of the -ray spectrum. In section 3 the multiwaveband radio-band to X-ray flux density and parsec-scale radio structure observations collected during the campaign period are reported and discussed. The assembled spectral energy distribution and modeling are reported in section 3.4 and conclusions in section 4.
A CDM cosmology with values given within 1 of the WMAP results (Komatsu et al., 2009), namely , , and km s-1 Mpc-1 is used.
2. Gamma-ray observations and results by Fermi-LAT
2.1. LAT analysis and observations
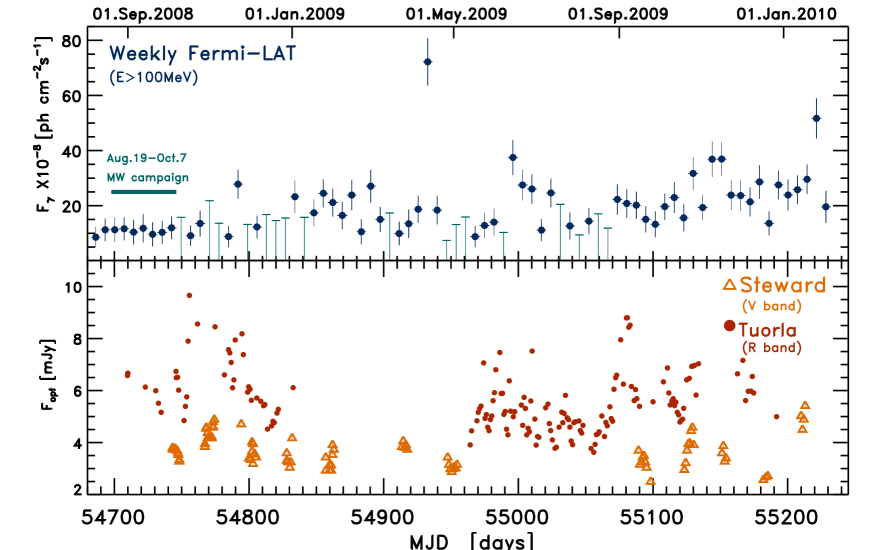
The Large Area Telescope (LAT), on board the Fermi Gamma-ray Space Telescope (Atwood et al., 2009), is a pair-conversion -ray telescope, sensitive to photon energies from about 20 MeV up to 300 GeV. It consists of a tracker (composed of two sections, front and back, with different angular resolutions), a calorimeter and an anti-coincidence system to reject the charged-particle background. The LAT has a large peak effective area ( cm2 for 1 GeV photons in the event class considered here), viewing sr of the sky with angular resolution (68% containment radius) better than at GeV. The large field of view, improved effective area and sensitivity and the survey nominal mode make Fermi-LAT an optimal all-sky hunter for high-energy flares and an unprecedented monitor of -ray sources. The data set used in this paper was collected during the first 18 months of Fermi science obserations, from 2008 August 4 to 2010 February 4 (about 550 days, 78 weeks from MJD 54682.7 to 55232.9, as shown in the weekly light curve in Figure 2, upper panel). This interval includes the period chosen for the first Fermi MW campaign on BL Lac (2008, Aug. 19 – Oct. 7, MJD 54697.8-54746, i.e. about 48 days, indicated by the line in Figure 2, upper panel). Fermi -LAT data analysis was performed with the standard Fermi -LAT ScienceTools software package111http://fermi.gsfc.nasa.gov/ssc/data/analysis/documentation/Cicerone/ using version v9r15p5. Only events belonging to the “Diffuse” class in the energy range GeV were used in the analysis. Instrument response functions (IRFs) used were P6_V3_DIFFUSE. In order to provide protection against significant background contamination by Earth-limb rays, all events with zenith angles were excluded.
The 18-month light curve was built using 1-week time bins (Figures 2 and 4). For each time bin the integrated flux (E100 MeV) values were computed using the maximum-likelihood algorithm implemented in the science tool gtlike. For each time bin we analyzed a region of interest (RoI) of in radius, centered on the position of the source. All point sources listed in the 1FGL (1-year) LAT catalog (Abdo et al., 2010b) within from BL Lacertae and having test statistic222The test statistic is defined as log(Likelihood) between models with and without the source and it is a measure of the source significance (Mattox et al., 1996). TS and fluxes above ph cm-2 swere included in the RoI model using a power-law spectrum (, where is the photon index). The isotropic background (the sum of the residual instrumental background and extragalactic diffuse -ray background) was included in the RoI model using the standard model file isotropic_iem_v02.txt333http://fermi.gsfc.nasa.gov/ssc/data/access/lat/BackgroundModels.html, and the Galactic diffuse emission was included in the modeling using the file and the standard file gll_iem_v02.fit. In the final light curve computation the photon index value was frozen to the value resulting from the likelihood analysis on the entire period. For each time bin, if the TS value for the source was or the number of model predicted photons , the value of the fluxes were replaced by the 2- upper limits. All errors reported in the figures or quoted in the text are 1- statistical errors. The estimated relative systematic uncertainty on the flux, according to Abdo et al. (2010b) and reflecting the relative systematic uncertainty on effective area, is set to 10% at 100 MeV, 5% at 500 MeV and 20% at 10 GeV.
2.2. Gamma-ray spectral and temporal behavior
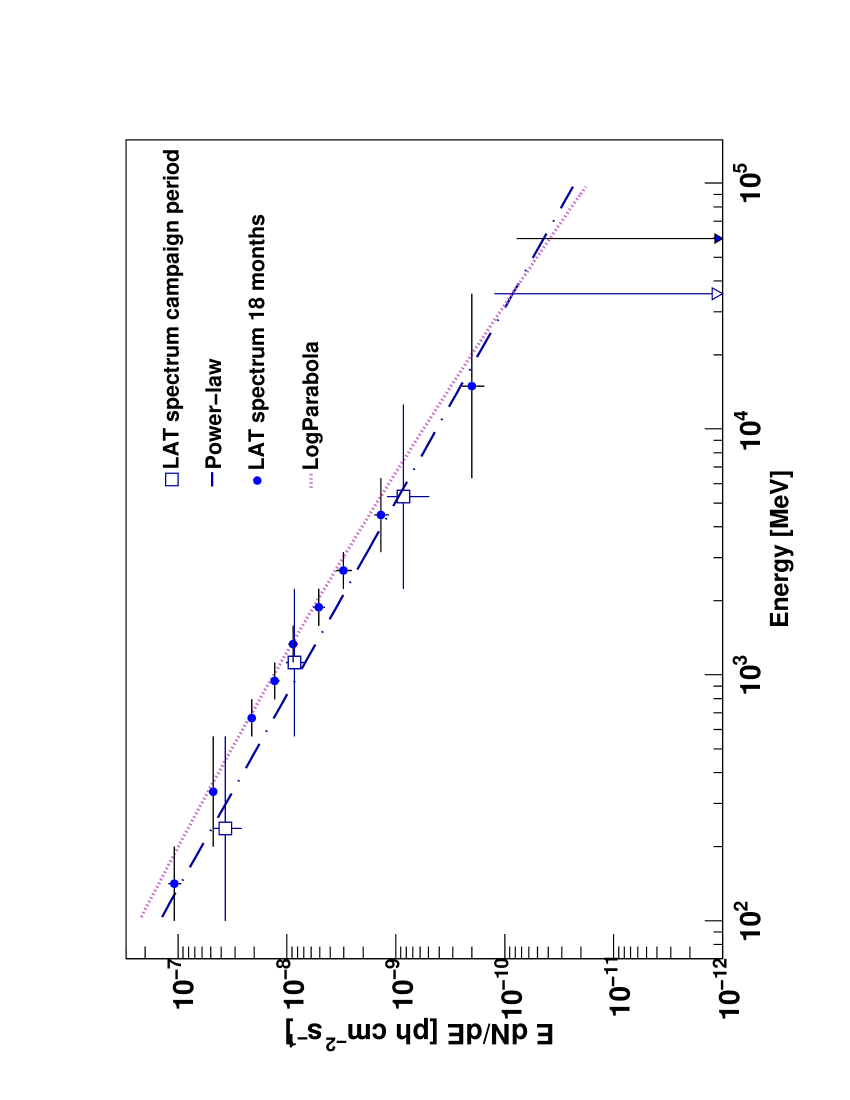
The -ray spectral analysis of BL Lacertae was performed both for the entire 18-month period, and for the 48 days of the campaign. These spectra are shown in Figure 3. The flux value for each energy bin and for the two periods are reported in Table 1. The most energetic photon observed within the 95% point spread function containment radius of the source for the 18-month period had energy 70 GeV, while for the campaign period the highest energy photon had 10 GeV. The energy-spectrum binning was built requiring and/or model-predicted source photons , except for the last bin, which had an upper limit rather than a detection. The 18-month spectrum results in an integrated average flux of ( ph cm-2 s, in the GeV range, with and photon index , while the value for the 48-day interval of the multifrequency campaign, ( ph cm-2 s, and the photon index slightly flatter (), with a .
In order to quantify the departure of the 18-month spectrum from a power law shape, we use a spectral curvature index as in Abdo et al. (2010b),
| (1) |
where is the index for a particular energy bin, is the observed flux, is the flux in the bin predicted by the global power-law fit, is the error in , and is the relative systematic uncertainty in that bin (reported in Table 1). The power-law fit has two parameters: the normalization and photon index. The curvature parameter is expected to follow a distribution with degrees of freedom (d.o.f.) if the power law hypothesis is true. With 99% confidence the spectral shape is significantly different from a power law when . For the accumulated 18-month data on BL Lac we found ( GeV), which implies a curved spectrum. The same procedure, when applied to the spectrum of the 48-day multifrequency campaign, resulted in ( GeV), implying there is no significant evidence for deviation from a simple power-law in this spectrum (Figures 3 and 10). This does not necessarily mean that there is no curvature during this 48-day period, because it could be due to the lower emission state and accumulated statistics.
To further explore curvature, the 18-month spectrum was fit with a log-parabola function in the GeV energy band. This was performed in two runs: first a fit with left free, then another with frozen at the value found in the first run (300 MeV) to improve the calculation of the other parameter values. The result of the latter fit gives
with TS = .
| -ray flux | Syst. | |
| 18 months | ||
| 100-200 | 7.621.03 | 10% |
| 200-562 | 5.140.27 | 5% |
| 562-794 | 0.730.06 | 5% |
| 794-1122 | 0.450.04 | 5% |
| 1122-1585 | 0.310.03 | 10% |
| 1585-2239 | 0.180.02 | 10% |
| 2239-3162 | 0.110.02 | 10% |
| 3162-6310 | 0.100.01 | 15% |
| 6310-35481 | 0.040.01 | 15% |
| Aug 19 - Sep 9 | ||
| 100-562 | 7.182.12 | 5% |
| 562-2239 | 1.280.24 | 10% |
| 2239-12589 | 0.170.07 | 15% |
The higher TS value shows that the 18 months LAT spectrum does not follow a simple power law function, and the log-parabola model can describe this spectrum.
The weekly light curve in the 0.1-100 GeV band for the 18-month period is presented in Figure 2 (upper panel). In order to quantify the variability, the variability index as defined in Abdo et al. (2010b), was computed from
| (2) |
where
| (3) |
| (4) |
and the index runs over all data points except the upper limits (61 bins). Here and are flux values and the relative statistical errors, respectively, and is equal to 3% of the flux for each interval, as suggested by Abdo et al. (2010b). For the 18 months, was found to be ph cm-2 sand V = 193 with 60 d.o.f., which is consistent with variability (the probability the source is non-variable is less than ). The same values computed just for the first 9 weeks, containing the period of the MW campaign, give ph cm-2 sand with 8 d.o.f., which is consistent with a non-variability hypothesis at % confidence. Each of the LAT flux data points in the upper panel of Figure 4 has .
This interval with no observed -ray variability characterizes the intensive coordinated campaign period. After the campaign, starting from about halfway through 2008 November until 2010 February 4, BL Lac showed variable weekly -ray flux with with 51 d.o.f., ph cm-2 s. In particular, a 1-week -ray flare occurred in the week MJD 54928.5-54935.5 (2009 Apr. 7-14), with a flux value of ph cm-2 s. This is about 4 times greater than the mean flux value () computed above. Moreover this is the highest weekly flux yet detected from BL Lac, although another likely flare was detected in the week around MJD 55221 (2010 Jan. 25, Sokolovsky et al., 2010a). After the 2009 April flare the source also showed slightly higher activity and flux.
The 78 points of the 18-month light curve were also used to compute the global normalized excess variance, as defined in Vaughan et al. (2003); Abdo et al. (2010d): , where is the variance of the light curve and , the sum in quadrature of the statistical uncertainty of the flux in the time bin and the systematic error estimate (). This quantity measured an intrinsic variability amplitude of , in good agreement with the value found in Abdo et al. (2010d) reporting the weekly light curve of BL Lac (flux MeV) during the first 11 months. This confirms again that BL Lac was variable after the first couple of months of Fermi science operations.
3. Observations and results from the multifrequency campaign
The 48-day PIC on BL Lac involved the participation of the RXTE and Swift X-ray satellites, and of ground-based radio and optical observatories. These included the Metsähovi 13.7 m radio-telescope operating at 37 GHz in Finland; the Very Long Baseline Array (VLBA) in the USA, which took a multi-waveband flux-structure observation on 2008 September 2; two telescopes of the Tuorla Observatory, Finland, and two telescopes of the Steward Observatory, USA, for the long-term and single-band optical monitoring as presented in Figure 2; and the 2.1 m optical telescope of the Observatorio Astrofísico Guillermo Haro (OAGH, Mexico) operating in near-infrared, and the 1.3 m McGraw-Hill optical Telescope of the MDM Observatory (Arizona, USA), for further multi-band optical snapshots during the campaign period (Table 2).
| PIC (48 days) | |||
| Instrument | Energy Range | 2008 Epoch range | # obs. |
| VLBA | 4.6 - 43.2 GHz | Sep 2 | 7 |
| Metsähovi | 37 GHz | Aug 20 - Oct 6 | 22 |
| OAGH | J H K | Sep 6 - Oct 6 | 18 |
| MDM | U B V R I | Oct 6 - 10 | 15 |
| Swift -UVOT | W2 M2 W1 U B V | Aug 20 - Oct 2 | 141 |
| Swift -XRT | 0.4-8 KeV | Aug 20 - Sep 18 | 24 |
| RXTE -PCA | 3-18 KeV | Aug 20 - Sep 8 | 19 |
| Fermi-LAT | 100 MeV - 100 GeV | Aug 19 - Oct 7 | 48 days |
| 18 months | |||
| Instrument | Energy Range | Epoch range (MJD) | # obs. |
| Tuorla | R | 54709.8 - 55191.8 | 162 |
| Steward | V | 54743.2 - 55213.1 | 89 |
| Fermi-LAT | 100 MeV - 100 GeV | 54682.7 - 55070 | 78 weeks |
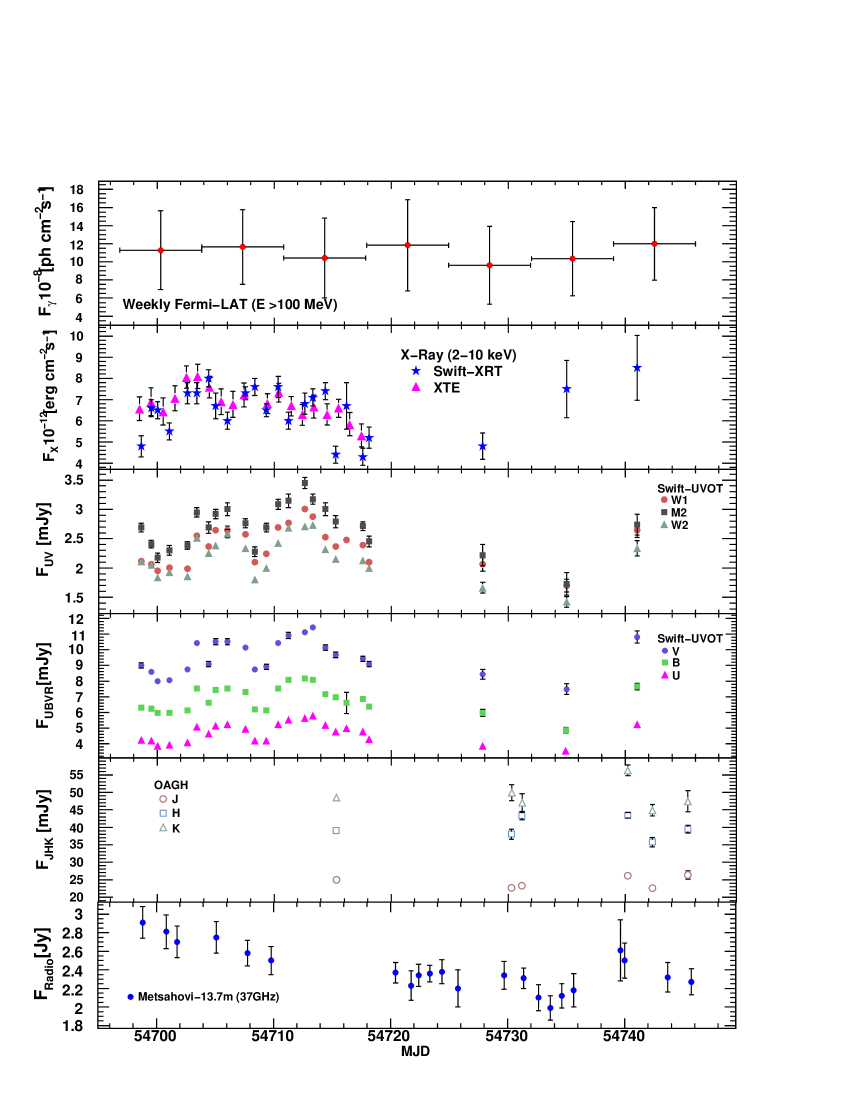
3.1. X-ray and UV observations and results
The RXTE/PCA space observatory performed sub-daily monitoring of BL Lac for 20 days, during the same epoch as LAT and Swift, for a total of 80 pointings between 2008 August 20 and September 9. Only PCU2 was active, for a total exposure of 157.3 ks. The PCA STANDARD2 data were reduced and analyzed with the routines in HEASOFT V6.8 using the filtering criteria recommended by the RXTE Guest Observer Facility. Only the top-layer events were processed, and a check was performed in the 40-100 keV range to assure that the model background reproduced the observed one. The average net count rate in the 3-18 keV band is cts s-1 pcu-1. The RXTE spectra were extracted and fitted separately for each pointing, and summed to obtain the average spectrum. Each spectrum is well-fit by a single power-law model with Galactic absorption. The Galactic was fixed at two values: that measured by Elvis et al. (1989), based on dedicated 21-cm observations ( cm-2); and the sum of this value with that inferred from millimeter observations (Lucas & Liszt, 1993), which includes the contribution from molecular hydrogen along the line of sight ( cm-2). In the RXTE band, however, this difference yields negligible effects, with a difference in spectral indices .
The RXTE data showed modest flux variations, with a rate which remained constant at cts s-1 up to MJD 54708, and slowly decreasing to cts s-1 towards MJD 54718. Spectral variations were modest as well, ranging from to . The total average spectrum is well-fit with a single power-law model, with , and an unabsorbed flux in the 2-10 keV band of erg cm-2 s-1 and (15 d.o.f.). This spectrum can also be fit by a concave log parabola or broken power-law model, with the slope hardening above 8-9 keV from to (); however, the low statistics do not allow one to determine if the improvement is significant, and the single, rather flat (, therefore ), power law gives a good fit.
In the context of the overall SED, the low X-ray flux and the spectrum (flat X-ray SED) is evidence that the RXTE band might correspond to the passage between the two humps of the blazars’ SED, as typical for ISPs. In the following we show that the Swift -XRT results provide us further evidence for this conclusion.


The Swift gamma-ray burst satellite (Gehrels et al., 2004) performed a daily monitoring simultaneous to RXTE and LAT observations for 20 days (from 2008 Aug. 20, 15:19 UT, to 2008 Sep. 09, 02:37 UT; MJD 54698.64 - 54718.11), plus 3 more separated observations after 18 September. Data reduction and analysis was performed running a processing script customized for the XRT and UVOT data (Donato et al., in preparation). The script reprocesses the Swift data, stored in the HEASARC archive using the standard HEASoft software (version 6.8) and the latest calibration database (20091130 for XRT and 20100129 for UVOT). The reduction of XRT data consists of running xrtpipeline, selecting only the events with 0-12 grades in photon counting mode (PC). The UVOT image mode data are processed following the steps reported in the UVOT Software Guide 2.2.
The XRT data analysis is performed using the script xrtgrblc, available in the HEASoft software package. In brief, the script selects the best source and background extraction regions based on the source intensity (a circle and an annulus, respectively). In the case of BL Lac, the source extraction region has typically a 55″radius and the background region has a 110″-210″inner-outer radius. Field sources are excluded applying circular masks whose radius depends on the field source intensity. Using these regions, source and background count rates, spectra and event lists are extracted. The net source count rate must be corrected for irregularities in the exposure map and the Point-Spread Function (PSF). The total correction factor is obtained using the HEASoft tool xrtlccorr.
The script that handles the UVOT analysis is uvotgrblc (available within HEASoft). It determines the presence of field sources and excludes them from the background region with circular regions whose sizes depend on their intensity. The optimal background region is chosen after comparing 3 annular regions centered on the main source in the summed images. The region with the lowest background is selected. The inner and outer radii are 27″and 35″, respectively, for all the filters except , for which the two radii are 35″and 42″. The source extraction region is also intensity dependent: The script selects the aperture size between 3″and 5″based on the observed source count-rate and the presence of close field sources. BL Lac is a relatively bright object and an extraction region of 5″is preferred. The field of view in the and filters is full of field sources and in particular there is a bright star east of the blazar. To avoid contamination from such a source, the extraction region is reduced to 3″. The script estimates the best source position using the task uvotcentroid and the photometry using the task uvotsource. The obtained values are already corrected for aperture effects while we used the dust maps of Schlegel et al. (1998) and the Milky Way extinction curve of Pei (1992) to compensate the Galactic extinction. XRT and UVOT light curves and SEDs are shown in Figures 4, 5, and 6.
As with the harder energy band with RXTE, BL Lac does not show any major sign of variability in the Swift-XRT data. The same Galactic ( cm-2) fixed value was used also for the XRT analysis. The 2-10 keV flux derived from Swift observations lies between 6 and 8 erg cm-2 s-1with a hint of a lower intensity at the end of the campaign when the flux was below erg cm-2 s-1. We found that in the day-by-day spectral analysis the photon index does not change significantly either. Using a single power-law model with fixed Galactic absorption, Leiden/Argentine/Bonn (LAB) Survey of Galactic HI (Kalberla et al., 2005) weighted average equal to cm-2), the slope varies between 1.75 and 2.06. Since the typical error on this parameter is of the order of 0.1, the variability is within 2 sigma.
The absence of spectral changes allows us to extract an accumulated spectrum. As a first step, a comparison of the XRT and RXTE spectra accumulated over the same period and using the same lower energy threshold of 3 keV results in very good agreement with the power-law photon index found by RXTE . The best fit in the 3-8 keV range is obtained with a power-law whose slope is 2.19. The 2-10 keV integrated flux is erg cm-2 s-1. The X-ray photon index is consistent within with the results obtained using RXTE data.

Using the entire XRT energy band from 0.3 to 10 keV (Figure 6) and profiting from the increased statistics (the spectrum is binned with 100 counts/bin), the spectral fit is more constrained and underlies two emission components: the best fit ( with 146 d.o.f.) is obtained with a broken power-law with the energy break located at 1.71 keV and fixed absorption at the Galactic value. The soft and hard photon indices are 2.57 and 2.09, respectively and therefore the break in this XRT spectrum is significant compared to the power law. The 0.3-10 keV integrated flux is erg cm-2 s-1.
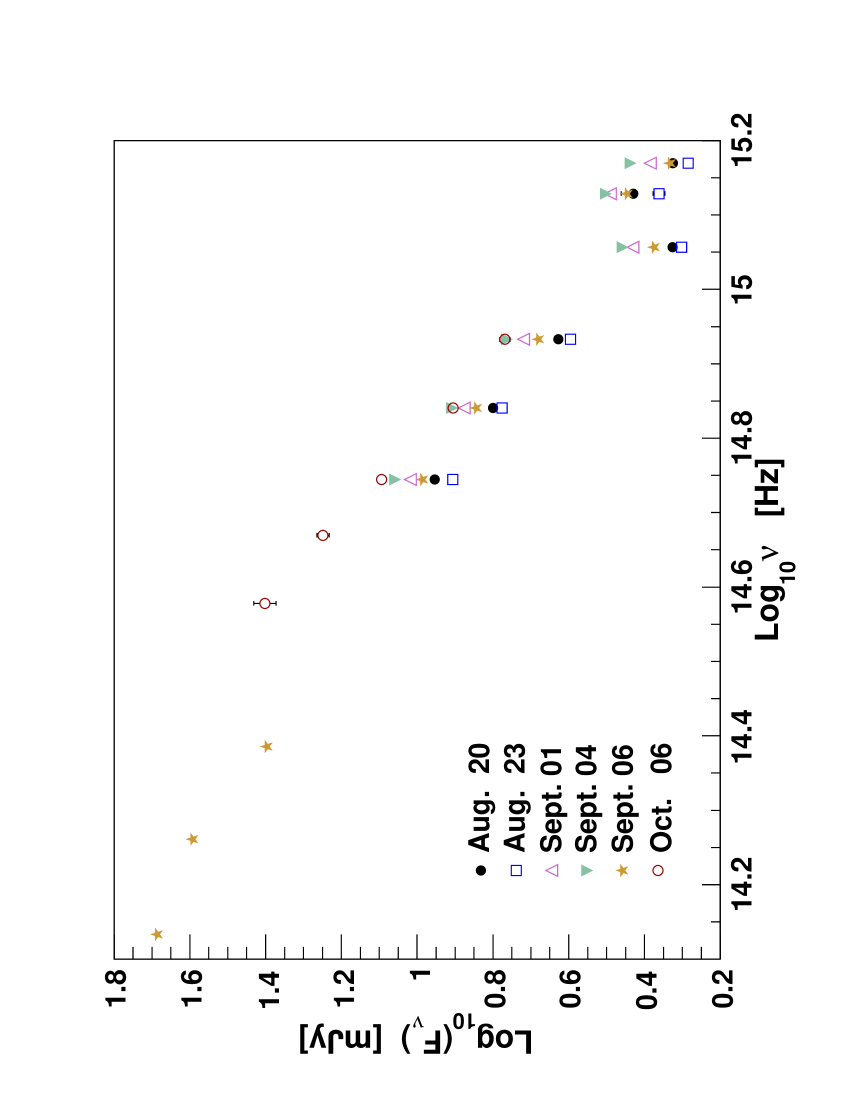
The UVOT optical-UV light curves showed some variability during the campaign period (Figure 4), but this is not well correlated with the X-ray or -ray emission (which is not variable). The daily simultaneous near-IR, optical, and UV SEDs, reconstructed thanks to UVOT, and OAGH observations (reported in Figure 5), showed no significant spectral variability and a trend consistent with a single power law except for the 2 higher frequency UV bands. This may be in agreement with the hypothesis of UV excess due to thermal emission from an accretion disk (Raiteri et al., 2009, 2010).
3.2. Radio band flux-structure observations and results
As part of an ongoing blazar monitoring program, the 37 GHz observations were made with the 13.7 m diameter Metsähovi radio telescope, which is a radome enclosed paraboloid antenna situated in Finland. The measurements were made with a 1 GHz-band dual beam receiver centered at 36.8 GHz. The high electron mobility pseudomorphic transistor front end operates at room temperature. The observations are ON–ON, alternating the source and the sky in each feed horn. A typical integration time to obtain one flux density data point is 1200–1400 s. The detection limit of the telescope at 37 GHz is on the order of 0.2 Jy under optimal conditions. Data points with a signal-to-noise ratio are handled as non-detections. The flux density scale is set by observations of DR 21. Sources 3C 84 and 3C 274 are used as secondary calibrators. A detailed description on the data reduction and analysis is given in Teräsranta et al. (1998). The error estimate in the flux density includes the contribution from the measurement rms and the uncertainty of the absolute calibration.
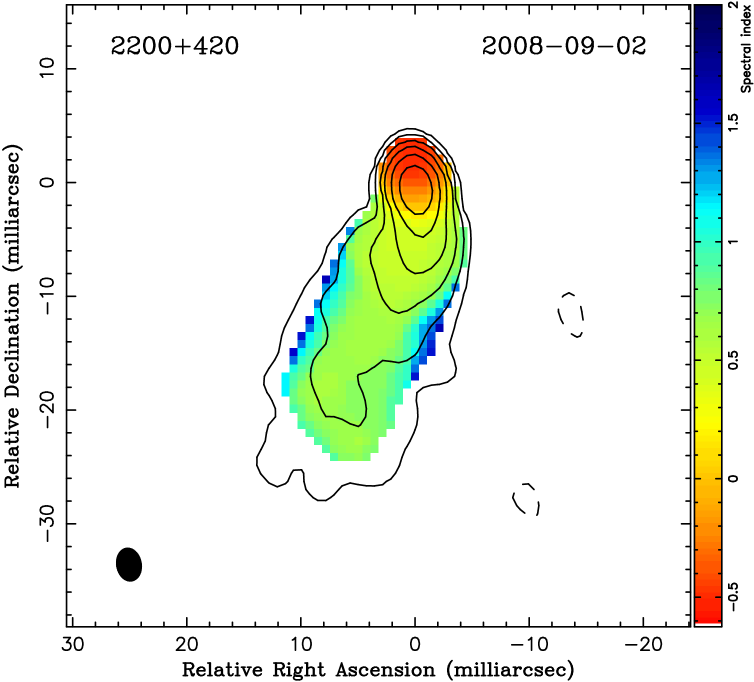
BL Lac was also observed with the Very Long Baseline Array (VLBA) at seven frequencies (4.6, 5.0, 8.1, 8.4, 15.4, 23.8 and 43.2 GHz) in the framework of a survey of parsec-scale radio spectra of twenty -ray bright blazars (Sokolovsky et al., 2010b). The multifrequency VLBA observation was carried out on 2008 September 2. The data reduction was conducted in the standard manner using the AIPS package (Greisen, 1990). The final amplitude calibration accuracy is estimated to be % at 4.6-15.4 GHz range and % at 23.8 and 43.2 GHz. The Difmap software (Shepherd et al., 1994) was used for imaging and modeling of the visibility data.
The VLBA images (Fig. 7, and 8) reveal a wide, rather smooth, curved jet extending mas (at 5 GHz) south-east from the bright compact core. A few distinct, bright emission features aligned along the south-southwest direction can be seen in the inner jet at higher frequencies. We have modelled the observed brightness distribution with a small number of model components having two-dimensional Gaussian profiles. The core region (i.e., the bright feature at the north end of the jet) is elongated in the 43 GHz image and can be modelled by two Gaussian components separated by 0.25 mas (0.32 pc projected distance). At a distances of 1.5 mas and 3.4 mas from the core, there are two other distinct emission features in the jet. A table listing the parameters of the distinct features (“components”) can be found in Sokolovsky et al. (2010b).
The inner 0.25 mas part of the jet (i.e., the “core”) may contain two (or more) distinct emission features or it may be a continuous emission region. The angular resolution even at 43 GHz is not sufficient to distinguish between these possibilities. However, it is evident that the radio spectrum is changing along this region and it cannot be described by a single, uniform, self-absorbed, synchrotron emitting component. A turnover caused by the synchrotron self-absorption is detected in the averaged core spectrum at a frequency of GHz (an average over the whole area with the negative spectral index at Fig. 8). Due to the inhomogeneity, the innermost component at mm-wavelengths most likely has an even higher turnover frequency, GHz. Using the method described in Sokolovsky et al. (2010b), the magnetic field, , of the core, in the frame of the relativistic jet, can be constrained, given the Doppler factor, , where and here are the bulk Lorentz factor and jet angle to the line of sight, respectively. Assuming a Doppler factor (Hovatta et al., 2009), an upper limit can be placed on the magnetic field strength in the core: G. We note that this upper limit corresponds to a typical value across an extended and inhomogeneous region contributing the bulk of the radio emission in 4.6 - 43 GHz range. The magnetic field strength can exceed the above limit locally or in a more compact regions hidden from sight in the observed frequency range by synchrotron opacity.
3.3. Optical and near IR observations and results
During the campaign several multi-band near-infrared and optical observations of BL Lac were also performed from the ground by the 2.1 m telescope of the OAGH observatory, Sonora, Mexico, and the 1.3 m McGraw-Hill Telescope of the MDM Observatory, Arizona, USA. In addition a long-term monitoring in optical and bands during the first 18 months of Fermi observations (Figure 2), was performed by the observing monitoring programs at the Tuorla Observatory (1 m Tuorla and 0.35 m KVA telescopes), Turku, Finland, and at the Steward Observatory (2.3 m Bok and 1.5 m Kuiper telescopes), USA respectively.
Optical () data were taken with the 1.3 m McGraw-Hill Telescope (MDM observatory). Exposure times ranged from 40 s ( band) to 120 s ( band). The raw data were bias and flat-field corrected using IRAF. Instrumental magnitudes of BL Lac and comparison stars B, C, H, and K of Smith et al. (1985) were extracted using DAOPHOT and subsequently converted to physical magnitudes through differential photometry.
INAOE (Instituto Nacional de Astrofísica, Óptica y Electrónica) operates the Observatorio Astrofísico Guillermo Haro (OAGH) located in the Mexican state of Sonora. The 2.1 m telescope of the OAGH has a current allocation of over 50 nights per semester dedicated to the study of -ray sources, through optical photometry and spectroscopy and infrared photometry. The Cananea Near Infrared Camera, CANICA, is equipped with a Rockwell pixel Hawaii infrared detector working at 75 K and standard , and bands. The plate scale in CANICA is 0.32 arcsec per pixel. Observations are usually carried out in series of 10 dithered frames in each filter. Data are co-added after bias and flat-field corrections. CANICA observations of BL Lac presented in this work were made on seven epochs between MJD 54715 and 54747. The data are shown in Figures 4 and 5, and do not show signs of variability.
The photometric and polarimetry monitoring program at the Tuorla Observatory, a division of the Department of Physics and Astronomy at the University of Turku, Finland, is performed through the 1.03 m telescope at Tuorla Observatory, and the 35cm telescope at the KVA observatory on La Palma, Canary islands, Spain. Most of the monitored sources are BL Lac objects listed in Costamante & Ghisellini (2002), as potential TeV -ray sources444http://users.utu.fi/kani/1m/. All photometric measures are taken using the R-filter (other details in Takalo et al., 2008).
The optical spectropolarimetry and spectrophotometry of blazars at the University of Arizona, is performed on a regular basis since the launch of Fermi using the Steward Observatory 2.3 m Bok telescope on Kitt Peak, Arizona, and 1.54 m Kuiper telescope on Mt. Bigelow, Arizona, USA. Depending on weather conditions, BL Lac is observed nightly during each of the monthly monitoring campaigns, which typically last a week. All of the measurements have been made with the SPOL spectropolarimeter (Schmidt et al., 1992). The Steward Observatory blazar monitoring program associated with the Fermi mission is described by Schmidt et al. (2009) and the data are publicly available555http://james.as.arizona.edu/~psmith/Fermi. Details concerning the reduction and calibration of both the polarimetry and photometry can also be found in Schmidt et al. (2009) and references therein. The data products include high signal-to-noise flux and linear polarization spectra spanning and differential V-band photometry.
3.4. Multifrequency correlation and SED
The optical - and -band light curve in the bottom panel of Figure 2 shows more rapid variability due to the increased sampling with respect to the weekly-averaged LAT light curve. Overlapping time intervals of the 18-month light curves in -rays and in the band were used to calculate the discrete cross correlation function (DCCF), following Edelson & Krolik (1988). In Figure 9 the DCCF is plotted with error bars estimated by a Monte Carlo method, taking measurement errors and data sampling into account (Peterson et al., 1998).

The correlation strength and lag were computed by fitting a gaussian profile to the DCCF between lag -20 to +20 days. The result was a correlation intensity of (corrected for the effect of measurement noise) and a lag of days, where negative lag means -rays lagging the band. The choice of lag range for the fit, from -15, +15 to -30, +30, as well as bin size, 3 or 4 days, only had a small effect on the estimated time lag of the peak and on the correlation strength, with the latter ranging from 0.14 to 0.17. The rather weak long-term correlation between gamma-rays and optical tends to disfavor a one-zone synchrotron plus synchrotron self-Compton (SSC) model, since in this model one would expect electrons with approximately the same energies to make both the optical and -ray emission, and might favor an external radiation Compton (ERC) or multi-zone synchrotron/SSC model (e.g., Aharonian et al., 2009; Böttcher et al., 2009).
The optical-UV variability observed during the 48 days of the multiwavelength campaign is not correlated with the weaker X-ray variability seen by Swift -XRT and RXTE nor with the non-variable -ray emission observed in the same period by the LAT (Figure 4). The lack of correlation might support the scenario where both synchrotron and IC photons contribute to the X-ray emission. Variability produced by the highest energy electrons would be smeared out by the IC component, and the mix of photons from the low and high energy component would dilute the correlation with the synchrotron, or synchrotron plus thermal, optical-UV emission. This would explain why variability in the optical/UV is greater than in X-rays. Moreover if the synchrotron and IC emission components come from physically distinct regions, they would also weaken the correlation. No evidence for a contribution by accretion disk radiation during this low activity state of the campaign was found, although this might contribute to the lack of clear correlation between the X-ray and optical-UV emission. The recent discovery of a luminous emission line in the optical spectra of BL Lac (Vermeulen et al.,, 1995; Corbett et al.,, 1996, 2000; Capetti et al., 2010), as likely a product of the broad line region photoionized by the disk radiation, can suggest a more relevant role played by the disk during major outburst with a high -ray Compton dominance (as seen in the EGRET 1997 outburst).
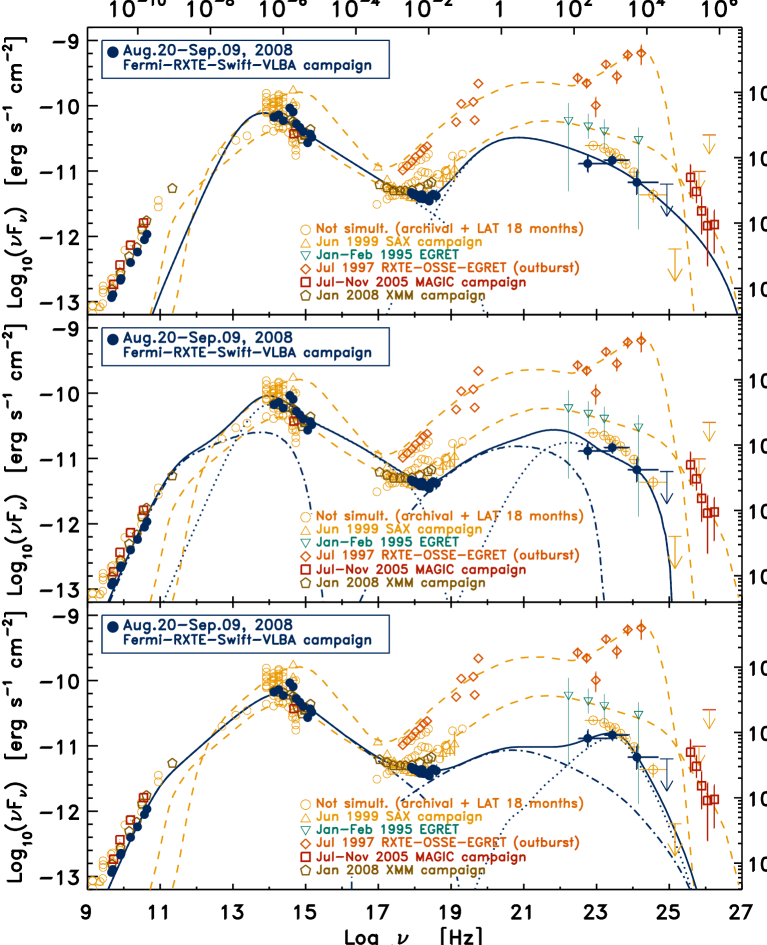
The averaged SED from the MW campaign(2008 Aug. 20 – Sep. 9) is reported in Figure 10. For the first time the multi-frequency emission for the eponymous blazar source BL Lac is mapped from radio to GeV -rays during a low-activity state. The relevant archival observations of BL Lac are also reported in this figure for comparison in addition to our data. The difference in -ray integrated flux with respect to the outburst state of 1997 measured by EGRET is about 15 times lower.
The XRT spectral results are in agreement with the RXTE results in the common energy range 2-10 keV, and with the usual SED properties of ISP blazars. In fact the confirmation of a flat X-ray SED ( ) of moderate flux level with both instruments in such range, makes us more confident the X-rays are from a transition region between the synchrotron and inverse Compton energy components. In addiction, as reported in Section 3.1, the whole 0.3-10 keV range spectrum accumulated during the campaign by Swift -XRT showed a broken power-law best fit, i.e. a steeper soft X-ray spectral slope which should be the tail of the synchrotron emission and a flatter slope above 3 keV, which should be the first part of the IC energy component.
The LAT -ray spectrum accumulated in 18-months is reported as well for comparison (open/orange circles representing non simultaneous data in Fig. 10).
A single-zone synchrotron self-Compton (SSC) description, usually successful for TeV blazars, has been used to model also the SED of this eponymous BL Lac in the past (Ravasio et al., 2002, 2003), and is thus the first step in the attempt to reproduce its broadband emission. This model (Finke et al., 2008) is applied to the SED of BL Lac (blue/dark thick line on the top panel of Figure 10). The energetic blob is modeled with Doppler factor , comoving radius cm, (which is consistent with a 2 hour variability time observed in the source on previous occasions), and tangled magnetic field of intensity G. The electron distribution has the form of a broken power law, so that for , and for where is the electron Lorentz factor. The best fit electron indices were found to be and , which is consistent with electrons in the fast cooling regime. It is interesting to note that is well constrained, for a given a blob size, by the X-ray observations, and thus it is impossible for this model to reproduce the radio points. This means that, if this model is correct, the emitting region must be closer to the black hole than the radio photosphere. In this model the Poynting flux power and the kinetic power in relativistic electrons are erg s-1 and erg s-1, respectively, implying an equipartition fraction . This is well below the equipartition value, which may be argued as a reason to disfavor this model. In this case the Doppler factor is considerably higher than the radio-variability Doppler factor reported in Hovatta et al. (2009), although they evaluated that from the estimated timescale of each radio flare component and the known brightness temperature, referred therefore to a much larger region beyond the radio photosphere than this model suggests.
Since the one-zone SSC model has difficulty reproducing the variability of this source and giving reasonable energetics ( substantially below 1), as further step we attempt a fit with a two-zone SSC model (blue/dark thick line in the central panel of Figure 10), using two emitting blobs via SSC emission: a compact and faster emission region and a larger, slower and diluted region accounting also for the radio-band emission. The energetic blob responsible for most of the emitted power and originating in a limited part of the jet is modeled with , cm, G. The radio-band and hard X-ray emission is reproduced using a much larger emitting region characterized by parameter values , cm, and G. Doppler factors of the two zones are found to be closer to the average value () found in previous years by Hovatta et al. (2009) than the one-zone SSC model presented above. The kinetic partial differential equation of this model describes the evolution of the particle energy distribution after the injection of shock-accelerated electrons, with a rate equal to a power law with an exponential cutoff: , , where , between and . More details on the numerical model can be found in (Ciprini, 2008, 2010). For the compact region (1) we obtain and with soft injection index , and erg s-1, erg s-1, implying an equipartition fraction . Considering the larger diluted region (2) we obtain and with injection index , and erg s-1, erg s-1, implying an equipartition fraction . In this case for the two regions the total , a value slightly closer to energy equipartition than the one-zone model. The hypothesis of two synchrotron components present at different distances from the nucleus of BL Lac and accounting for the optical and the X-ray spectra respectively, was suggested in the past in Ravasio et al. (2003). In our case X-rays could be considered produced from both the emitting regions (central panel of Figure 10), and this can explain the lack of evident correlation between UVOT and XRT/RXTE light curves. On the other hand the fact that the variations in -rays are not seen, or not resolved by the LAT, contrary to the optical-UV variable flux, tell us that the two-zone pure SSC model does not explain the multifrequency light curve of Figure 4 observed in BL Lac during the campaign, although the energetics is closer to (and above) equipartition with respect to the previous single-zone model.
SSC emission with the relevant addition of external radiation Compton (ERC) emission was used to explain the large Compton dominance of BL Lac during the 1997 -ray outburst recorded by EGRET (Bloom et al.,, 1997; Madejski et al., 1999; Böttcher & Bloom, 2000; Ravasio et al., 2002; Böttcher & Reimer, 2004). An accretion disk emitting component, and emission lines were also observed several times in this blazar (Vermeulen et al.,, 1995; Corbett et al.,, 1996, 2000; Capetti et al., 2010). The SSC plus ERC hybrid model, where X-ray emission is produced via the SSC mechanism and the GeV -ray emission is produced by ERC, was used by Madejski et al. (1999) for this source. This motivates its use to see if it is able to reproduce also the 2008 low state of BL Lac. A model fit to this SED is shown as the blue/dark thick line of the bottom panel of Figure 10. For this model fit an equilibrium version of the time-dependent jet model reported in Böttcher & Chiang, (2002) was used. A power-law distribution of electrons, , with lower and upper cut-off and , respectively, and injection index is injected into a compact region of radius cm, moving relativistically along the jet, oriented at an angle with respect to the line of sight, with bulk Doppler factor and tangled magnetic field intensity G. The instantaneous electron injection is self-consistently balanced with particle escape on a time scale , where is a free parameter, and radiative cooling through synchrotron, SSC and ERC emission. For the ERC emission, both the direct accretion disk radiation field and accretion disk emission reprocessed in the BLR are taken into account, although for our fit, the BLR-reprocessed radiation strongly dominates the radiation which is directly from the disk. We assume an accretion disk luminosity of erg s-1, and an emitting region distance from the black hole of pc. The BLR is represented as a spherical shell of reprocessing material with radial Thomson depth , located at a distance pc from the central black hole. Although the model fits the radio data well, the assumed distance from the black hole within the BLR implies that the blazar region is well within the radio-band photosphere. The numerical model self-consistently evaluates the energy content in the resulting equilibrium electron distribution, and compares this value to the magnetic-field energy density. This model gives erg s-1 and , and ratio . This is closer to equipartition than the one- and two-zone pure SSC models described above. Considering the equipartition ratio the differences between the two-zones SSC and the ERC scenario do not appear particularly significant because of the uncertainties in the estimate of this parameter, but the uncorrelated variability can still be explained more easily in the ERC scenario.
The parameters used for the three SED models that are shown in Figure 10 are in agreement with the limit on the magnetic field obtained from the VLBA observations, while the Doppler factors used in the two-zone SSC are in better agreement with the value extracted from radio-band structure historical observations. The magnetic field and Doppler factor could be different for the -ray emitting region than for the radio core region described in section 3.2, since the -ray emittion region could be from a smaller region than the radio core, closer to the black hole. A ERC+SSC model can produce more complex SEDs and less correlated variability patterns, partly because of variability in the external radiation field. The emission region could move through an inhomogeneous radiation field, when it leaves the BLR. Synchrotron and SSC depend on the magnetic field, while the ERC component does not. Therefore, magnetic field fluctuations may also produce uncorrelated variability patterns between optical - X-rays (SSC) on the one hand and -rays (ERC) on the other.
4. Conclusions
This is the first broad-band multifrequency campaign investigating the low activity state of BL Lac. This eponymous source is also peculiar, sometimes showing a rather complex SED profile, a behavior similar to an FSRQ (Vermeulen et al.,, 1995; Madejski et al., 1999), and being detected also by VHE Cherenkov telescopes like MAGIC above 200 GeV. We observed a -ray flux ( MeV) during the 48-day multifrequency campaign (planned intensive campaign, PIC) of 2008 about 15 times lower than the level measured by EGRET during the 1997 outburst, and lower than the 1995 EGRET observations. This value and the weekly light curve of this campaign interval indicates a quiescent -ray state. The average LAT spectrum accumulated during the first 18 months of survey showed evidence for curvature. The single photon of maximum energy detected by the LAT during these months was measured at 70 GeV, with a spectrum that could extend into the VHE range. The weekly light curve is characterized by at least two mild flares on the 1-week timescale (in the middle of 2009 April and the end of 2010 January).
During the PIC the low luminosity and non-variable -ray state did not correspond to the lowest luminosity state for near-IR and optical emission. No evidence for clear correlation between the low-energy emission component (radio to UV bands) and the high-energy emission component (X-ray to -ray bands) was found. Since one would expect correlated variability between these components in a one-zone SSC scenario, a fit with a two-zone SSC model was attempted. This model as well is not able to explain the variable optical and UV emission seen by Swift corresponding to the non-variable -ray emission during the coordinated campaign. Therefore a hybrid SSC+ERC model was better able to reproduce the SED being closer to energy equipartition and providing a possible explanation of the uncorrelated variability.
This result tells us that the SSC+ERC model is valid for BL Lac also during low brightness states (strengthening the quasar-like, FSRQ, view of this blazar). The two-zone SSC model might still be a possibility for this blazar (as suggested, for example in Ravasio et al., 2003). Other blazars like S5 0716+71 appear to have evidence for two synchrotron components (Giommi et al., 2008; Chen et al., 2008). In 3C 454.3, the prototypical FSRQ, a two-zone synchrotron scenario is inferred by the variability of the dust IR emission bump resolved by Spitzer (Ogle et al., 2010). Therefore, as suggested in the past, BL Lac, a rather special object with a possible Seyfert-like nucleus, might be considered a miniature and real FSRQ (Vermeulen et al.,, 1995; Corbett et al.,, 1996; Madejski et al., 1999; Corbett et al.,, 2000; Capetti et al., 2010).
A multi-frequency VLBA observation performed during this campaign demonstrated that the bright, innermost part of the radio-mm jet (“the core”) cannot be described by a single, uniform, self-absorbed, synchrotron emitting blob, but rather an inhomogeneous region with spatially changing spectral properties. The synchrotron self-absorption turnover is detected in the VLBA data which allows us to constrain the average magnetic field in the core region to be less than 3 G, assuming a particular Doppler factor from previous radio single-dish observations. SED model values are in agreement with this limit, although this is not strictly necessary since the models assume emission from a region closer to the black hole than the radio core.
Another interesting discovery was that during the campaign, BL Lac continued to show a broken, concave X-ray spectrum, as seen by the Swift -XRT. This was not confirmed by RXTE , probably because of the differing energy range and worse sensitivity of this instrument, but the photon index is in agreement with this view. We note that the RXTE spectrum was mostly consistent with the XRT one. Both instruments observed an X-ray spectrum with small day-to-day X-ray photon index variations during this low-activity state. The concave spectrum and lack of spectral index variation is believed to be a typical signature of intermediate energy peaked blazars, and we find it exists even during non-flaring states.
5. Acknowledgments
The Fermi -LAT Collaboration acknowledges generous ongoing support from a number of agencies and institutes that have supported both the development and the operation of the LAT as well as scientific data analysis. These include the National Aeronautics and Space Administration and the Department of Energy in the United States, the Commissariat à l’Energie Atomique and the Centre National de la Recherche Scientifique / Institut National de Physique Nucléaire et de Physique des Particules in France, the Agenzia Spaziale Italiana and the Istituto Nazionale di Fisica Nucleare in Italy, the Ministry of Education, Culture, Sports, Science and Technology (MEXT), High Energy Accelerator Research Organization (KEK) and Japan Aerospace Exploration Agency (JAXA) in Japan, and the K. A. Wallenberg Foundation, the Swedish Research Council and the Swedish National Space Board in Sweden.
Additional support for science analysis during the operations phase is gratefully acknowledged from the Istituto Nazionale di Astrofisica in Italy and the Centre National d’Études Spatiales in France.
S.C. acknowledges funding by grant ASI-INAF n.I/047/8/0 related to Fermi on-orbit activities.
This work includes observations obtained with the NASA Swift gamma-ray burst Explorer. Swift is a MIDEX Gamma Ray Burst mission led by NASA with participation of Italy and the UK. This work includes observations obtained with NASA Rossi XTE satellite. The ASM/RXTE teams at MIT and at the RXTE Science Operation Facility and Guest Observer Facility at NASA’s GSFC are gratefully thanked. This work includes observations obtained with the Very Long Baseline Array, USA (project code BK150). The National Radio Astronomy Observatory (NRAO VLBA) is a facility of the National Science Foundation operated under cooperative agreement by Associated Universities, Inc. This work includes observations obtained with the 14 m Metsähovi Radio Observatory, a separate research institute of the Helsinki University of Technology. The Metsähovi team acknowledges the support from the Academy of Finland to our observing projects (numbers 212656, 210338, and others). This work includes observations obtained through the Tuorla Blazar Monitoring Program, carried out with the KVA telescope on La Palma, Canary Islands and the 1 m telescope at Tuorla. Tuorla Observatory is a division of the Department of Physics and Astronomy at the University of Turku, Finland. This work includes observations obtained through the optical monitoring of BL Lac and other blazars using the 2.3 m Bok and 1.54 m Kuiper telescopes of Steward Observatory that is supported by NASA/Fermi Guest Investigator grants NNX08AW56G and NNX09AU10G. This work includes observations obtained with the 2.1 m telescope of the OAGH Observatorio Astrofísico Guillermo Haro, in the state of Sonora, Mexico, operated by the Instituto Nacional de Astrofísica, Óptica y Electrónica (INAOE), Mexico. This work includes observations obtained with the 1.3 m McGraw-Hill Telescope of the Michigan-Dartmouth-MIT (MDM) observatory, operated by University of Michigan, Dartmouth College, Ohio State University, Ohio University, Columbia University, in Arizona, USA.
The Fermi LAT Collaboration extend thanks to the anonymous referee who made useful comments.
Facilities: Fermi, VLBA, RXTE, Swift
References
- Abdo et al. (2010a) Abdo, A. A., et al. 2010a, ApJ, 716, 30
- Abdo et al. (2010b) Abdo, A. A., et al. 2010b, ApJS, 188, 405 ApJ, 710, 1271
- Abdo et al. (2010d) Abdo, A. A., et al. 2010d, ApJ, 722, 520 2009, ApJ, 707, 612
- Aharonian et al. (2009) Aharonian, F., et al. 2009, ApJ, 696, L150
- Atwood et al. (2009) Atwood, W. B., et al., 2009, ApJ, 697, 1071
- Albert et al. (2007) Albert, J., et al. 2007, ApJ, 666, L17
- Bach et al. (2006) Bach, U., et al. 2006, A&A, 456, 105
- Bloom et al., (1997) Bloom, S. D., et al., 1997, ApJ, 490, L145
- Böttcher & Bloom (2000) Böttcher, M., & Bloom, S. D. 2000, AJ, 119, 469
- Böttcher & Chiang, (2002) Böttcher, M., & Chiang, J., 2002, ApJ, 581, 127
- Böttcher et al. (2003) Böttcher, M., et al. 2003, ApJ, 596, 847
- Böttcher & Reimer (2004) Böttcher, M., & Reimer, A. 2004, ApJ, 609, 576
- Böttcher et al. (2009) Böttcher, M., Reimer, A., & Marscher, A. P. 2009, ApJ, 703, 1168
- Capetti et al. (2010) Capetti, A., Raiteri, C. M., & Buttiglione, S. 2010, A&A, 516, A59
- Catanese et al. (1997) Catanese, M., et al. 1997, ApJ, 480, 562
- Chen et al. (2008) Chen, A. W., et al. 2008, A&A, 489, L37
- Ciprini (2008) Ciprini, S. 2008, in proc. of Blazar Variability across the Electromagnetic Spectrum, PoS(BLAZARS2008), n.073
- Ciprini (2010) Ciprini, S. 2010, Mem. Soc. Astronom. It. Supplements, 14, 262
- Costamante & Ghisellini (2002) Costamante, L., & Ghisellini, G. 2002, A&A, 384, 56
- Corbett et al., (1996) Corbett, E. A. et al. 1996, MNRAS, 281, 737
- Corbett et al., (2000) Corbett, E. A., Robinson, A., Axon, D. J., & Hough, J. H., 2000, MNRAS, 311, 485
- Denn et al., (2000) Denn, G. R., Mutel, L. R., & Marscher, A. P., 2000, ApJS, 129, 61
- Edelson & Krolik (1988) Edelson, R. A., & Krolik, J. H. 1988, ApJ, 333, 646
- Elvis et al. (1989) Elvis, M., Wilkes, B. J., & Lockman, F. J. 1989, AJ, 97, 777
- Finke et al. (2008) Finke, J. D., Dermer, C. D., Böttcher, M. 2008, ApJ, 686, 181
- Fossati et al. (1998) Fossati, G., Maraschi, L., Celotti, A., Comastri, A., & Ghisellini, G., 1998, MNRAS, 299, 433
- Gehrels et al. (2004) Gehrels, N., et al. 2004, ApJ, 611, 1005
- Giebels & Degrange (2009) Giebels, B., & Degrange, B. 2009, A&A, 503, 797
- Giommi et al. (2008) Giommi, P., et al. 2008, A&A, 487, L49
- Greisen (1990) Greisen, E. W. 1990, Acquisition, Processing and Archiving of Astronomical Images, 125
- Lucas & Liszt (1993) Lucas, R., & Liszt, H. S. 1993, A&A, 276, L33
- Hovatta et al. (2009) Hovatta T., Valtaoja E., Tornikoski M., Lähteenmäki A., 2009, A&A, 494, 527
- Kalberla et al. (2005) Kalberla, P. M. W., Burton, W. B., Hartmann, D., Arnal, E. M., Bajaja, E., Morras, R., Pöppel, W. G. L. 2005, A&A, 440, 775
- Komatsu et al. (2009) Komatsu, E., Dunkley, J., Nolta, M. R., et al. 2009, ApJS, 180, 330
- Kranich (2003) Kranich, D. 2003, ASP Conf. Proc. 299, High Energy Blazar Astronomy, 3
- Lister et al. (2009) Lister, M. L., Cohen, M. H., Homan, D. C., Kadler, M., Kellermann, K. I., Kovalev, Y. Y., Ros, E., Savolainen, T., Zensus, J. A. 2009, AJ, 138, 1874
- Madejski et al. (1999) Madejski, G. M., Sikora, M., Jaffe, T., Błażejowski, M., Jahoda, K., & Moderski, R. 1999, ApJ, 521, 145
- Marscher et al. (2008) Marscher, A. P., et al. 2008, Nature, 452, 966
- Mattox et al. (1996) Mattox, J. R., Bertsch, D. L., Chiang, J., et al. 1996, ApJ, 461, 396
- Nandikotkur et al. (2007) Nandikotkur, G., Jahoda, K. M., Hartman, R. C., Mukherjee, R., Sreekumar, P., Böttcher, M., Sambruna, R. M., & Swank, J. H. 2007, ApJ, 657, 706
- Nesci et al. (1998) Nesci, R., Maesano, M., Massaro, E., Montagni, F., Tosti, G., & Fiorucci, M. 1998, A&A, 332, L1
- Neshpor et al. (2001) Neshpor, Y. I., Chalenko, N. N., Stepanian, A. A., Kalekin, O. R., Jogolev, N. A., Fomin, V. P., & Shitov, V. G. 2001, Astronomy Reports, 45, 249
- Ogle et al. (2010) Ogle, P. M., Wehrle, A. E., Balonek, T., & Gurwell, M. A. 2010, ApJS, submitted (arXiv:1003.3642)
- Padovani & Giommi (1995) Padovani, P., & Giommi, P. 1995, ApJ, 444, 567
- Pei (1992) Pei, Y. C. 1992, ApJ, 395, 130
- Peterson et al. (1998) Peterson, B. M., Wanders, I., Horne, K., Collier, S., Alexander, T., Kaspi, S., & Maoz, D. 1998, PASP, 110, 660
- Raiteri et al. (2009) Raiteri, C. M., et al. 2009, A&A, 507, 769
- Raiteri et al. (2010) Raiteri, C. M., et al. 2010, A&A, 524, A43
- Ravasio et al. (2002) Ravasio, M., et al. 2002, A&A, 383, 763
- Ravasio et al. (2003) Ravasio, M., Tagliaferri, G., Ghisellini, G., Tavecchio, F., Böttcher, M., & Sikora, M. 2003, A&A, 408, 479
- Sambruna et al., (1999) Sambruna, R., et al., 1999, ApJ, 515, 140
- Schlegel et al. (1998) Schlegel, D. J., Finkbeiner, D. P., & Davis, M. 1998, ApJS, 500, 525
- Schmidt et al. (1992) Schmidt, G. D., Stockman, H. S., & Smith, P. S. 1992, ApJ, 398, L57
- Schmidt et al. (2009) Smith, P.S., Montiel, E., Rightley, S., Turner, J., Schmidt, G.D., & Jannuzi, B.T. 2009, 2009 Fermi Symposium, eConf Proceedings C091122, (arXiv:0912.3621)
- Shepherd et al. (1994) Shepherd M.C., Pearson T.J., & Taylor G.B., 1994, BAAS, 26, 987
- Smith et al. (1985) Smith, P. S., Balonek, T. J., Heckert, P. A., Elston, R., & Schmidt, G. D. 1985, AJ, 90, 1184
- Sokolovsky et al. (2010a) Sokolovsky, K. V., Schinzel, F. K., & Wallace, E. 2010a, The Astronomer’s Telegram, 2402, 1
- Sokolovsky et al. (2010b) Sokolovsky, K. V., Kovalev, Y. Y., Lobanov, A. P., Savolainen, T., Pushkarev, A. B., & Kadler, M. 2010b, arXiv:1001.2591
- Takalo et al. (2008) Takalo, L. O., Nilsson, K., Lindfors, E., Sillanpää, A., Berdyugin, A., & Pasanen, M. 2008, AIP Conference Series, 1085, 705
- Teräsranta et al. (1998) Teräsranta, H., Tornikoski, M., Mujunen, A., et al. 1998, A&AS, 132, 305
- Thompson (2007) Thompson, D. J. 2007, AIP Conf. Proc., 921, 86
- Tosti et al. (1999) Tosti, G., Luciani, M., Fiorucci, M. et al. 1999, Mem. Soc. Astron. Italiana, 70, 237
- Tosti (2007) Tosti, G. 2007, AIP Conf. Proc., 921, 255
- Vaughan et al. (2003) Vaughan, S., Edelson, R., Warwick, R. S., & Uttley, P. 2003, MNRAS, 345, 1271
- Vermeulen et al., (1995) Vermeulen et al. 1995, ApJ, 452, 5
- Villata et al. (2002a) Villata, M., et al. 2002a, A&A, 390, 407
- Villata et al. (2002b) Villata, M., et al. 2002b, Mem. Soc. Astron. Italiana, 73, 1191
- Villata et al. (2004a) Villata, M., et al. 2004a, A&A, 421, 103
- Villata et al. (2004b) Villata, M., et al. 2004b, A&A, 424, 497
- Villata et al. (2009) Villata, M., et al. 2009, A&A, 501, 455