Luminosity function of faint Galactic sources in the Chandra bulge field
Abstract
We study the statistical properties of faint X-ray sources detected in the Chandra Bulge Field. The unprecedented sensitivity of the Chandra observations allows us to probe the population of faint Galactic X-ray sources down to luminosities erg s-1 at the Galactic Center distance. We show that the luminosity function of these CBF sources agrees well with the luminosity function of sources in the Solar vicinity (Sazonov et al. 2006). The cumulative luminosity density of sources detected in the CBF in the luminosity range erg s-1 per unit stellar mass is erg s-1 . Taking into account sources in the luminosity range erg s-1 from Sazonov et al. (2006), the cumulative luminosity density in the broad luminosity range erg s-1 becomes erg s-1 per . The majority of sources with the faintest luminosities should be active binary stars with hot coronae based on the available luminosity function of X-ray sources in the Solar environment.
1 Introduction
The hot interstellar plasma in galaxies (see e.g. Forman, Jones, & Tucker 1985) provides a valuable tool to probe different galactic phenomena, including energy and mass ejection from supernova explosions (e.g. Loewenstein & Mathews 1991; Maíz-Apellániz 2001; Strickland & Heckman 2007), AGN activity (e.g. Padovani & Matteucci 1993; Forman et al. 2005), and the contribution of non-thermal pressure in hot atmospheresChurazov et al. (2010). However, before one can study the genuine X-ray emission of the hot interstellar plasma in early type galaxies, one must excise or account in some manner for the contribution of other constituents of galaxy emission. Revnivtsev et al. (2008) summarized the contributions from low mass X-ray binaries (see also Gilfanov 2004) and the fainter emission from the population of unresolved cataclysmic variables (CVs) and coronally active binary stars (ABs) (see Revnivtsev for a discussion of the origin of the faint diffuse emission).
The appearance of the latest generation of X-ray observatories with fine angular resolution (e.g., as high as from the Chandra X-ray Observatory) provides the possibility to subtract/mask the contribution of the brightest X-ray binaries in nearby galaxies. The contribution of fainter X-ray binaries is often estimated via extrapolation of the observed luminosity function of bright sources towards lower luminosities (e.g. Sarazin, Irwin, & Bregman 2001), which Gilfanov (2004) has shown to be a good estimator for this component.
In the past, is has also been assumed that all emission lines at energies 1-1.5 keV, visible in the spectra of galaxies, originate in a hot interstellar plasma (e.g. Sarazin, Irwin, & Bregman 2001; Irwin, Sarazin, & Bregman 2002; David et al. 2006). However, it is now clear (see (Revnivtsev et al. 2006; Sazonov et al. 2006; Revnivtsev et al. 2007, 2008, 2009, 2010)) that faint discrete galactic X-ray sources, namely cataclysmic variables and coronally active (usually binary) stars, provide an important contribution to the X-ray emission of galaxies (after subtraction of the contribution from the brightest sources) and this should be taken into account. Moreover, as the X-ray emission from these stars naturally includes a contribution from optically thin plasma of moderate or low temperatures, their spectra contain exactly the same lines that are usually thought to originate in the interstellar plasma.
Until now we have had very limited knowledge of the broad band luminosity function of the population of faint Galactic X-ray sources (however, there are studies of different sub-populations, see e.g. Pallavicini et al. 1981; Worrall & Marshall 1983; Hünsch et al. 1999; Schwope et al. 2002). Essentially, the best available broad band ( erg s-1 erg s-1) luminosity function was derived from all sky surveys of RXTE and ROSAT observatories by Sazonov et al. (2006). Deep Chandra observations of the peculiar Galactic Center region (Revnivtsev, Vikhlinin, & Sazonov 2007) added strong new support to the universality of the luminosity function over the entire Galaxy.
Now, the new 1 Ms Chandra observation of the galactic bulge region – the Chandra bulge field (CBF) (see Revnivtsev et al. 2009, 2010) – allows us to probe the luminosity function of Galactic X-ray sources (mostly the old stellar population because sources are located in the Galactic bulge region, see Revnivtsev et al. 2010) to remarkably low luminosities. In particular, in the CBF, we can probe to erg s-1 at the Galactic Center distance and thus to compare the derived luminosity function to that derived from the Solar vicinity (Sazonov et al. 2006)
In this paper we explore the statistical properties of the discrete sources detected in the CBF and present their luminosity function and cumulative emissivity.
2 Data preparation
2.1 Chandra data
We used all Chandra ACIS-I observations of the CBF (observation ID #5934, 6365, 6362, 9500, 9501, 9502, 9503, 9504, 9505, 9854, 9855, 9892, 9893) with total effective exposure time ks. The Chandra data were reduced following the standard procedure fully described in Vikhlinin et al. (2005). The detector background was modeled using the stowed dataset (http://cxc.harvard.edu/contrib/maxim/stowed). In this work we restrict our study to the circular region of arcmin-radius around , , close to the telescope optical axis (the region dubbed HRES in Revnivtsev et al. 2009), optimizing the angular resolution of the instrument and thus its sensitivity.
To further enhance the sensitivity of the observation, we have searched for sources in the summed image of the HRES region in the broad 0.5–7 keV energy band. The sensitivity limit is erg s-1 cm-2. It is calculated for the energy spectrum of photons collected within the CBF in the energy band 0.5–7 keV, approximated by a combination of models mekal with keV (abundance of elements was fixed at 0.1 of the Solar value) and bremss with keV from the XSPEC package – the simplest model which allows us to reproduce the broad band properties of the energy spectrum. Our model also includes interstellar absorption with column density cm-2. This value of interstellar absorption towards the CBF is adopted based on the results of Hong et al. (2009), measurements of in Revnivtsev, Burenin, & Sazonov 2009; Revnivtsev et al. 2010, and the ratio from Predehl & Schmitt 1995.

Energy spectrum, collected from HRES is presented in Fig.1. Contribution of mekal spectral component to total 0.5–7 keV flux is erg s-1 cm-2 , contribution of bremss spectral component is erg s-1 cm-2 .
The adopted sensitivity limit corresponds to a minimum detectable unabsorbed luminosity erg s-1 at a source distance of 8 kpc, at which most of the Galactic objects in this field are expected to reside. In total, we have detected 473 sources with statistical significance (minimum number of counts per source is about 10). Statistical significance of detection was calculated with the help of numerical simulations of the image taking into account the background and the exposure map.
Due to the significant interstellar absorption of X-rays in the CBF and the great diversity of spectral shapes of detected sources (e.g., the 2–7 keV/0.5–2 keV hardness ratio of cataclysmic variables and coronally active stars may differ by more than an order or magnitude), it is hard to make a definitive conversion of source count rates observed by Chandra into intrinsic fluxes and luminosities in the broad 0.5–10 keV energy band. Therefore, despite the detection of sources in the broad energy band 0.5–7 keV, we present here only statistics of sources for the energy band 2–10 keV. Technically, the source fluxes were measured by Chandra in the energy band 2–7 keV and subsequently recalculated into the 2–10 keV energy band assuming the simple analytic form of the spectral fit described above, appropriate for the summed spectrum of all sources. We find that 1 count in the range 2–7 keV per image (898 ks effective live time) corresponds to a source flux erg s-1 cm-2 in the energy band 2–10 keV.
2.2 Stellar mass profile along the line of sight
According to statistics of X-ray sources in the Solar vicinity (Sazonov et al. 2006), the majority of sources with luminosities erg s-1 are old binaries, including magnetic and non-magnetic cataclysmic variables, RS CVn systems, Algol-type binaries, W UMa-typa binaries. This allows us to safely assume that their density distribution is directly proportional to the stellar mass density distribution in the CBF. Therefore, it is useful to obtain the luminosity function of sources in the CBF normalized to the total mass of stars within the studied volume.
The stellar density distribution along the line of sight in the CBF was previously studied in Revnivtsev et al. (2010). The main substructures of the Galaxy visible in the CBF are the Galactic disk, the Galactic bulge and the nuclear stellar disk (NSD). The majority of sources reside in the Galactic bulge and are located at 8 kpc. In Revnivtsev et al. (2010), it was shown that the rms-width of the apparent magnitude distribution of red clump giants (RCG; considered to be almost standard candles) is approximately 0.28m (this rms scatter includes the intrinsic scatter of the RCG population, therefore the scatter caused by the distance variations alone is even smaller than 0.28m). This means that the error in source luminosities, associated with the assumption that all sources in the CBF are located at 8 kpc, is less than .
To determine the influence of these distance variations on the resulting luminosity function, and on our estimates of the luminosity density of sources, we have simulated a set of sources assuming that their intrinsic luminosity function has the shape (which is close to what is actually observed) and distributed the sources along the line of sight according to the stellar density distribution, described in Revnivtsev et al. (2010). The resulting luminosity function does not change by more than 10% and the luminosity density changes by only in comparison to the case of constant source distances.
According to the simple model of the stellar mass distribution (including the bulge, disk and the nuclear disk components) adopted in Revnivtsev et al. (2010), the total stellar mass angular surface density in CBF is arcmin-2. We corrected for the fact that this stellar surface density corresponds to a higher NIR surface brightness than that measured by Spitzer in this area (Revnivtsev et al. 2010). Therefore in our subsequent analysis we adopt a stellar surface density arcmin-2 in the CBF and assume that the vast majority of RCGs lie at a distance 8 kpc. This surface mass density is obtained via integration of the adopted density profile up to further edge of the Galaxy, i.e. up to 20 kpc distance from the Sun. Approximately 85% of the all mass contained in small solid angles in the direction of CBF is located within 1 kpc of the Galactic Center.
3 Luminosity function
In calculating the number-flux function (or luminosity function) of sources, we confined our analysis to the flux range where we expect no strong influence from incompleteness effects, i.e., where we detect more than counts from sources in the energy band used for source detection (0.5–7 keV) and more than 5 counts from sources in the energy band 2–10 keV. In principle, it is possible to continue the luminosity function toward lower luminosities, but accounting for the variety of spectral shapes at these luminosities (cf. soft spectra of coronally active stars and hard spectra of dwarf novae) introduces significant uncertainties – the same number of counts in total energy band, used for detection of sources, (0.5-7 keV) might correspond to significantly different energy flux in 2-10 keV energy band.
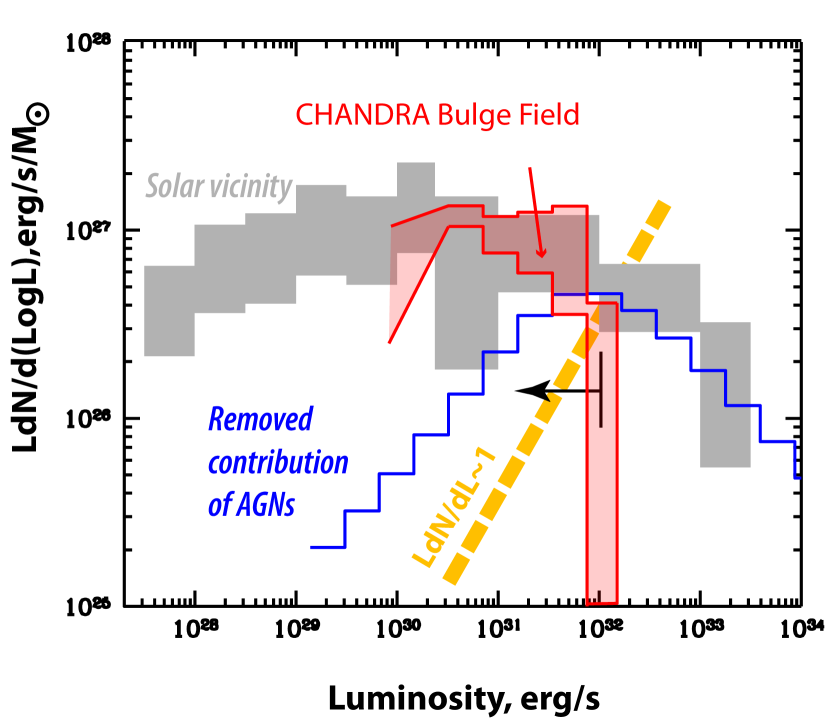
The number-flux function in its differential form, normalized to the mass of stars in the CBF area ( arcmin-2), is presented in Fig. 2.
To account for the contribution of extragalactic sources (mostly AGNs) to the number-flux function detected in the CBF, we have adopted the results of Moretti et al. (2003). We calculated the anticipated number of AGNs in every luminosity bin, assuming the Moretti et al. analytic form of the AGN number flux function (in the energy band 2–10 keV). The AGN contribution has its own uncertainty mainly caused by either Poisson noise of the number of sources in the field, or by cosmic variance. According to simple estimates of these uncertainties from the COSMOS survey (Cappelluti et al. 2007), in the small HRES field, the contribution from Poisson noise of the number of sources should dominate. We see that this noise is comparable with the Poisson noise of the number of Galactic sources in the field.
The shape of the luminosity function is not clear, however it can be approximated more or less adequately by a simple power law in luminosity interval : , where erg/s/, and
| Lum. range | Cumulative lum. density, |
|---|---|
| (, ) | erg/s/ |
| 31.5 | |
| 31.1 | |
| 30.7 | |
| 30.3 | |
| 29.9 | |
| 29.9–34.0∗ |
-
∗ – This cumulative luminosity density includes contribution from sources with erg s-1 , adopted from Sazonov et al. (2006)
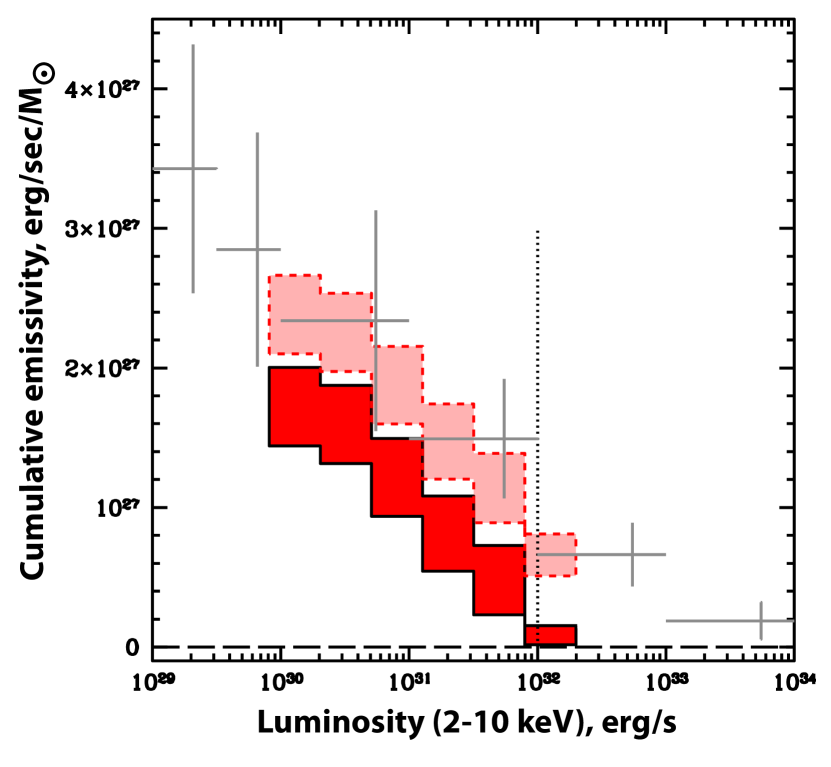
The cumulative emissivity of Galactic sources as a function of the limiting X-ray luminosity is shown in Table 1 and Fig. 3 (after correcting for AGNs as described above). Due to the relatively small survey volume, we cannot probe Galactic sources with luminosities higher than erg s-1 (increasing the solid angle of our study will not help here because the number of extragalactic sources will become a significant contributor to the source counts). Therefore, our estimates of the cumulative emissivity of sources lack the contribution from higher luminosity sources (in particular, luminous cataclysmic variables). To compare our results with the luminosity density of sources determined in the Solar vicinity (Sazonov et al. 2006), we added the value of the cumulative emissivity measured for sources with erg s-1 erg s-1 (shaded area with dashed perimeter in Fig. 3). The resulting cumulative luminosity density of sources with erg s-1 erg s-1 is erg s-1per .
3.1 Contributions from various stellar populations
It is practically impossible to determine the nature of all Chandra sources due to the extremely high spatial density of stars in the direction of the CBF (see e.g. images in Revnivtsev et al. 2010). However, we can estimate the composition judging from our knowledge of the luminosity function of different types of sources in the Solar vicinity. According to the space densities of different types of sources presented in Sazonov et al. (2006), we can anticipate approximately equal contributions from cataclysmic variables and from coronally active binaries to the cumulative 2–10 keV emisison in the luminosity range erg s-1 erg s-1, and a dominant contribution of ABs at energies below 2 keV.
Unfortunately, measurements of the densities of cataclysmic variables at lower luminosities ( erg s-1) are more uncertain. Judging from estimates presented in Pretorius et al. (2007) for CVs in the North Ecliptic Pole region (Table 2 of this paper), their spatial density in the range erg s-1 should be pc-3, or , assuming a local stellar density of (Robin et al. 2003). The luminosity density of CVs can then be estimated to be erg s-1 per . This is just % of the luminosity density of sources with erg s-1 in the CBF ( erg s-1 per ). This suggests that most of the detected sources in this luminosity range are active binary stars.
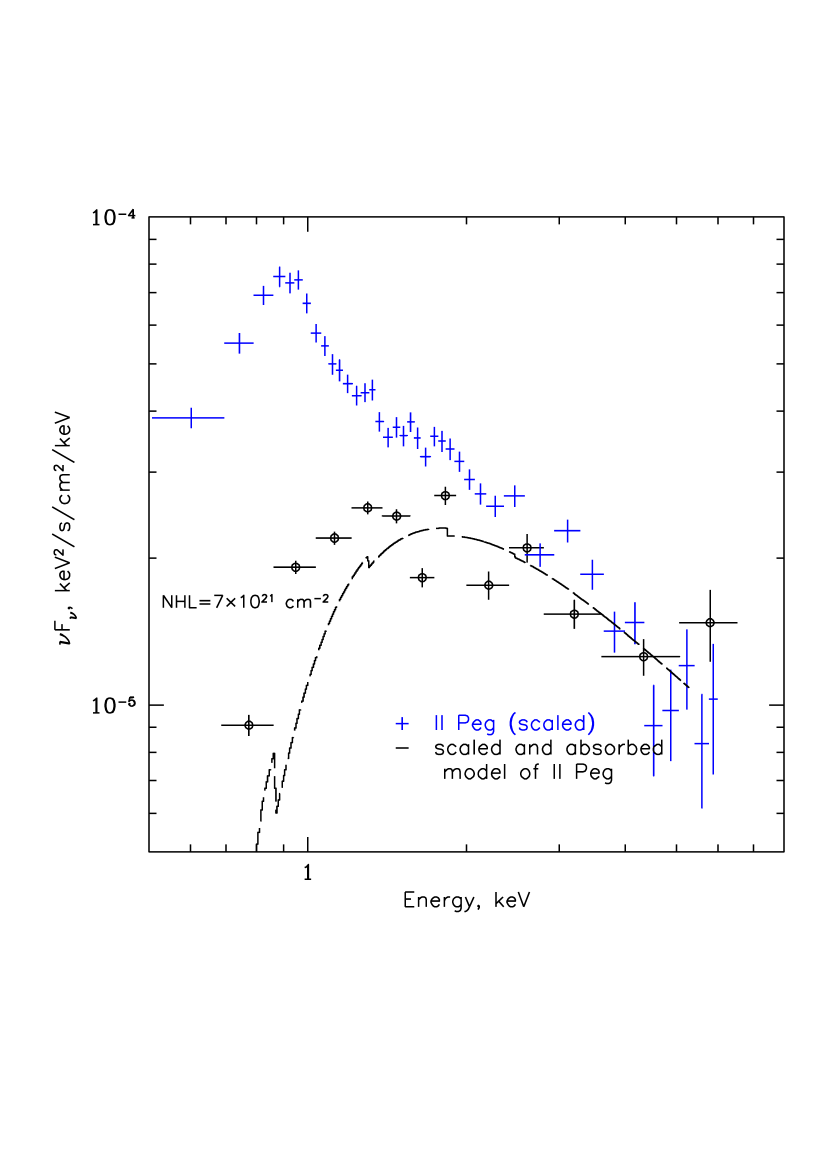
Active binary stars produce softer X-ray emission than do cataclysmic variables in general, so that for them (see e.g. Heinke et al. 2005; Sazonov et al. 2006, see Güdel 2004 for review of X-ray emission of AB sources). This is of high importance for soft X-ray studies of other galaxies. In Fig. 4, we show the cumulative spectrum of the faintest sources detected in the CBF (which is clearly softer than the summed spectrum of all detected sources) and compare it to the energy spectrum of the typical bright active binary star II Peg (see more details on spectra of II Peg in Mewe et al. 1997). The dashed curve in the figure shows a simple broken power law fit to the spectrum of II Peg, arbitrarily scaled and absorbed with interstellar column density cm-2, appropriate for the CBF. We see that the spectrum of the faintest CBF sources is compatible with that of AB stars of the appropriate luminosity. However, the considerable absorption at energies keV prevents seeing the full luminosity density of such soft sources. Without interstellar absorption, the CBF brightness at energies keV would be several times higher.
4 Summary
We have analysed statistical properties of X-ray sources detected in deep observations of the Chandra bulge field. The results of this work can be summarized as follows:
-
•
The luminosity function of detected X-ray sources in the luminosity range probed by our observations () and corrected for the contribution of extragalactic sources (AGNs), is relatively flat ( constant) and consistent with that determined from a sample of sources in the Solar vicinity by Sazonov et al. (2006).
-
•
The cumulative luminosity density of sources in the luminosity range is erg s-1per . Accounting for the contribution from sources with from Sazonov et al. (2006), the cumulative luminosity density of sources with is erg s-1 per .
-
•
The majority of the faintest sources should be active binaries with hot coronae, which makes their cumulative emission virtually indistinguishable from that of the hot interstellar plasma typically associated with old stellar populations. This indicates the importance of carefully accounting for the emission of such sources, based on detailed knowledge of their statistical properties and not only on the shape of the energy spectrum.
Acknowledgements
This research made use of data obtained from the High Energy Astrophysics Science Archive Research Center Online Service, provided by the NASA/Goddard Space Flight Center. This work was supported by a grant of Russian Foundation of Basic Research 10-02-00492-a, grant NSh-5069.2010.2, and programs of the Russian Academy of Sciences P-19 and OFN-16. SS acknowledges the support of the Dynasty Foundation.
References
- Cappelluti et al. (2007) Cappelluti N., et al., 2007, ApJS, 172, 341
- Churazov et al. (2010) Churazov E., et al., 2010, MNRAS, 404, 1165
- David et al. (2006) David L. P., Jones C., Forman W., Vargas I. M., Nulsen P., 2006, ApJ, 653, 207
- Fabbiano (1989) Fabbiano G., 1989, ARA&A, 27, 87
- Forman, Jones, & Tucker (1985) Forman W., Jones C., Tucker W., 1985, ApJ, 293, 102
- Forman et al. (2005) Forman W., et al., 2005, ApJ, 635, 894
- Gilfanov (2004) Gilfanov M., 2004, MNRAS, 349, 146
- Grimm, Gilfanov, & Sunyaev (2002) Grimm H.-J., Gilfanov M., Sunyaev R., 2002, A&A, 391, 923
- Güdel (2004) Güdel M., 2004, A&ARv, 12, 71
- Heinke et al. (2005) Heinke C. O., Grindlay J. E., Edmonds P. D., Cohn H. N., Lugger P. M., Camilo F., Bogdanov S., Freire P. C., 2005, ApJ, 625, 796
- Hong et al. (2009) Hong J. S., van den Berg M., Grindlay J. E., Laycock S., 2009, ApJ, 706, 223
- Hünsch et al. (1999) Hünsch M., Schmitt J. H. M. M., Sterzik M. F., Voges W., 1999, A&AS, 135, 319
- Irwin, Sarazin, & Bregman (2002) Irwin J. A., Sarazin C. L., Bregman J. N., 2002, ApJ, 570, 152
- Loewenstein & Mathews (1991) Loewenstein M., Mathews W. G., 1991, ApJ, 373, 445
- Maíz-Apellániz (2001) Maíz-Apellániz J., 2001, ApJ, 560, L83
- Moretti et al. (2003) Moretti A., Campana S., Lazzati D., Tagliaferri G., 2003, ApJ, 588, 696
- Mewe et al. (1997) Mewe R., Kaastra J. S., van den Oord G. H. J., Vink J., Tawara Y., 1997, A&A, 320, 147
- Padovani & Matteucci (1993) Padovani P., Matteucci F., 1993, ApJ, 416, 26
- Pallavicini et al. (1981) Pallavicini R., Golub L., Rosner R., Vaiana G. S., Ayres T., Linsky J. L., 1981, ApJ, 248, 279
- Predehl & Schmitt (1995) Predehl P., Schmitt J. H. M. M., 1995, A&A, 293, 889
- Pretorius et al. (2007) Pretorius M. L., Knigge C., O’Donoghue D., Henry J. P., Gioia I. M., Mullis C. R., 2007, MNRAS, 382, 1279
- Revnivtsev et al. (2006) Revnivtsev M., Sazonov S., Gilfanov M., Churazov E., Sunyaev R., 2006, A&A, 452, 169
- Revnivtsev et al. (2007) Revnivtsev M., Churazov E., Sazonov S., Forman W., Jones C., 2007, A&A, 473, 783
- Revnivtsev, Vikhlinin, & Sazonov (2007) Revnivtsev M., Vikhlinin A., Sazonov S., 2007, A&A, 473, 857
- Revnivtsev et al. (2008) Revnivtsev M., Churazov E., Sazonov S., Forman W., Jones C., 2008, A&A, 490, 37
- Revnivtsev et al. (2009) Revnivtsev M., Sazonov S., Churazov E., Forman W., Vikhlinin A., Sunyaev R., 2009, Natur, 458, 1142
- Revnivtsev, Burenin, & Sazonov (2009) Revnivtsev M. G., Burenin R. A., Sazonov S. Y., 2009, AstL, 35, 305
- Revnivtsev et al. (2010) Revnivtsev M., van den Berg M., Burenin R., Grindlay J. E., Karasev D., Forman W., 2010, arXiv, arXiv:1003.2965
- Robin et al. (2003) Robin A. C., Reylé C., Derrière S., Picaud S., 2003, A&A, 409, 523
- Sarazin, Irwin, & Bregman (2001) Sarazin C. L., Irwin J. A., Bregman J. N., 2001, ApJ, 556, 533
- Sazonov et al. (2006) Sazonov S., Revnivtsev M., Gilfanov M., Churazov E., Sunyaev R., 2006, A&A, 450, 117
- Schwope et al. (2002) Schwope A. D., Brunner H., Buckley D., Greiner J., Heyden K. v. d., Neizvestny S., Potter S., Schwarz R., 2002, A&A, 396, 895
- Strickland & Heckman (2007) Strickland D. K., Heckman T. M., 2007, ApJ, 658, 258
- Vikhlinin et al. (2005) Vikhlinin, A., Markevitch, M., Murray, S. S., Jones, C., Forman, W., & Van Speybroeck, L. 2005, ApJ, 628, 655
- Worrall & Marshall (1983) Worrall D. M., Marshall F. E., 1983, ApJ, 267, 691