Entropic Stabilization of Tunable Planar Modulated Superstructures
Abstract
Self-assembling novel ordered structures with nanoparticles has recently received much attention. Here we use computer simulations to study a two-dimensional model system characterized by a simple isotropic interaction that could be realized with building blocks on the nanoscale. We find that the particles arrange themselves into hexagonal superstructures of twin boundaries whose superlattice vector can be tuned reversibly by changing the temperature. Thermodynamic stability is confirmed by calculating the free energy with a combination of thermodynamic integration and the Frenkel-Ladd method. Different contributions to the free energy difference are discussed.
pacs:
61.50.Ah, 02.70.Ns, 64.70.Rh, 61.44.Br.The synthesis of nanoparticles and colloids with various types of interactions Bishop et al. (2009) and shapes Glotzer and Solomon (2007) has advanced rapidly. This opens up the possibility to use them as building blocks for self-assembling novel materials ‘from bottom up’. For future applications, ordered structures are especially interesting because they have unique photonic and electronic properties. Furthermore, it is desirable to have a large pool of different types of crystal structures to choose from. Structure formation of nanoparticles is guided by the same principles as crystallization of atoms despite the different character of the interparticle forces. Like for the majority of chemical elements, the most common ground states of nanoscopic building blocks are close-packed lattices which maximize density and the number of neighbor bonds. Different and more complex mesocrystals Song and Coelfen (2010) have been observed experimentally for example in binary mixtures of colloids Shevchenko et al. (2006); Leunissen et al. (2005), cylindrical liquid crystalline phases Tschierske (2007), and in simulations of hard tetrahedra Haji-Akbari et al. (2009). In general, however, the relationship between particle shape and interaction on the one hand, and the stabilized crystal structure on the other hand is not well understood.
Among the most complex ordered phases are commensurately and incommensurately modulated crystals Bak (1982), which have a basic structure and a superstructure in form of a spatial modulation. Although frequently found on the atomic scale in the bulk van Smaalen (2007); Janssen et al. (2007) and as ordered structures of noble gases in adsorbed layers Abraham et al. (1984); Persson (1992), modulated phases have not been known to self-assemble with nanoparticles. So far only one-dimensional modulations have been forced upon a two-dimensional system of colloids Baumgartl et al. (2004) and binary hard-disks Franzrahe and Nielaba (2007) using an external periodic potential. The purpose of this work is two-fold: First, we show that planar superstructures with a tunable modulation period form in a simple model system without external potential. Second, we confirm the thermodynamic stability of the superstructures with free energy calculations that are sensible enough to distinguish different modulations and analyze the origin of their entropic stabilization.
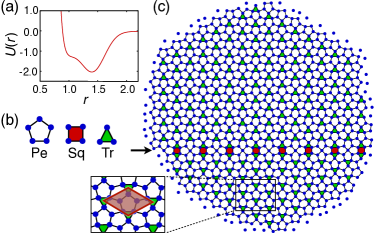
Our model consists of identical particles interacting in two dimensions via a Lennard-Jones-Gauss potential Engel and Trebin (2007) with parameters , , . This potential is isotropic and consists of a single minimum with a shoulder (Fig. 1(a)). Possible experimental realizations are spherical macromolecules and micelles. In the latter, a shoulder can be caused by a repulsive hard core of carbon rings and an attractive soft alkyl corona Ziherl and Kamien (2001); Zeng et al. (2004). We integrate the particle motions with molecular dynamics (MD) computer simulations in the ensemble at external pressure . A potential cut-off at and a thermostat for temperature control are used. Typical simulation times are MD steps. Units are dimensionless and fixed by the choice of the potential. An exception is the temperature , which is measured relative to a critical temperature . It has been shown in a previous study that the system transforms into a square crystal at before it melts above Engel et al. (2010).
A system of 1024 particles is slowly cooled down using open boundary conditions to find the energetic ground state. Below , the system completely orders into a crystal with symmetry group (Fig. 1(c)). Since the particles are arranged in one triangle tile (Tr) and three slightly deformed pentagons tiles (Pe) per unit cell, we call this phase Pe3Tr. Additional squares (Sq) tiles (with two triangles attached) are present as defects. They arrange along a line forming a twin boundary (TB) marked by an arrow in the figure. The effect of the TB on the crystal structure is a flip of the triangle tile orientations. We can measure the defect energy of a TB by comparing the potential energy of a perfect Pe3Tr crystal with one that has a single TB. The energy change per unit length caused by the presence of the TB is small compared to the average kinetic energy at the critical temperature, but positive: . This confirms that the creation of the TB requires energy.
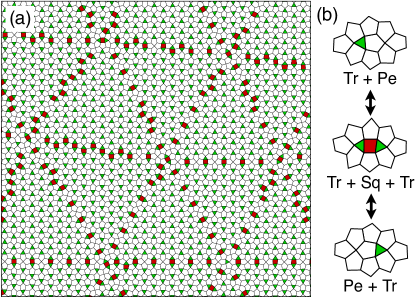
Next, we switch to a larger system with 10000 particles and study the temperature dependence of the equilibrium crystal structure in more detail. Fig. 2(a) shows the system held for a long time at . We used a rapid quench to to remove thermal noise. At the temperature , TBs are found to appear in equilibrium and arrange into a highly ordered hexagonal superstructure (symmetry group ): (i) The orientation of TBs is restricted to three directions. (ii) TBs are in average equally spaced. (iii) TBs form triple intersections only, double intersections never occur. These observations are sufficient to identify the superstructure as an interface modulated Cummins (1990) or, alternatively, domain wall incommensurate phase Persson (1992).
Given the simple pair interaction, the superstructure in Fig. 2(a) is surprisingly complex. The average periodicity equals 33 nearest neighbor distances and the superstructure unit cell contains approximately 700 particles. Furthermore, as will be shown below, this superlattice constant can be tuned continuously by varying the temperature. For this to happen there needs to be a way for the TBs to propagate efficiently through the structure in form of a phason mode Bak (1982). The basic mechanism for such a motion is depicted in Fig. 2(b). Squares can change position in three steps: (i) The combination of a square and a neighboring triangle transforms into a pentagon by moving the two particles of the common edge outwards. As a result, an isolated triangle remains, which shares edges with three pentagons. (ii) This transformation is energetically disfavorable and generates internal stress, which can be relaxed by transforming another pentagon nearby into a combination of a square and a triangle. (iii) Subsequent propagation of all squares in a TB induces a motion of this TB.
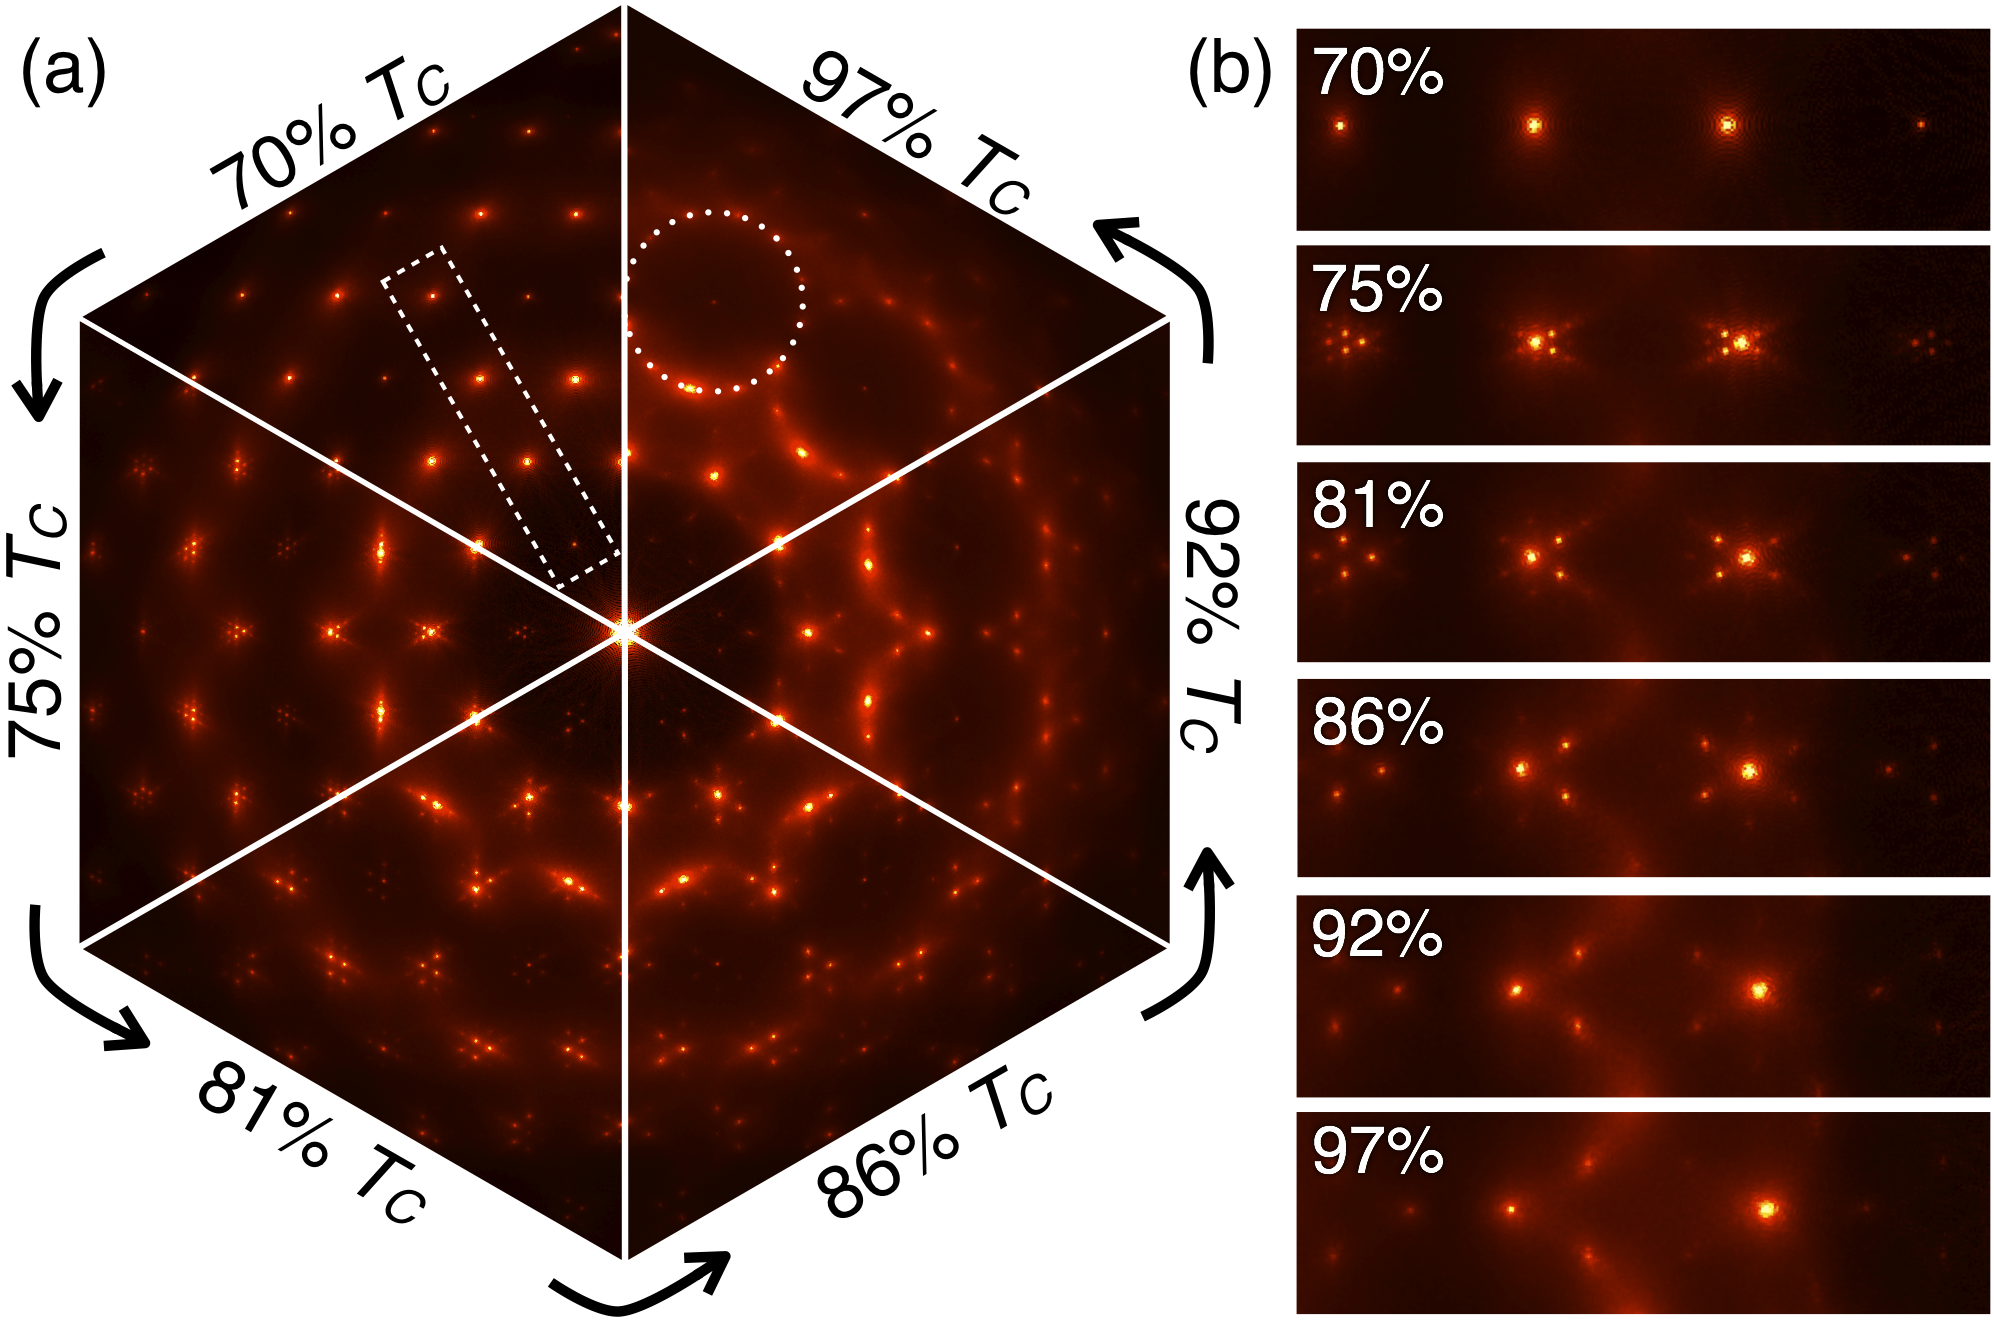
The hexagonal superstructure is best analyzed in Fourier space. Diffraction images (DIs) at six different temperatures are shown in Fig. 3. Up to the Pe3Tr crystal is stable. The DI at this temperature consists of equally spaced, sharp peaks. Only weak diffuse scattering caused by thermal motion is present in the background. Above , the peaks split up into a strong central peak and weak satellite peaks as expected for a modulated phase. The wave vector separating the satellite peaks continuously increases with increasing temperature as a result of a decreasing superlattice constant. A change in the rotational symmetry of the DI is visible in Fig. 3(a): The six-fold symmetry present at low and intermediate temperatures gradually transforms into a twelve-fold symmetry (generalized symmetry group ). Note that at , twelve peaks form two dodecagonal rings in the DI as outlined by a dotted circle. This suggests that a dodecagonal quasicrystal is stabilized close to the critical temperature. The structure and dynamics of this quasicrystal has been studied recently Engel et al. (2010). The sequence of symmetry changes is summarized as:
| (1) |
While the first two phase transitions are second order, the transition to the square crystal at and the melting transition at are first order Engel et al. (2010). Snapshots of the particle configurations at various temperatures and full diffraction patterns can be found in the supplementary information.
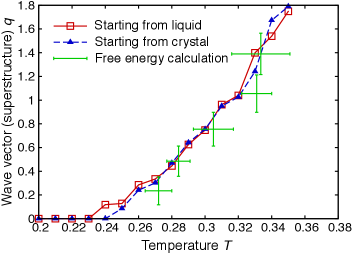
We determine the superlattice wave vector by measuring the distance of two neighboring superlattice peaks. Simulations are started from Pe3Tr (stable at low ) and the fluid (stable at high ) to test for hysteresis in the temperature behavior. The dependence of the superlattice wave vector on temperature is plotted in Fig. 4. No hysteresis is present and the final configuration is found to be independent of the starting condition, which is an indication that thermodynamic equilibrium has been reached. The wave vector of the superstructure increases roughly linearly between and . Such a continuous increase of the wave vector is typical for two-dimensional systems and is characteristic for a ‘floating’ modulation Bak (1982).
The stabilization of the superstructures is analyzed in more detail by calculating free energies. Two complementary techniques are used: the Frenkel-Ladd method (FL) and thermodynamic integration (TI). The absolute free energy can be obtained at all temperatures combining the methods into a new method (FLTI): (i) At low temperature ( ), the absolute free energy is determined with FL by interpolating between the target structure and an Einstein crystal with known free energy Frenkel and Ladd (1984). (ii) The free energy is then extended to higher temperatures with TI by integrating the potential energy along a reversible path:
| (2) |
where is a reference temperature and an integration constant that is determined from a comparison with FL. Using both methods is necessary because FL cannot be applied at high temperatures. The reason is the motion of the TBs, which makes equilibration during the interpolation to the Einstein crystal very slow due to the presence of particle rearrangements.
Boundary conditions are important for equilibrating the superstructures. Open boundaries ensure that TBs can be created and annihilated. In contrast, by switching to periodic boundary conditions, the superlattice constant remains fixed because the total number of TBs in the system cannot change. Using periodic boundaries allows to simulate superstructures at temperatures where they would otherwise be metastable with regard to a change in .
We analytically construct superstructures with various values of and calculate the free energy using FLTI and periodic boundaries. Stable superstructures are characterized by . Results from free energy calculation are included in Fig. 4. They agree well with the MD simulations and confirm that the temperature dependence of the superstructures wave vector observed in MD simulations.
The stabilization of the superstructures at elevated temperatures can only be explained by a higher entropy in comparison to the Pe3Tr crystal. We now analyze the contributions to the free energy. In general, the free energy of a classical -dimensional system can be written as a series:
| (3) |
with new constants , , and . This series splits up into a ‘harmonic’ part and an ‘anharmonic’ part . The harmonic part corresponds to the free energy of the system in a linear approximation, where the dynamics is completely specified by the dynamical matrix, or alternatively, by the zero temperature phonon density of state. The constant , and therefore , can be determined from the FL results at low temperature. The anharmonic part contains higher-order effects and has a more complicated temperature dependence. We write with the help of Eq. (2) in a form that can directly be used in simulation:
| (4) |
Note that since the integral does not diverge for small temperatures, we can now take as the lower limit.
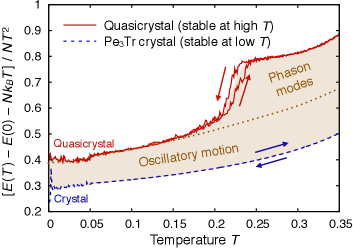
In order to study the temperature dependence of , we plot the integrand of this equation for the low temperature phase Pe3Tr (CR) and the quasicrystal (QC) stable at high temperature in Fig. 5. The shaded area between the curves corresponds to a free energy difference of the two phases.
The free energy difference at the critical temperature,
| (5) |
has three contributions: (1) Harmonic particle motion in the local potential energy minima (HM). (2) Anharmonic particle motion in the local potential energy minima (AM). These two parts vary smoothly with temperature. (3) Particle rearrangements as part of the phason modes (PH), which correspond to the TB motion, but can also be pentagon rotations Engel et al. (2010). While the first contribution is equal to , the last two are calculated from the shaded area in Fig. 5. Notice that phason modes only contribute after they are activated at around . We estimate their contribution by extrapolating the low-temperature data for the quasicrystal as indicated by the dashed curve. The results are: , , . The majority of the free energy difference comes from oscillatory (phonon) motion. Interestingly, phason modes do not contribute significantly.
In conclusion, we have introduced a model system that stabilizes a continuum of modulated superstructures. The interaction potential is simple enough that it could in principle be realized for example with attractive nanoparticles. Complex two-dimensional structures are now feasible experimentally: Only recently complex tunable two-dimensional binary molecular networks have been fabricated Huang et al. (2010). In another work, it has been demonstrated that binary nanoparticles can be assembled at the liquid-air interface into highly ordered crystals Dong et al. (2010). However, even without direct experimental realization, the simulation techniques and theoretical ideas outlined in this work are of interest. The combination of the Frenkel-Ladd method and thermodynamic integration is a powerful tool that allows to calculate free energies with very high precision (). In our case it was possible to compare superstructures with different wave vectors and distinguish the free energy contributions from oscillatory (phonon) particle motion and phason modes.
Support from the Deutsche Forschungsgemeinschaft (EN 905/1-1) is gratefully acknowledged.
References
- Bishop et al. (2009) K. J. M. Bishop, C. E. Wilmer, S. Soh, and B. A. Grzybowski, Small 5, 1600 (2009).
- Glotzer and Solomon (2007) S. C. Glotzer and M. J. Solomon, Nature Materials 6, 557 (2007).
- Song and Coelfen (2010) R.-Q. Song and H. Coelfen, Advanced Materials 22, 1301 (2010).
- Shevchenko et al. (2006) E. V. Shevchenko, D. V. Talapin, N. A. Kotov, S. O’Brien, and C. B. Murray, Nature 439, 55 (2006).
- Leunissen et al. (2005) M. E. Leunissen, C. G. Christova, A. P. Hynninen, C. P. Royall, A. I. Campbell, A. Imhof, M. Dijkstra, R. van Roij, and A. van Blaaderen, Nature 437, 235 (2005).
- Tschierske (2007) C. Tschierske, Chemical Society Reviews 36, 1930 (2007).
- Haji-Akbari et al. (2009) A. Haji-Akbari, M. Engel, A. S. Keys, X. Zheng, R. G. Petschek, P. Palffy-Muhoray, and S. C. Glotzer, Nature 462, 773 (2009).
- Bak (1982) P. Bak, Reports On Progress In Physics 45, 587 (1982).
- van Smaalen (2007) S. van Smaalen, Incommensurate crystallography, IUCR Monographs on Crystallography (Oxford University Press, 2007).
- Janssen et al. (2007) T. Janssen, G. Chapuis, and M. de Boissieu, Aperiodic Crystals: From Modulated Phases to Quasicrystals, IUCR Monographs on Crystallography (Oxford University Press, 2007).
- Abraham et al. (1984) F. F. Abraham, W. E. Rudge, D. J. Auerbach, and S. W. Koch, Physical Review Letters 52, 445 (1984).
- Persson (1992) B. N. J. Persson, Surface Science Reports 15, 1 (1992).
- Baumgartl et al. (2004) J. Baumgartl, M. Brunner, and C. Bechinger, Physical Review Letters 93, 168301 (2004).
- Franzrahe and Nielaba (2007) K. Franzrahe and P. Nielaba, Physical Review E 76, 061503 (2007).
- Engel and Trebin (2007) M. Engel and H.-R. Trebin, Physical Review Letters 98, 225505 (2007).
- Ziherl and Kamien (2001) P. Ziherl and R. D. Kamien, Journal of Physical Chemistry B 105, 10147 (2001).
- Zeng et al. (2004) X. B. Zeng, G. Ungar, Y. S. Liu, V. Percec, S. E. Dulcey, and J. K. Hobbs, Nature 428, 157 (2004).
- Engel et al. (2010) M. Engel, M. Umezaki, H.-R. Trebin, and T. Odagaki, Physcial Review B 82, 134206 (2010).
- Cummins (1990) H. Z. Cummins, Physics Reports-Review Section of Physics Letters 185, 211 (1990).
- Frenkel and Ladd (1984) D. Frenkel and A. J. C. Ladd, Journal of Chemical Physics 81, 3188 (1984).
- Huang et al. (2010) Y. L. Huang, W. Chen, H. Li, J. Ma, J. Pflaum, and A. T. S. Wee, Small 6, 70 (2010).
- Dong et al. (2010) A. Dong, J. Chen, P. M. Vora, J. M. Kikkawa, and C. B. Murray, Nature 466, 474 (2010).
![[Uncaptioned image]](/html/1101.5659/assets/x5.png)
![[Uncaptioned image]](/html/1101.5659/assets/x6.png)
![[Uncaptioned image]](/html/1101.5659/assets/x7.png)
![[Uncaptioned image]](/html/1101.5659/assets/x8.png)
![[Uncaptioned image]](/html/1101.5659/assets/x9.png)
![[Uncaptioned image]](/html/1101.5659/assets/x10.png)
![[Uncaptioned image]](/html/1101.5659/assets/x11.png)