Present address: ]University Duisburg-Essen Physics Department D-47048 Duisburg, Germany
Revealing the ortho-II Band Folding in YBa2Cu3O7-δ Films
Abstract
We present an angle-resolved photoelectron spectroscopy study of YBa2Cu3O7-δ films grown by pulsed laser deposition. We have successfully produced underdoped surfaces with ordered oxygen vacancies within the CuO chains resulting in a clear ortho-II band folding of the Fermi surface. This indicates that order within the CuO chains affects the electronic properties of the CuO2 planes. Our results highlight the importance of having not only the correct surface carrier concentration, but also a very well ordered and clean surface in order that photoemission data on this compound be representative of the bulk.
pacs:
71.18.+y, 74.25.Jb, 74.72.-h, 74.78.-w, 79.20.Eb, 79.60.DpSince the discovery of high-temperature superconductors (HTSC), the YBa2Cu3O7-δ (Y123) compound has been the subject of many experimental and theoretical studies M. A. Hossain (2008); N. Doiron-Leyraud (2007); A. Carrington and E. A. Yelland (2007); I. S. Elfimov, G. A. Sawatzky and A. Damascelli (2008). Recently, interest in this material was renewed when quantum oscillation experiments in high magnetic fields in underdoped ortho-II ordered YBa2Cu3O6.5 (YBCO6.5) revealed that the Fermi surface (FS) reconstructs into one N. Doiron-Leyraud (2007) or several A. Audouard (2009) pockets. Indeed, theoretical predictions have shown that ortho-II ordered YBCO6.5 should display band folding giving rise to pockets A. Carrington and E. A. Yelland (2007); I. S. Elfimov, G. A. Sawatzky and A. Damascelli (2008). Further, for other cuprate HTSC, evidence for such pockets have been reported by angle-resolved photoelectron spectroscopy (ARPES) J. Chang (2008); E. Razzoli (2010). However, for ordered YBCO6.5, no pockets or band folding have been directly observed by ARPES M. A. Hossain (2008).
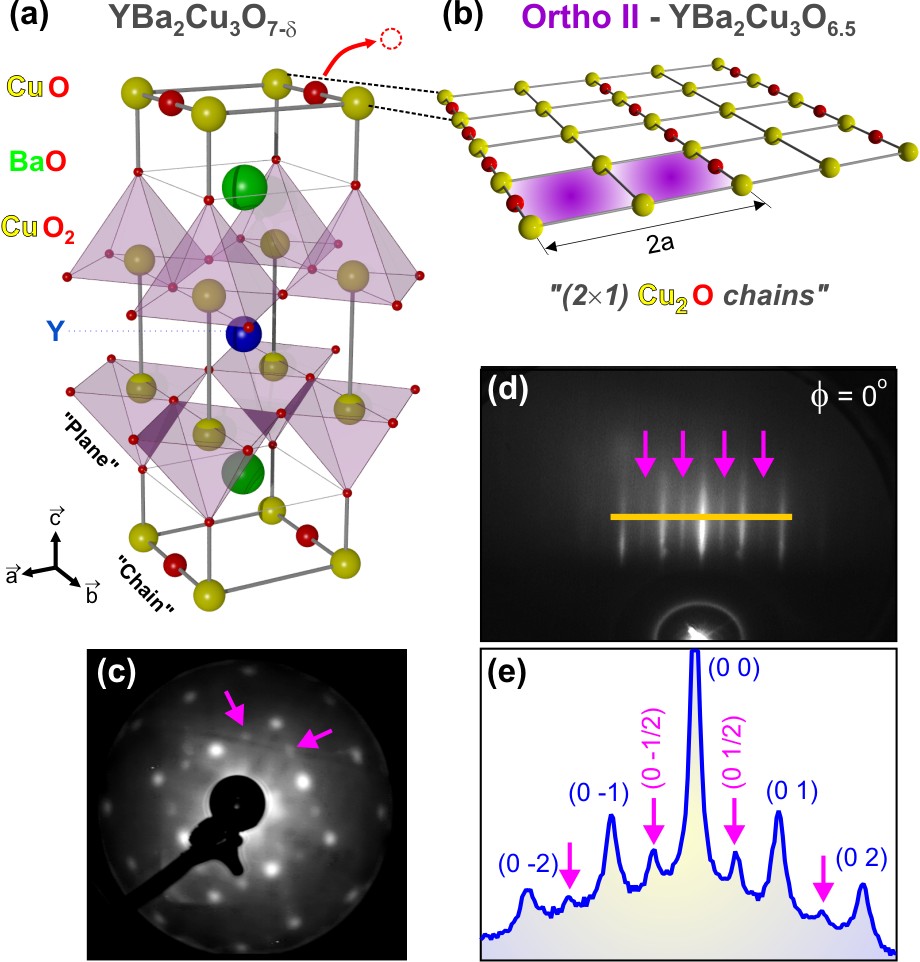
The crystal structure of Y123 [Fig. 1(a)] differs slightly from other HTSC. In addition to the CuO2 planes, it also contains 1D CuO chains along the -axis that donate charge carriers (holes) to the superconducting planes. It is also well established that Y123 displays a wide variety of superstructures Q. Wang (1992) caused by oxygen-vacancy order within the chains. One in particular is the ortho-II phase, characterized by ordered oxygen-vacancies within every second CuO chain [Fig. 1(b)]. This alternation of filled and empty chains along the -axis induces a unit-cell doubling along the -axis, i.e., a reduction of the Brillouin zone, and hence band folding is expected A. Carrington and E. A. Yelland (2007); I. S. Elfimov, G. A. Sawatzky and A. Damascelli (2008). Unfortunately, ARPES experiments on Y123 and especially the ortho-II phase are notoriously difficult. One reason is that the crystal structure lacks a natural cleavage plane and hence cleaved, the surface contains both CuO and BaO terminations, giving different contributions to the total ARPES intensity V. B. Zabolotnyy (2007). Moreover, due to polarity, the cleaved surface tends to be strongly overdoped V. B. Zabolotnyy (2007); M. A. Hossain (2008) even though the bulk is underdoped. As a result, details of the electronic properties have remained elusive. To avoid the problem with self-hole-doping of Y123, Hossain et al. M. A. Hossain (2008) performed an evaporation of potassium (K) onto the cleaved surface. Although the correct hole-doping was achieved, the importance of oxygen-vacancy ordering as well as surface termination remained unresolved and the expected ortho-II band folding A. Carrington and E. A. Yelland (2007); I. S. Elfimov, G. A. Sawatzky and A. Damascelli (2008) was not detected. Due to the absence of experimental evidence, the ortho-II potential was assumed to be too weak, and such band folding was not considered in many theoretical models N. Harrison (2009).
In this rapid communication we present a high-resolution ARPES study of heteroepitaxial Y123 films, grown by pulsed laser deposition (PLD) P. R. Willmott and J. R. Huber (2000). The ARPES experiments were performed on the Surface/Interface Spectroscopy (SIS) X09LA beamline at the Swiss Light Source, Paul Scherrer Institut, Villigen, Switzerland. The beamline was set to circular polarized light with a photon energy, = 70 eV and data were acquired using both Gammadata Scienta SES-2002 and VG-Scienta R4000 electron analyzer. The energy resolution was set to 15-25 meV and the momentum resolution parallel/perpendicular to the analyzer slit chosen as 0.009/0.019 Å-1. Data were acquired in the temperature range = 9-120 K using the six degree of freedom CARVING manipulator. The binding-energy scale was calibrated with a copper reference sample in direct electrical and thermal contact with the film. The base pressure of the UHV system was below 510-11 mbar during the entire measurement and no sign of sample/data quality degradation was observed. Our results were reproduced on several occasions, using more than ten different samples grown under the same conditions.
The 100 nm thick Y123 films were grown on TiO2 (B-site) terminated SrTiO3 (STO) substrates, resulting in a CuO chain termination of the Y123 surface J. M. Huijbregtse, J. H. Rector and B. Dam (2001). Reflection high-energy electron-diffraction (RHEED) measurements of the films show a streaky pattern [Fig. 1(d)], suggesting a clear 2D growth with an atomically flat crystalline surface. Moreover, additional peaks around e.g. (0 1/2) and (0 -1/2) [Fig. 1(e)] can be distinguished, suggesting a unit-cell doubling. Also the low-energy electron diffraction (LEED) pattern [Fig. 1(c)] displays a clear (21) reconstruction, as indicated by the extra weaker spots. It is also clear that the film is twinned since the (21) spots appear in both directions. The bulk properties of the film were verified by X-ray diffraction (XRD) measurements. The XRD pattern shows a very good -axis orientation and a narrow (FWHM 0.08∘) rocking curve of the YBCO (005) reflection (not shown).
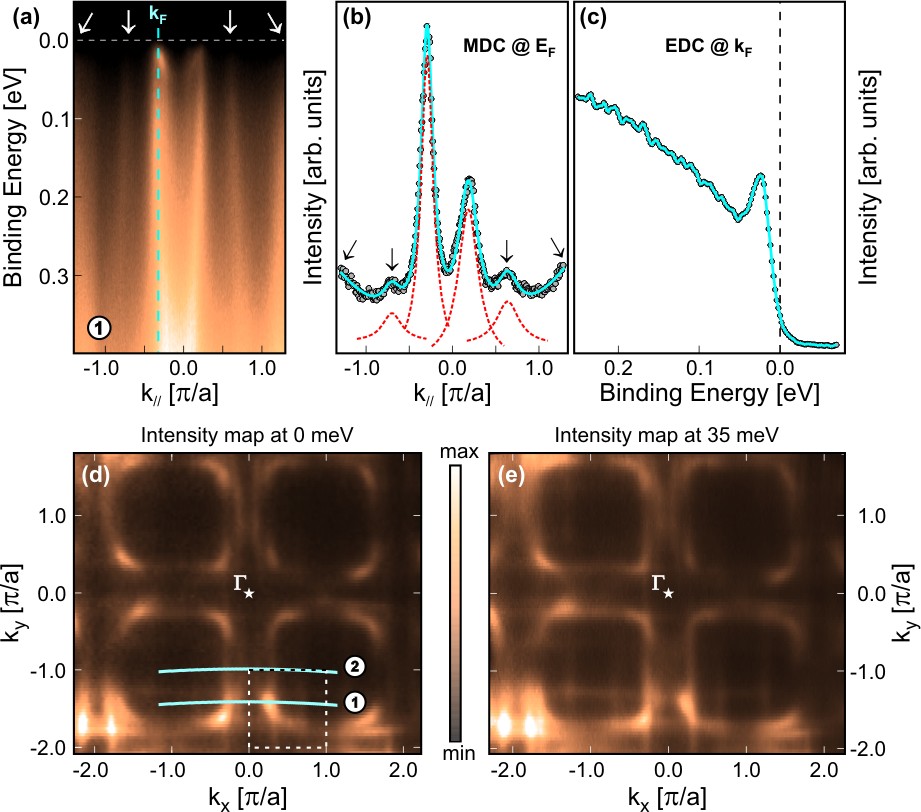
By a direct transfer between the PLD and ARPES UHV chambers, we have been able to measure the Y123 films as grown (without cleaving). In Fig. 2(a) a typical ARPES spectrum is shown, that was acquired at cut ① [Fig. 2(d)] and = 10 K. Two strong dispersive features are clearly observable but also four supplementary weaker bands are visible, that were not present in previous ARPES measurements on Y123 M. A. Hossain (2008). From the dispersion it is clear that the supplementary bands are created by a folding of the main bands. This is consistent with the extra lines/points in the RHEED/LEED patterns (Fig. 1) that reveal a unit-cell doubling. The folded bands are even more visible in Fig. 2(b) where the result of a Lorentzian fit of the momentum distribution curve (MDC) at the Fermi level () is shown. Fig. 2(c) represents the energy distribution curve (EDC) at the Fermi wavevector () for one of the main bands in Fig. 2(a) (blue dashed vertical line). A sharp quasi-particle (QP) peak is visible slightly below , indicating the presence of a superconducting gap.
By acquiring ARPES spectra for multiple momentum cuts, we have mapped out the FS of the Y123 film. Fig. 2(d) shows the spectral intensity map integrated 5 meV around and Fig. 2(e) the underlying FS integrated 5 meV around a binding energy = 35 meV (i.e., below the gap). Centered around (, ), we find a weaker pocket-like feature (square) associated with the folded bands and unit-cell doubling, as mentioned above. By extracting the surface-hole doping () from the FS area = 0.1 0.02 is obtained, corresponding to an oxygen content = 7 - 6.5, i.e. YBCO6.5. It can be concluded that the surface of the film has both the correct hole doping and the necessary (vacancy) order to be a good representation of ortho-II YBCO6.5.
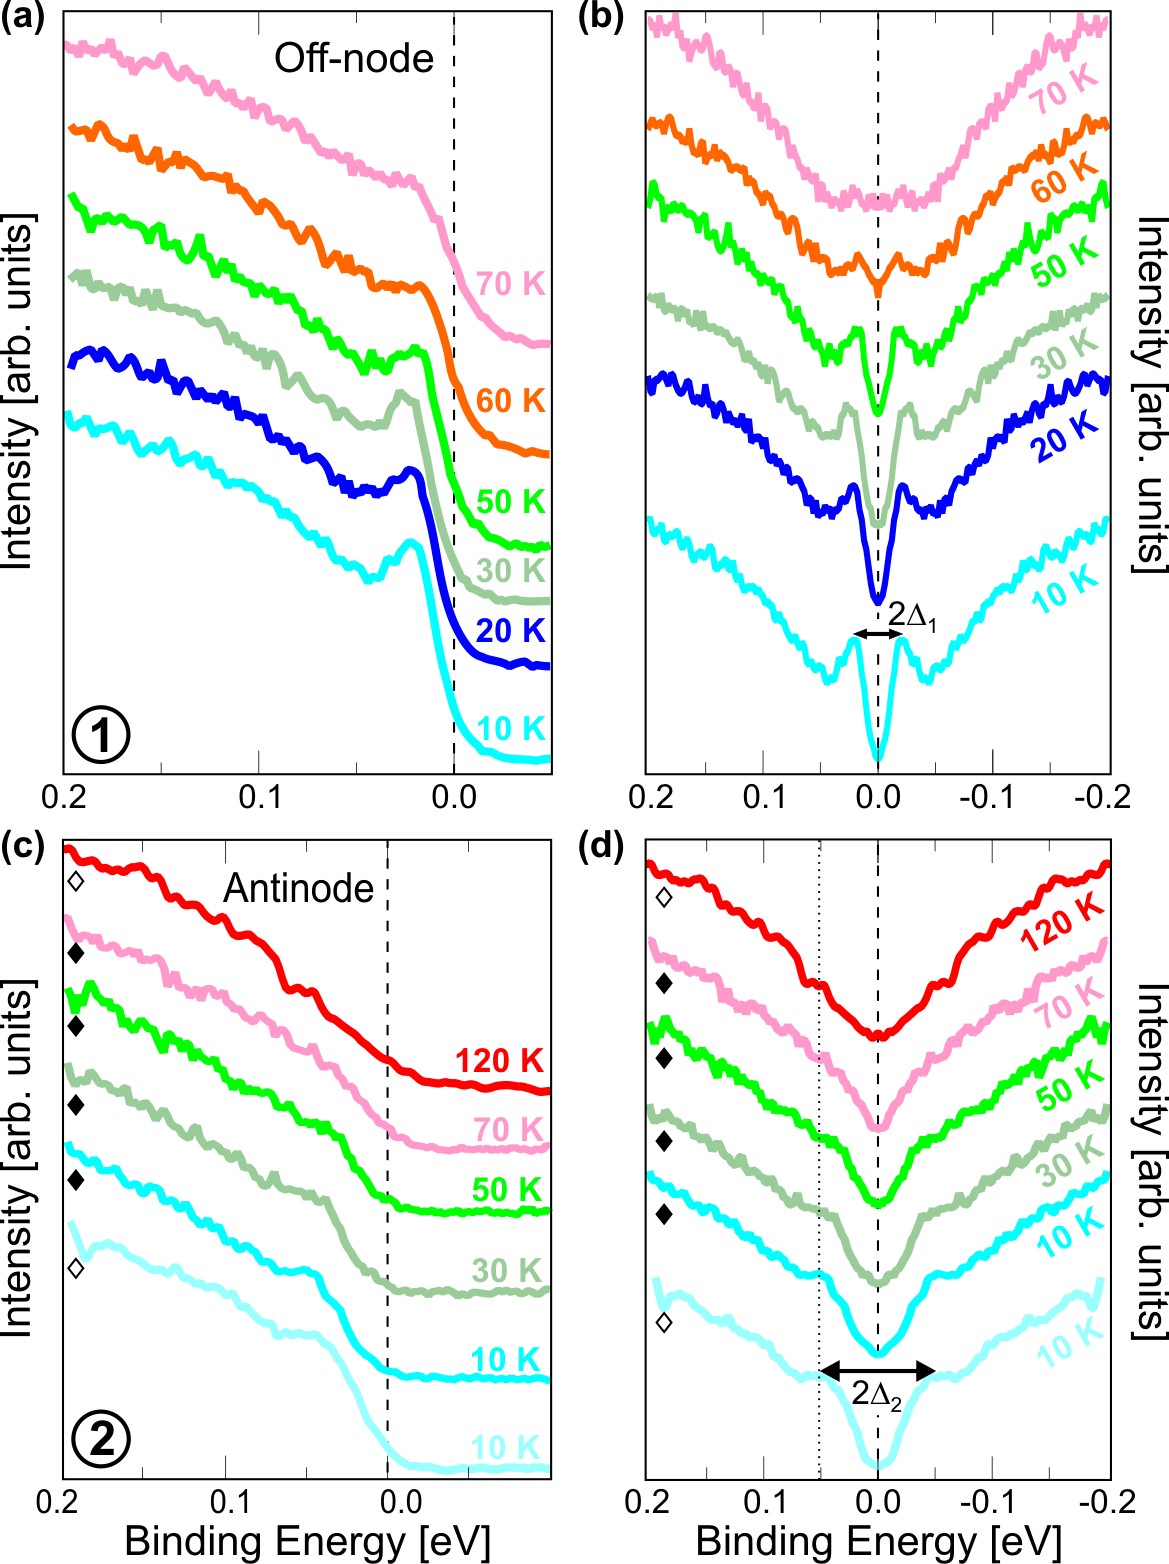
Fig. 3(a) represents the EDC at (blue dashed line showed in Fig. 2(a)) as a function of temperature. At low temperature (10 K60 K), a clear QP peak is observed. At higher , this peak decreases significantly and almost vanishes at = 70 K. The appearance of such a coherent peak below is a good indication for the presence of a superconducting state. In order to estimate the superconducting gap-value, the EDCs are symmetrized with respect to [Fig. 3(b)]. The extracted gap size for cuts ① at = 10 K is = 22 3 meV. Increasing reduces the gap value until it closes at = 70 K, indicating that 65 K. From the value of it is deduced that 0.106 R. Liang (2006), which is in good agreement with the value extracted from the FS area. Fig. 3(c) shows the EDC at at the antinode for cut ② [Fig. 2(d)] at = 10-120 K. Contrary to cut ①, the QP peak at = 10 K is strongly suppressed, which is a common feature of underdoped cuprates. Like Fig. 3(b), the EDCs are symmetrized and the obtained gap size is = 52 4 meV. The values of and are consistent with a strongly anisotropic gap having its maximum at the antinodal point. Above the superconducting transition at = 120 K, the symmetrized EDCs show that remains open, while has closed at = 70 K. This strongly suggests the existence of a pseudogap state, again confirming that the surface of the film is indeed underdoped.
To consider the effect of the ortho-II order on the electronic structure as only a simple band folding along the -axis is a highly simplified picture. For instance, it has been shown by nuclear magnetic resonance (NMR) that the vacancy order causes a charge imbalance between the Cu atoms sitting below filled/empty chains Z. Yamani (2004). Naturally, a coupling between the bands of the chains and the superconducting CuO2 planes is expected. Bascones theoretically demonstrated that for ortho-II, due to interlayer coherence and oxygen ordering, the bonding (B) and anti-bonding (AB) bands of Y123 are each split into two bands, and a quasi-one-dimensional due to zone folding E. Bascones (2005). Taking into account the 2 periodicity of the ortho-II phase, the resulting dispersion of the CuO2 plane can be expressed according to E. Bascones (2005):
| (1) | |||
| (2) | |||
| (3) |
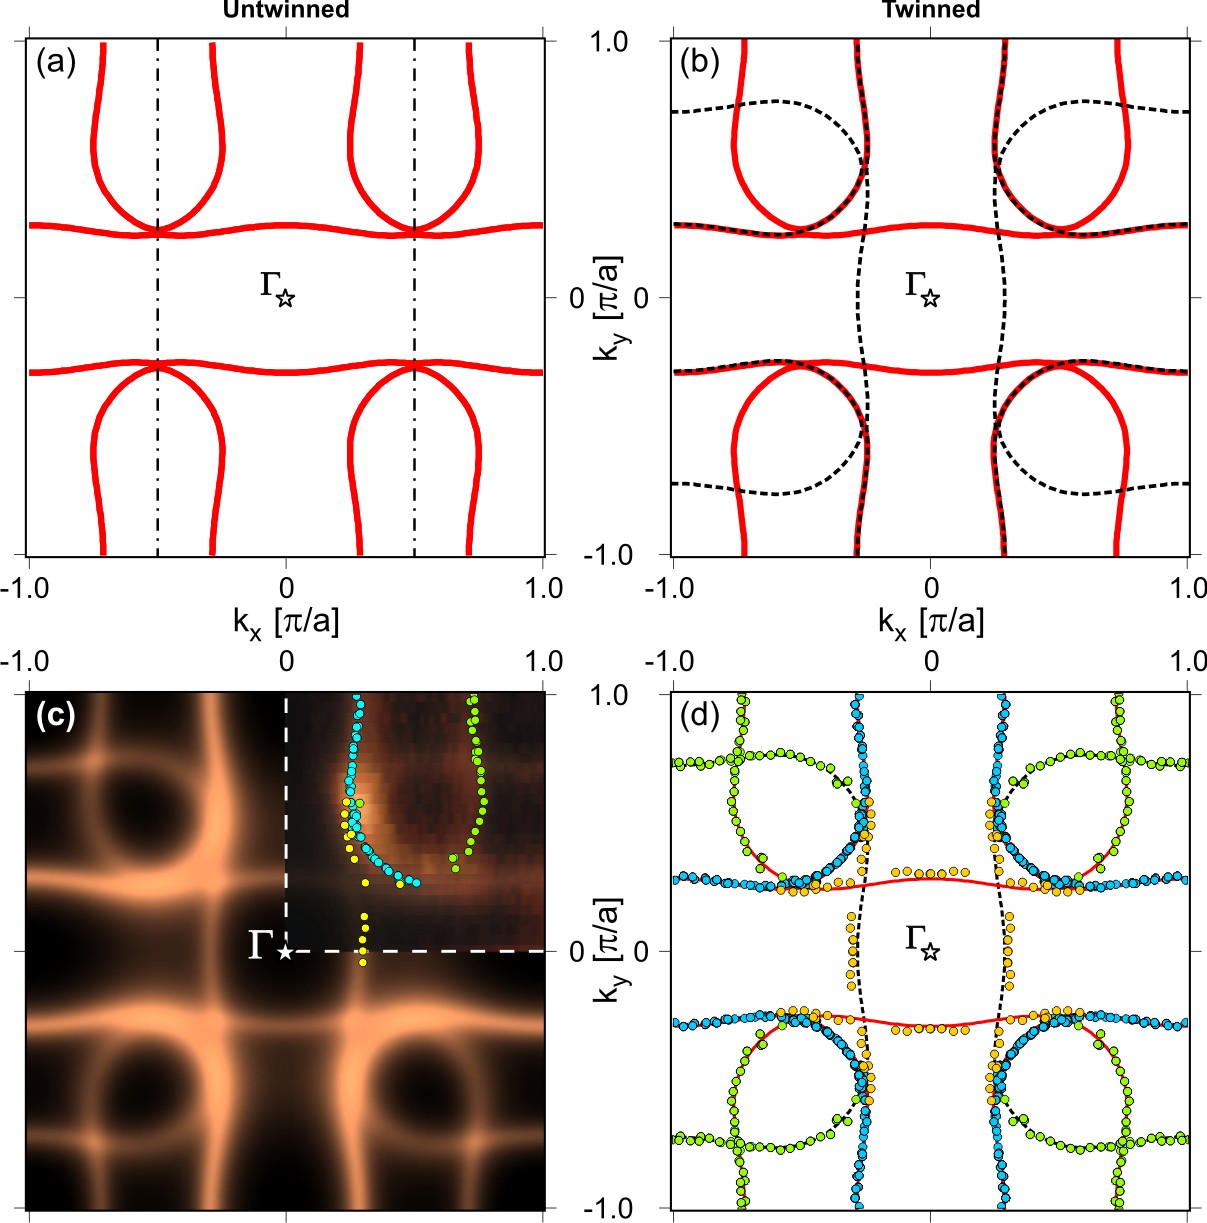
where is the chemical potential, is the nearest neighbor hopping integral, and the second and third nearest-neighbor intraplane hopping integrals, the interlayer hopping integral (bilayer splitting), and the ortho-II potential. The first and second signs set the AB/B bands and the / bands, respectively. Here, is set constant since from local density approximation (LDA) calculations, the ortho-II potential is only slightly -dependent near the nodes E. Bascones (2005). Further, since the existence of bilayer splitting in the underdoped regime remains unclear and cannot be distinguished in our data, is neglected. This is consistent with very recent ARPES data recorded for different dopings of Y123 surfaces, which demonstrated that the bilayer splitting is progressively reduced upon underdoping and vanishes below 0.15 D. Fournier (2010). The FS can be adequately fitted by the tight-binding model described by Eq. (3), giving = 558 50 meV, = 0.49 0.03, = 0.5 0.03, = -469 90 meV and = 75 meV. Fig. 4(a) shows the calculated FS of the ortho-II sample considering the tight-binding parameters mentioned above. It is clear that the reduction of the Brillouin zone induces a drastic change in the shape but also the number of FS sheets. For a twinned sample, the FS will be folded along both the ()-() as well as the ()-() lines. Fig. 4(b) shows the calculated FS for a twinned ortho-II sample and Fig. 4(c) the corresponding simulated intensity map at 0 meV with an energy broadening of 25 meV. In the latter, the upper-right quadrant represents the experimental data [dashed square area in Fig. 2(d)] and the filled circles are extracted from Lorenztian fits of the MDCs at for different -momenta. Fig. 4(d) shows the filled circles (symmetrized in momentum) along with the calculated twinned FS. By comparing the calculated intensity map with the data [Fig. 4(c)] and by overlaying the model onto the experimental points [Fig. 4(d)] it is clear that there is very good agreement.
In summary, we have been able to measure Y123 films by ARPES, a task previously thought not possible due to oxygen deficiency causing an
insulating surface M. Abrecht (2004). By growing oxygen-ordered Y123 films , a clear surface representation of ortho-II band folding is
made evident by ARPES. Our results thereby confirm theoretical A. Carrington and E. A. Yelland (2007); I. S. Elfimov, G. A. Sawatzky and A.
Damascelli (2008) and experimental expectations D. L. Feng (2004). We connect this
to a (21) surface reconstruction caused by ordered oxygen vacancies that help to stabilize the Y123 surface. Our experiments clearly
highlight the importance of having not only the correct carrier concentration, but also a very well ordered and clean surface to facilitate
ARPES data representative of the compound’s true nature. This could also explain why the ortho-II band folding was not found by Hossain
M. A. Hossain (2008). Even though they evidently managed to obtain the correct (under)doping of the surface by K evaporation, the essential ordering
of oxygen-vacancies was not fulfilled. It has for other compounds been shown that charge carrier concentration ion-vacancy ordering are of
equal importance for the magnetic T. F. Schulze (2008) as well as electronic properties L. Balicas (2008). In this case, we have successfully shown how oxygen vacancy
ordering in the CuO chains of the surface influences the electronic properties of the superconducting CuO2 planes in Y123 films. In fact,
such unidirectional band folding could contribute to the strong breaking of the four-fold rotational symmetry of the CuO2 planes observed
by the Nernst effect R. Daou (2010). This work opens the door to directly investigate such matters by performing ARPES measurements on, preferably,
untwinned Y123 samples. We would also like to emphasize that having obtained a more accurate view of the bulk electronic structure in
underdoped Y123, the ortho-II folding can no longer be ignored M. A. Hossain (2008); N. Harrison (2009). Instead our results give solid experimental support for
theoretical models that consider a combination of ortho-II band folding and magnetic H. Oh (2009); J.-M. Carter, D. Podolsky and H.-Y.
Kee (2010) or -density wave (DDW) order
D. Podolsky and H.-Y. Kee (2008), which could be important for explaining the quantum oscillation results N. Doiron-Leyraud (2007); A. Audouard (2009).
We are grateful to Andrea Damascelli for valuable discussions, as well as Christian M. Schlepütz for his support. This research was
supported by the Swiss National Science Foundation, MaNEP, and the Foundation BLANCEFLOR Boncompagni-Ludovisi née Bildt. MN was supported by
the US DOE, Office of Science, under contract DE-AC02-06CH11357.
References
- M. A. Hossain (2008) M. A. Hossain , Nature Phys. 4, 527 (2008).
- N. Doiron-Leyraud (2007) N. Doiron-Leyraud , Nature 447, 565 (2007).
- A. Carrington and E. A. Yelland (2007) A. Carrington and E. A. Yelland, Phys. Rev. B 76, 140508(R) (2007).
- I. S. Elfimov, G. A. Sawatzky and A. Damascelli (2008) I. S. Elfimov, G. A. Sawatzky and A. Damascelli, Phys. Rev. B 77, 060504(R) (2008).
- A. Audouard (2009) A. Audouard , Phys. Rev. Lett. 103, 157003 (2009).
- J. Chang (2008) J. Chang , New J. Phys. 10, 103016 (2008).
- E. Razzoli (2010) E. Razzoli , New J. Phys. 12, 125003 (2010).
- Q. Wang (1992) Q. Wang , Phys. Rev. B 45, 10834 (1992).
- V. B. Zabolotnyy (2007) V. B. Zabolotnyy , Phys. Rev. B 76, 064519 (2007).
- N. Harrison (2009) N. Harrison, Phys. Rev. Lett. 102, 206405 (2009).
- P. R. Willmott and J. R. Huber (2000) P. R. Willmott and J. R. Huber, Rev. Mod. Phys. 72, 315 (2000).
- J. M. Huijbregtse, J. H. Rector and B. Dam (2001) J. M. Huijbregtse, J. H. Rector and B. Dam, Physica C 351, 183 (2001).
- R. Liang (2006) R. Liang , Phys. Rev. B 73, 180505 (2006).
- Z. Yamani (2004) Z. Yamani , Physica C 405, 227 (2004).
- E. Bascones (2005) E. Bascones , Phys. Rev. B 71, 012505 (2005).
- D. Fournier (2010) D. Fournier , Nature Phys. 6, 905 (2010).
- M. Abrecht (2004) M. Abrecht , J. Phys. Chem. Solids 65, 1391 (2004).
- D. L. Feng (2004) D. L. Feng (2004), eprint cond-mat/0402488.
- T. F. Schulze (2008) T. F. Schulze , Phys. Rev. Lett. 100, 026407 (2008).
- L. Balicas (2008) L. Balicas , Phys. Rev. Lett. 100, 126405 (2008).
- R. Daou (2010) R. Daou , Nature 463, 28 (2010).
- H. Oh (2009) H. Oh (2009), eprint arXiv:0912.2450v1.
- J.-M. Carter, D. Podolsky and H.-Y. Kee (2010) J.-M. Carter, D. Podolsky and H.-Y. Kee, Phys. Rev. B 81, 064519 (2010).
- D. Podolsky and H.-Y. Kee (2008) D. Podolsky and H.-Y. Kee, Phys. Rev. B 78, 224516 (2008).