Localization of gravitational wave sources with networks of advanced detectors
Abstract
Coincident observations with gravitational wave (GW) detectors and other astronomical instruments are in the focus of the experiments with the network of LIGO, Virgo and GEO detectors. They will become a necessary part of the future GW astronomy as the next generation of advanced detectors comes online. The success of such joint observations directly depends on the source localization capabilities of the GW detectors. In this paper we present studies of the sky localization of transient GW sources with the future advanced detector networks and describe their fundamental properties. By reconstructing sky coordinates of ad hoc signals injected into simulated detector noise we study the accuracy of the source localization and its dependence on the strength of injected signals, waveforms and network configurations.
pacs:
04.80.Nn, 07.05.Kf, 95.55.Ym, 04.30.Db]Dated:
I Introduction
There has been a significant sensitivity improvement of the gravitational wave detectors since the Laser Interferometer Gravitational Wave Observatory (LIGO) LIGO and Virgo observatory Virgo started their operation. In 2007 LIGO and Virgo completed the two year run at sensitivity that allows detection of a merger of two neutron stars (NS-NS) as far as Mpc away S5range ; cbc2009 . In the most recent run (May 2009 - October 2010) the binary neutron star horizon distance has been increased to Mpc. However, even at this impressive sensitivity, the anticipated detection rate with the initial LIGO and Virgo detectors is quite low. A detection may be possible in the case of a rare astrophysical transient event such as a supernova explosion in our Galaxy or a nearby merger of binary neutron stars. The signal is likely to be weak and it will be difficult to prove its astrophysical origin unless it is confirmed with a coincident observation of the electromagnetic or neutrino counterpart. For this reason the LIGO and Virgo collaborations are conducting a wide range of joint observations LOOKUP with other astrophysical experiments including radio LOFAR ; ARECIBO , optical and x-ray telescopes ROTSE ; QUEST ; TAROT ; SWIFT , and neutrino detectors Antares ; IceCube .
A more robust detection of gravitational waves from astrophysical sources is anticipated in the next five years as Advanced LIGO and Advanced Virgo come online. Numerous GW signals, expected to be observed by advanced detectors (likely NS-NS events per year ExpRates ), will begin our exploration of the gravitational-wave sky and start the era of the gravitational wave astronomy. Along with the advanced GW detectors, a new generation of optical telescopes will come online LSST ; PanStarrs ; 30mTelescope , which will enable a wide and deep survey of the electromagnetic sky. Joint observations with the advanced gravitational wave detectors and electromagnetic instruments will not only increase the confidence of detection but also bring fundamentally new information about the GW sources. They will reveal the physics and dynamic of sources, provide the identification of host galaxies and the associated redshifts, and in some cases determine luminosity distance to the source.
One of the major challenges for such joint observations is to establish unambiguous association between a gravitational wave signal and a possible electromagnetic counterpart. It greatly depends on the ability of the GW networks to reconstruct sky coordinates of a detected GW source. Given an accurate sky location, a corresponding electromagnetic transient may be identified in a list of events obtained with the all-sky telescope surveys, or the EM instruments can be guided to take images of a small area in the sky. In the second case, it is important that the sky localization is performed by GW detectors in real time with low latency. The efficiency of the GW-EM association and the choice of a partner telescope is affected by the sky localization error which should be well within the instrument’s field of view (typically less than few square degrees). Moreover, exploring smaller area in the sky will decrease the probability of the false association.
The problem of the source localization with networks of GW detectors is in the focus of research in the gravitational wave data analysis. There are several analytical studies triang ; triang2008 ; Feir ; WenChen of this problem considering geometrical reconstruction of source coordinates based on the triangulation, which requires a measurement of the arrival time of a GW signal at different detectors. However, the accurate timing of the GW signal is intimately related to the reconstruction of the signal waveforms. Due to the different detector sensitivities to the GW polarizations, the waveforms recorded by individual detectors may be different and they may not have a common timing reference (like a signal peak time) for a direct measurement of the differences in the arrival time. Therefore, the problem of the source localization is better addressed in the framework of the coherent network analysis GT ; FH ; PRD05 , which reconstructs the waveforms and the sky coordinates simultaneously. By using both these methods (triangulation and coherent network analysis), several practical source localization algorithms klimenko2008 ; Omega ; MBTA have been recently developed and used during the LIGO and Virgo data taking runs in 2009-2010.
There have been a number of studies addressing benefits of individual detectors Schutz1987 ; Searl2006 and various detector networks Weiss2010 ; Schutz2010 . In this paper we present a simulation study of the source localization and the reconstruction of GW waveforms with the networks of advanced detectors. The study is performed with a coherent network method, called coherent WaveBurst klimenko2008 (cWB), based on the likelihood analysis . In cWB the data from all detectors in the network is processed simultaneously in order to reconstruct a common GW signal which is consistent with the recorded detector responses. The consistency is measured by the likelihood ratio, which is a function of the source parameters (waveforms and sky location). The most probable source parameters are obtained by maximizing the likelihood ratio over the signal waveforms and sky coordinates. The method performs reconstruction of unmodeled burst signals (arbitrary waveforms) and signals with a certain polarization state: elliptical, linear and circular.
The paper is organized as follows. Possible networks of advanced detectors and their fundamental properties are descussed in section II. In sections III we describe the reconstruction algorithm. The simulation framework for this study is presented in section IV. The results are reported in section V. In sections VI and VII we describe main factors limiting the source reconstruction and discuss the results.
II Detector Networks
In 2001-2010 the LIGO Scientific Collaboration (LSC) and the Virgo Collaboration operated a network of interferometric gravitational-wave detectors which are the most sensitive instruments from the first generation of the GW interferometers (1G). They consist of power-recycled Michelson interferometers with kilometer-scale Fabry-Perot arms designed to detect gravitational waves with frequencies between tens of Hz and several kHz. The two LIGO observatories LIGO are in Hanford, Washington (4 km and 2 km detectors) and in Livingston, Louisiana (4 km detector), and the 3-km Virgo detector Virgo is located in Cascina, Italy. Other gravitational waves interferometers are the 300 m detector TAMA TAMA in Mitaka, Japan, and the 600 m detector GEO600 GEO in Hannover, Germany. Currently all 1G interferometers are decommissioned, except Virgo and GEO600, which continue to take data.
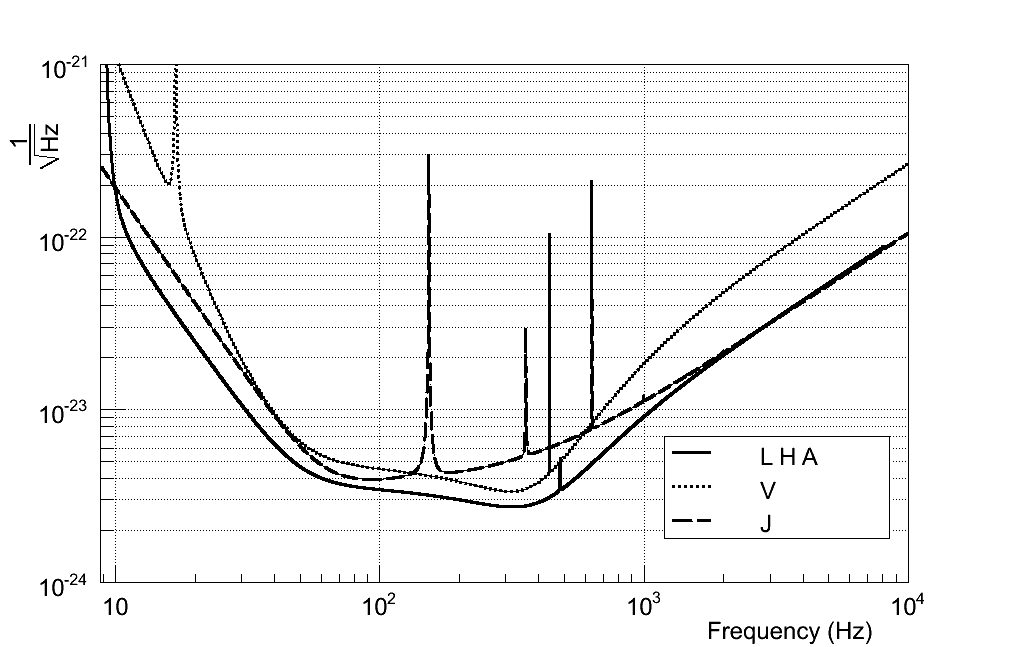
The second-generation GW detectors (2G) are currently under construction. They include the advanced LIGO detectors advLIGO , and the advanced Virgo detector (V) advVirgo which will have by an order of magnitude better sensitivity than the 1G detectors. All advanced LIGO detectors have 4-km long arms, with one detector in Livingston (L) and two identical co-aligned detectors in Hanford (H and H̃). Also there are plans to build the Large Cryogenic Gravitational Telescope (LCGT) LCGT ; LCGT2010 in Japan (the J detector) and possibly move the LIGO H̃ detector to a site in Australia AIGO ; Weiss2010 (the A detector). Figure 1 shows the design sensitivity for the listed 2G detectors. These, hopefully all five interferometers, compose the most advanced GW detector network which will be in operation after 2015.
 |
The network performance greatly depends on the number of detectors in the network, their location and orientation of the detector arms. Table 1 shows the geographical coordinates of the instruments and the orientation of the detector arms used in this study.
| detector | latitude | longitude | orientation |
|---|---|---|---|
| L | 30∘33′46′′N | 90∘46′27′′W | 197.7 |
| H | 46∘27′18′′N | 119∘24′27′′W | 126.0 |
| V | 43∘37′53′′N | 10∘30′16′′E | 70.6 |
| A | 31∘21′30′′S | 115∘42′30′′E | 45.0 |
| J | 36∘15′00′′N | 137∘10′48′′E | 19.0 |
For the Australian instrument the orientation of the detector arms is not yet decided, therefore we consider two possible configurations: Ã - arms are due north and east, and A - arms are rotated counterclockwise by with respect to Ã. Depending what instruments are constructed we consider several network configurations, as listed in Table 2.
II.1 Network sensitivity
The sensitivity of the network of detectors is fully characterized by its noise-scaled antenna pattern vectors and :
| (1) |
where is the variance of the noise and () are the antenna patterns of individual detectors. In general, the is a function of frequency. For a discrete data with the Nyquist frequency in the Fourier or wavelet domain, the is the estimator of the single-sided power spectral density of the detector noise. The power spectral density and the variance of the network noise are defined by the following equation:
| (2) |
Note, that both the and decrease as more detectors are added to the network. A network of K equally sensitive detectors has by a factor lower noise amplitude than the individual detectors.
The antenna patterns depend upon the source coordinates () and the polarization angle , which defines the wave frame of the incoming GW signal . It is convenient to define vectors , and in the dominant polarization wave frame PRD05 where and . The vectors and define a vector of the noise-scaled detector responses to the wave
| (3) |
The inner product calculated over the sampled detector responses gives the estimator of the network signal-to-noise ratio (SNR):
| (4) |
In general, the inner product of two network vectors a and b is defined as
| (5) |
where the sum is taken over the data samples containing the event.
The norms of the antenna pattern vectors and characterize the network sensitivity to the GW polarizations. To illustrate this and other network properties, we assume below that in the signal frequency band the vectors and do not vary much. In this case
| (6) |
where the inner product determines the root-sum-square amplitude of the GW polarizations:
| (7) |
As it follows from Equation 6, the network alignment factor klimenko2008
| (8) |
characterizes the relative network sensitivity to the two GW polarizations. It determines the ratio of the SNRs from each GW component, assuming that in average their sum-square energies are the same: . Closely aligned networks (like LHH̃) have poor sensitivity to the second polarization () making difficult the reconstruction of the full GW signal.
The overall network sensitivity is characterized by the effective power spectral density of the network noise
| (9) |
which depends on the sky coordinates. It determines the average network SNR for a population of GW signals with the average amplitude per polarization:
| (10) |
It is convenient to factorize the sky-dependent part of as
| (11) |
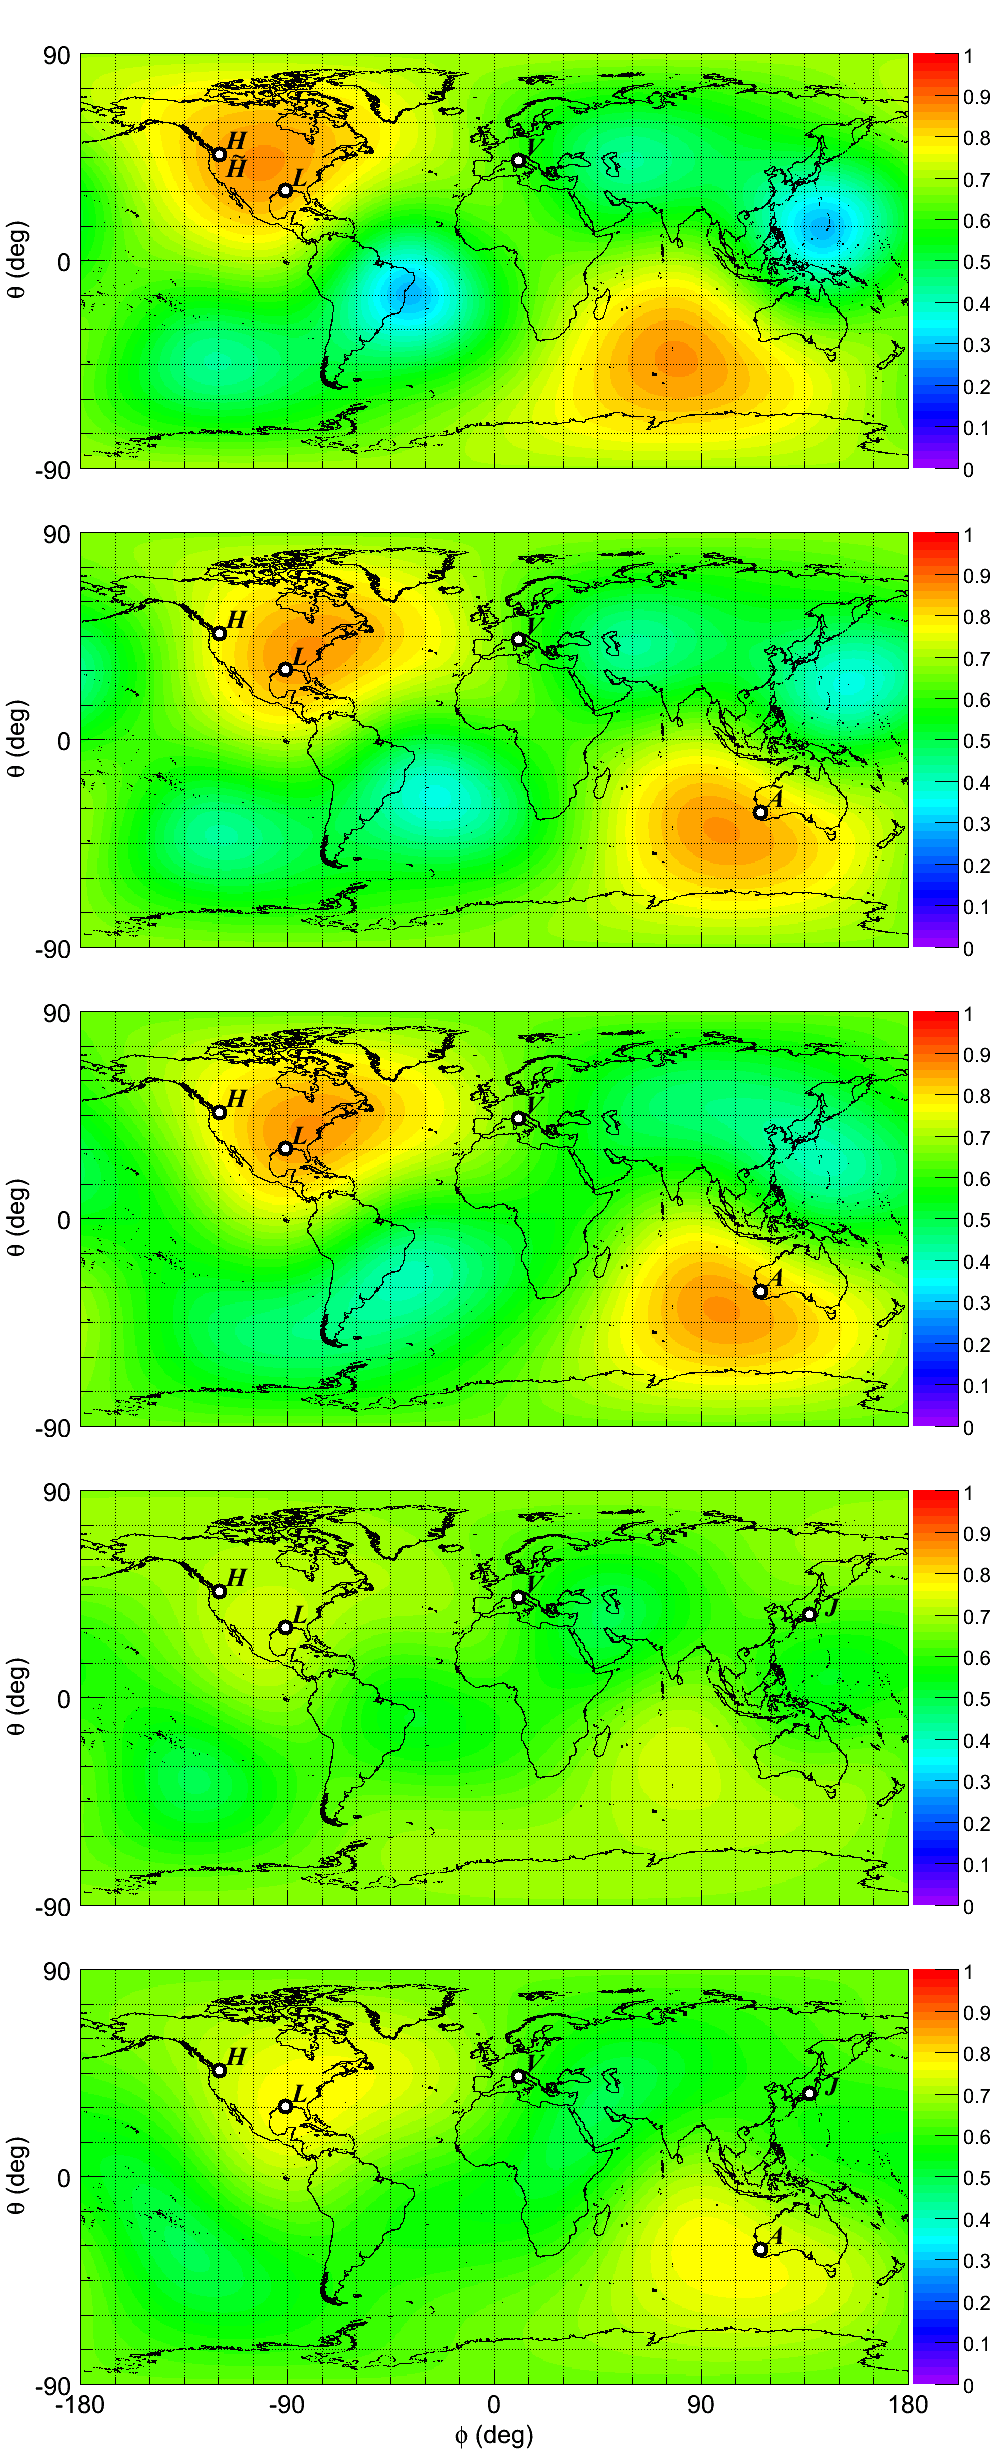
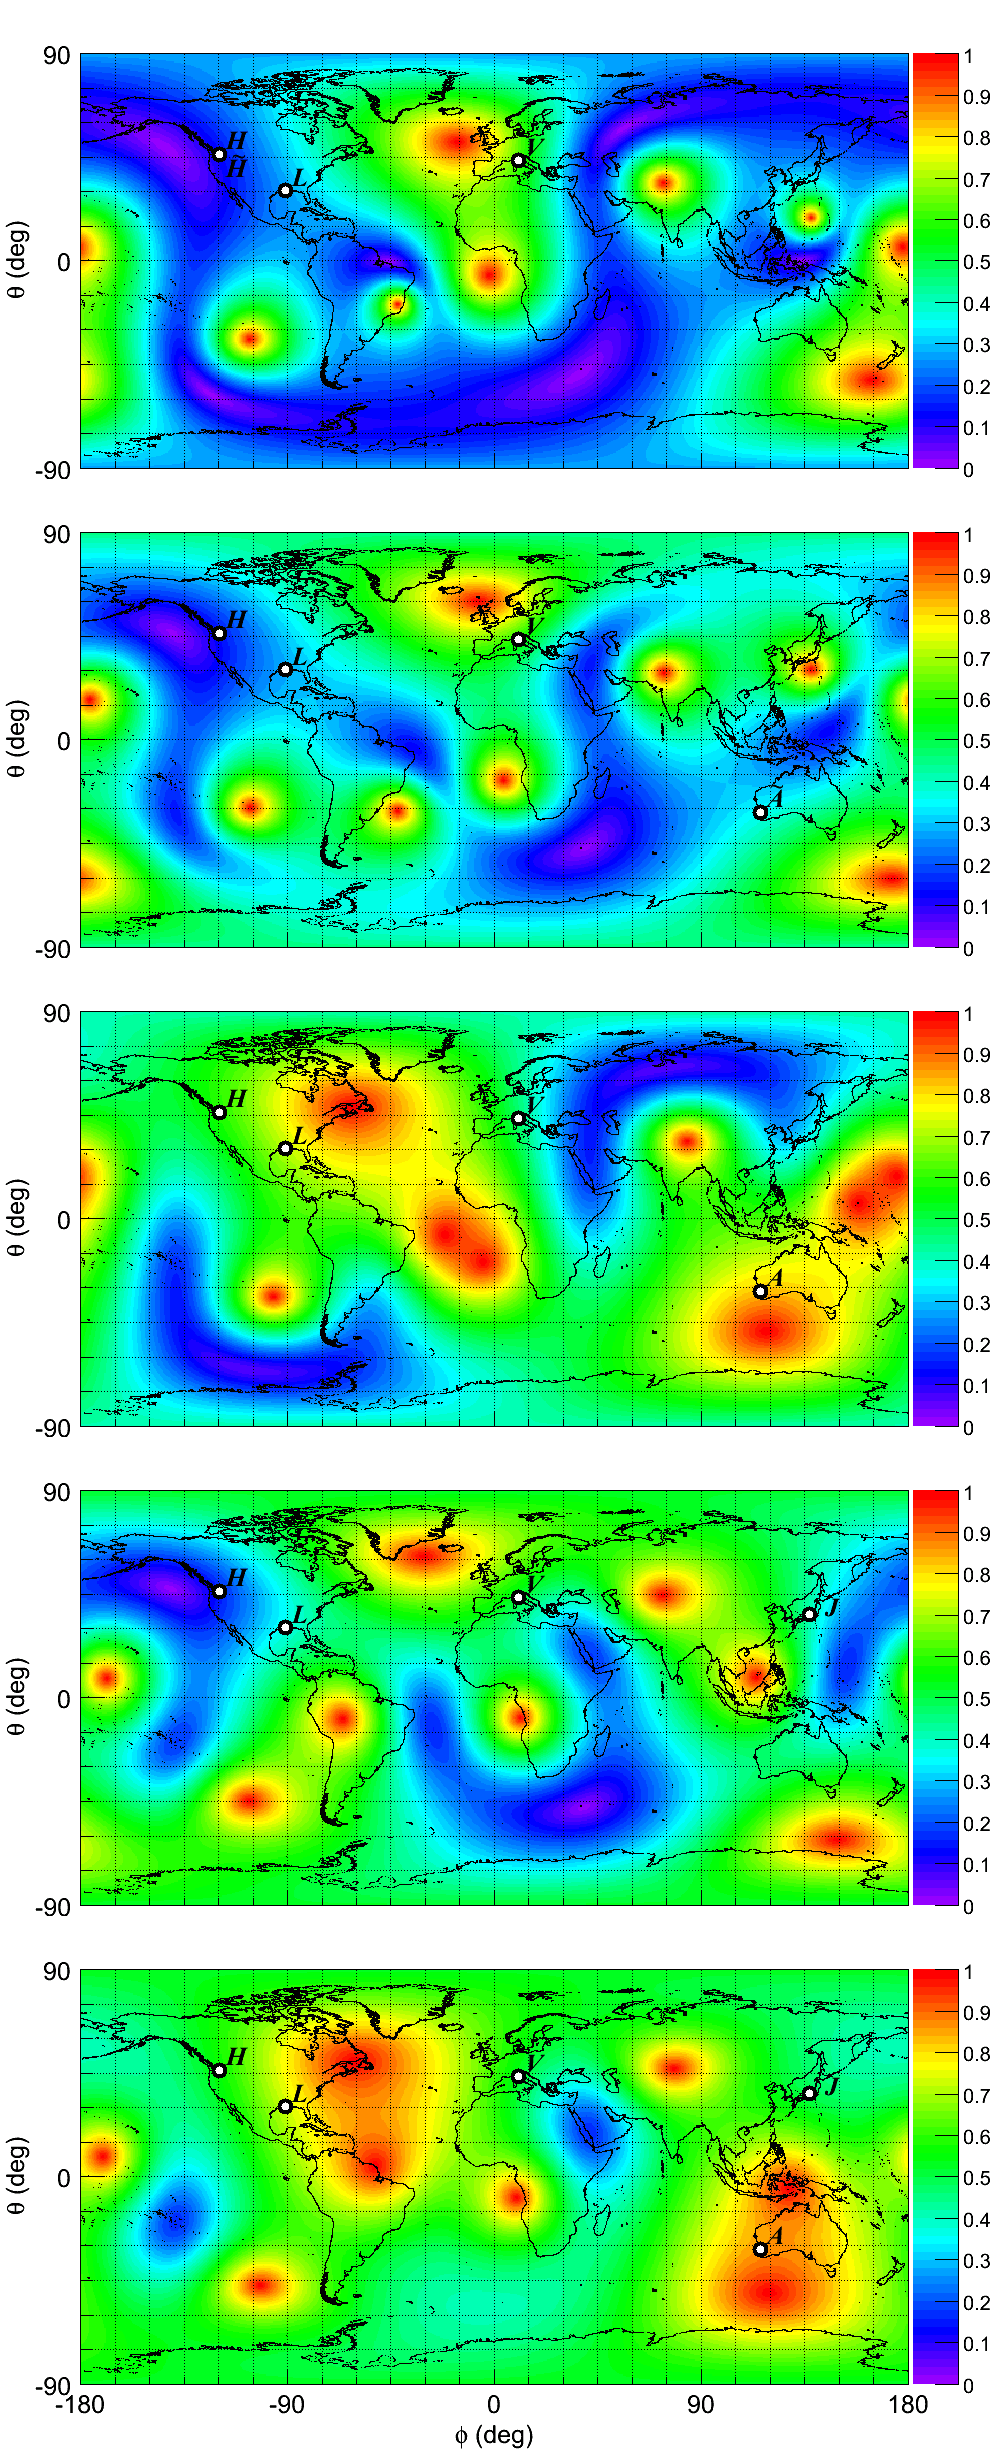
where is the network antenna factor distributed between 0 (low sensitivity) and 1 (high sensitivity). Figure 2 shows the antenna and the alignment factors for different networks as a function of the latitude and longitude of the source (skymaps). Since these network parameters are noise dependent, the skymaps are calculated at the frequency 100 Hz where the advanced detector sensitivities are about the same. The distribution shows how uniform is the network response across the sky. The values of close to unity indicate the same sensitivity to the two GW components. Respectively, the values of close to zero indicate that the second GW component is not measurable for a weak GW signal. As Figure 2 shows, several non-aligned detectors (preferably five) are required for elimination of these blind spots in the sky.
 |
 |
One of the main characteristics of a detector network is its search volume. Given an isotropic distribution of transient sources with the root-square-sum amplitude at the fiducial distance , the search volume is defined as S5-VSR1-y2
| (12) |
where is the detection efficiency. Assuming the same SNR thresholds (see Equation 10), the can be calculated with respect to the volume of the reference network
| (13) |
where and are the averages over the sky. The ratio is quite independent on the search algorithm and the GW source model. Table 2 shows the volume (and detection rate) ratios calculated with respect to the LHV network ().
| LHV | LHH̃V | LHVA | LHVJ | LHVAJ | |
|---|---|---|---|---|---|
| 100 Hz | 1 | 1.66 | 1.65 | 1.39 | 2.09 |
| 300 Hz | 1 | 1.65 | 1.63 | 1.15 | 1.80 |
As more detectors are added to the network the detection rates increase. Being beneficial this increase, however, is not critical for the first direct observation of gravitational waves. More important, the networks with more detectors are likely to be less affected by non-Gaussian and non-stationary noise than the networks with fewer detectors. They are expected to have lower false alarm rates and higher detection confidence for the same threshold. Also, re-location of the LIGO H̃ detector to Australia does not affect the detection rates for both A and à configurations. But, as shown in Figure 2, the LHVA detector configuration would be more preferable for the reconstruction of the GW polarizations than the LHH̃V and LHÃV networks.
III Reconstruction Algorithm
III.1 Coherent network analysis
One possible approach to the coherent network analysis is based on the Neyman-Pearson criterion which defines the likelihood ratio
| (14) |
where is the network data vector, the is the joint probability that the data is only instrumental noise and is the joint probability that a GW signal is present in the data. In general the likelihood ratio is a functional which depends upon the source parameters . One generalization of the Neyman-Pearson criterion is to maximize over . The obtained maximum likelihood ratio statistic reaches its maximum for the best match of the corresponding waveform to the data. If the source model allows calculation of the GW waveforms as a function of a small number of source parameters (for example, for binary black holes), then a template bank can be generated. In this case the variation is performed over the template bank and the likelihood approach is equivalent to a matched filter. The cWB algorithm searches for unmodeled burst signals. In contrast to the binary black hole sources, where the number of parameters is relatively small, the parameters characterizing the unmodeled bursts are essentially the signal amplitudes themselves at each instance of time. It is not possible to generate a template bank for such a large parameter space. Instead, the best matching waveform is found by variation of over unknown GW waveforms .
III.2 GW waveforms
For stationary Gaussian noise the coherent WaveBurst algorithm defines the likelihood as twice the logarithm of the likelihood ratio
| (15) |
where the vector represents whitened data from detectors with uncorrelated noise
| (16) |
The sampled detector amplitudes take into account the time-of-flight delays , which in turn depend upon the source coordinates and . The solutions for the GW waveforms , defined in the dominant polarization frame, are found by the variation of the likelihood functional (Eq. (15)):
| (17) | |||
| (18) |
The maximum likelihood ratio statistic is calculated by substituting the solutions into . The result can be written as
| (19) |
where the matrix is the projection constructed from the components of the unit vectors and along the directions of the and respectively:
| (20) |
The kernel of the projection is the signal plane defined by these two vectors. The null space of the projection defines the reconstructed detector noise which is referred to as the null stream.
The projection matrix is invariant with respect to the rotation in the signal plane where any two orthogonal unit vectors can be used for construction of the . Therefore one can select unit vectors and such that and then
| (21) |
The unit vector defines the vector
| (22) |
whose components are the standard likelihood estimators of the noise-scaled detector responses .
III.3 Source coordinates
The maximum likelihood ratio statistic is a function of the sky coordinates and . If no information regarding the source coordinates is available then the variation over the sky should be also performed. It is expected that takes maximum close to a true source location, however, it is not necessarily the optimal statistic for the coordinate reconstruction. The coherent part of the likelihood quadratic form
| (23) |
has a strong dependence on the time delays between the detectors and therefore the coherent energy is expected to be a better statistics for the source localization. On the other hand the is a biased estimator: for an arbitrary GW signal it may take maximum value away from the true source location. To minimize the bias, the sky statistic is constructed in the following way
| (24) |
where is the total normalized energy of the signal and noise. This statistic penalizes the sky locations with low values of and large values of the null energy , and it reduces to the maximum likelihood statistic when the ratio is small. The is used to rank different sky locations and calculate the probability distribution of the estimated source coordinates in the sky.
III.4 Model-dependent constraints
The likelihood method offers a convenient framework for introduction of constraints arising from the source models. Unlike for template searches where accurate waveforms are required, in principle, any useful information about sources can be used to constraint the likelihood functional. This allows customization of the generic burst algorithms in order to search for specific, but not very well modeled sources. One obvious class of constraints is related to the different polarization states of the GW signals. For example, some of the core collapse models predict waveforms with a linear polarization SN or random polarization g-modes Ott . Merging binary neutron stars or black holes are expected to produce elliptically polarized gravitational wave signals Pankow . Also the neutron star mergers can be the source of the short GRB signals grb070201 where relativistic jets are emitted along the rotation axis of the binary system and in this case the associated gravitational waves should have the circular polarization. The cWB algorithm allows searches with several types of the polarization constraints: circular, linear, elliptical and random (or unmodeled search). All these searches are used in the study to estimate possible improvement of the source localization if the reconstruction is constrained by the source model.
IV Simulations
IV.1 Injected signals
Several types of “ad hoc” waveforms were used to study the performance of the detector networks for different signal frequencies and polarization states. They were injected into the simulated detector data streams in a wide range of signal-to-noise ratios with the coordinates uniformly distributed in the sky. The Gaussian detector noise was simulated with the amplitude spectral density presented in Figure 1. The injected signals were band-limited white-noise waveforms (WNB) with the random polarizations and sine-Gaussian waveforms (SG) with the linear and circular polarizations. The WNB waveforms were bursts of white Gaussian noise in a frequency band which have a Gaussian time profile with the standard deviation (see Table 3). The random polarization waveforms and were selected to have the same square-sum energy:
| Waveform | (s) | (Hz) | (Hz) |
|---|---|---|---|
| WNB | 0.1 | 250 | 350 |
| WNB | 0.1 | 1000 | 2000 |
The SG waveforms were simulated as follows
| (25) | |||
| (26) |
where is the waveform central frequency, and are the waveform amplitudes, and is related to the waveform quality factor (see Table 4). The amplitude parameters were for linear polarization and for circular polarization. During the analysis the amplitude of injected events varied to simulate events with different signal-to-noise ratios.
| Waveform | (Hz) | Q | Polarization |
|---|---|---|---|
| SGQ3 | 235/1053 | 3 | Linear |
| SGQ9 | 235/1053 | 9 | Linear |
| SGCQ9 | 235/1053 | 9 | Circular |
IV.2 Error regions
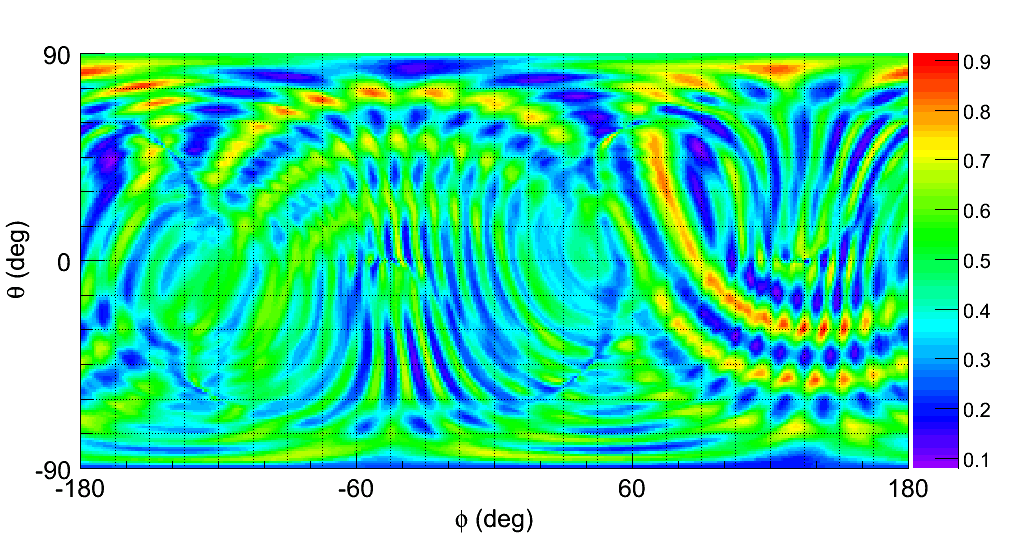
The injected signals are used for estimation of the accuracy of the coordinate reconstruction. For each injected event the skymaps is calculated with the angular resolution of square degrees: sky locations (pixels) total. Figure 3 shows an example of such a skymap for one of the SGQ9 (235Hz) injections.
 |
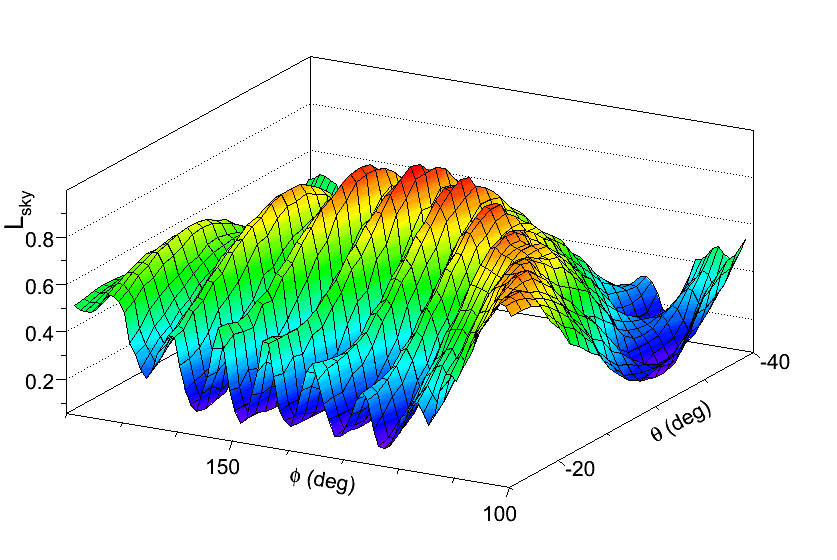 |
For such events it is typical to see a pattern of fringes with large value of corresponding to a good match between responses due to a common GW signal reconstructed in different detectors. Such sky points are the most probable as the source location. Depending on many factors, such as the signal strength, waveform morphology, etc, the statistic can be well localized in a single small cluster in the sky or distributed over a large area which can be also split into several disjoint clusters. This type of ambiguity is typical for the least constrained unmodeled search and networks with only three spatially separated detectors.
To characterize the accuracy of the coordinate reconstruction for a single injection we define an error region: total area of all pixels in the sky which satisfy the condition , where () is the injection sky location. Given a population of injected signals uniform in the sky, the 50 CL and 90 CL error regions, containing and of injections respectively, can be calculated. The median error angle is defined as the square root of the error area.
The skymap can be also converted into the probability skymap which is normalized to unity if integrated over the entire sky. In this case the 50 CL and 90 CL error regions are represented by the most probable pixels with the cumulative probability of and respectively. Such probability skymaps are not relevant for the simulation studies we perform, but they are important for the analysis of real data.
V Results
V.1 Coordinate Reconstruction
The accuracy of the coordinate reconstruction strongly depends on the strength of detected signals which can be conveniently characterized by the average (per detector) signal-to-noise ratio
| (27) |
For example, Figure 4 shows the dependence of the median error angle on for all injected signals, which is well approximated by a function
| (28) |
The parameter A is the median error angle for events with very large SNR and A+B+C is the median error angle for events with .
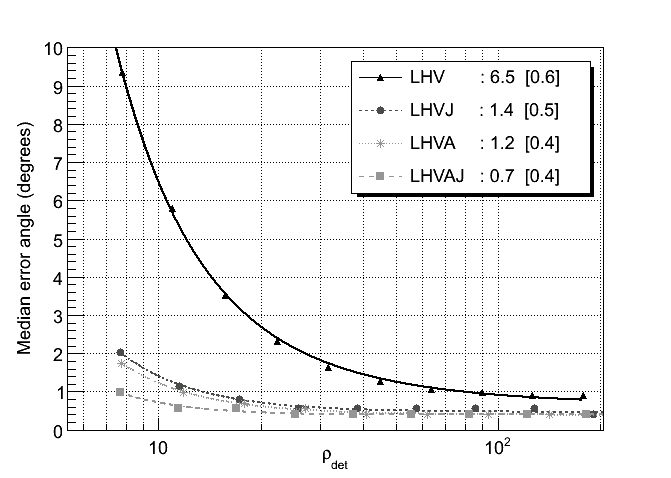
Figure 4 also shows a dependence of the coordinate resolution on the number of detector sites in the network. There is a significant improvement of the resolution when more sites are added to the network. This is particularly noticeable at low SNR, which is very important because the anticipated GW signals are likely to be weak.
Because of several limiting factors (see section VI) the reconstruction is not uniform in the sky. Figure 5 shows the distribution of the median error angle across the sky for different network configurations. There is a dramatic improvement of the coordinate reconstruction for the LHVA, ALVJ and LHVAJ networks. However for the 4-site networks there remain areas where the source localization is poor.
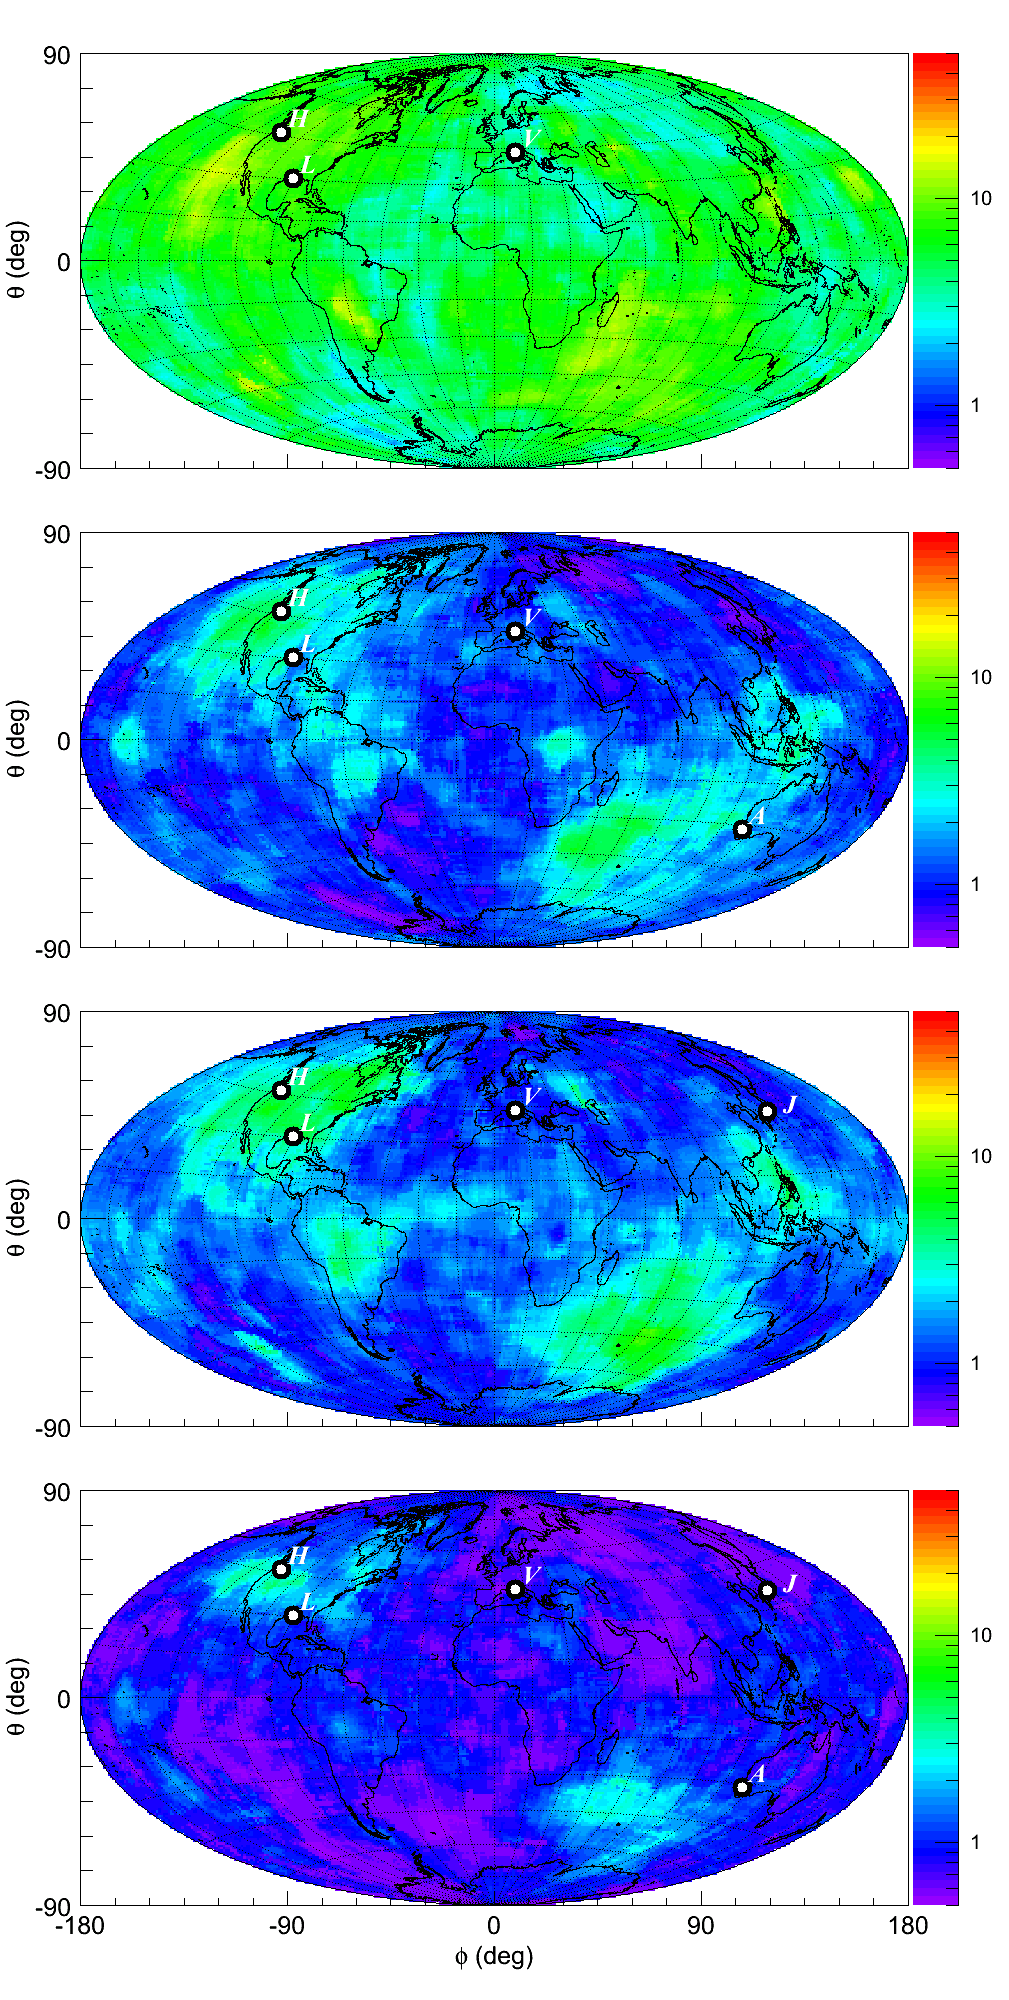
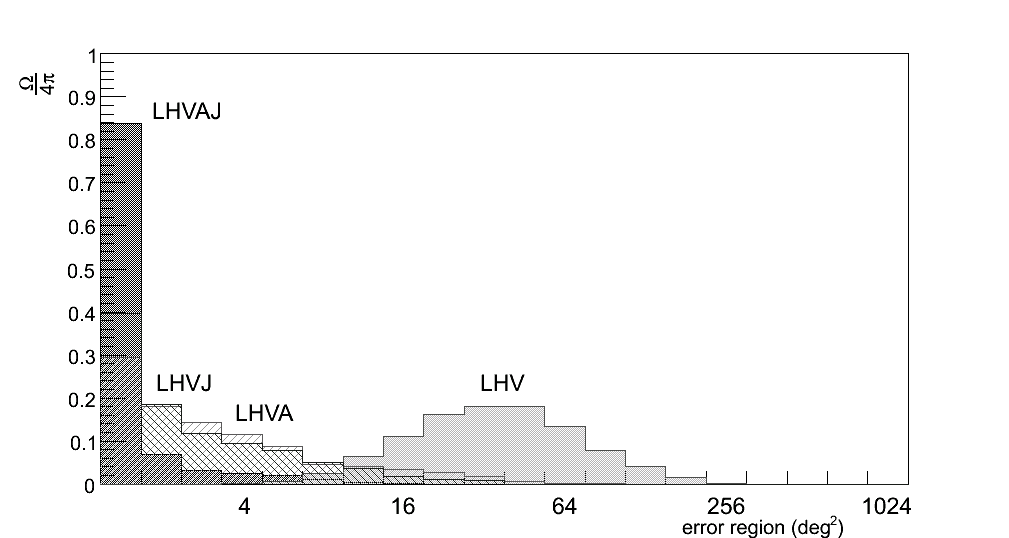
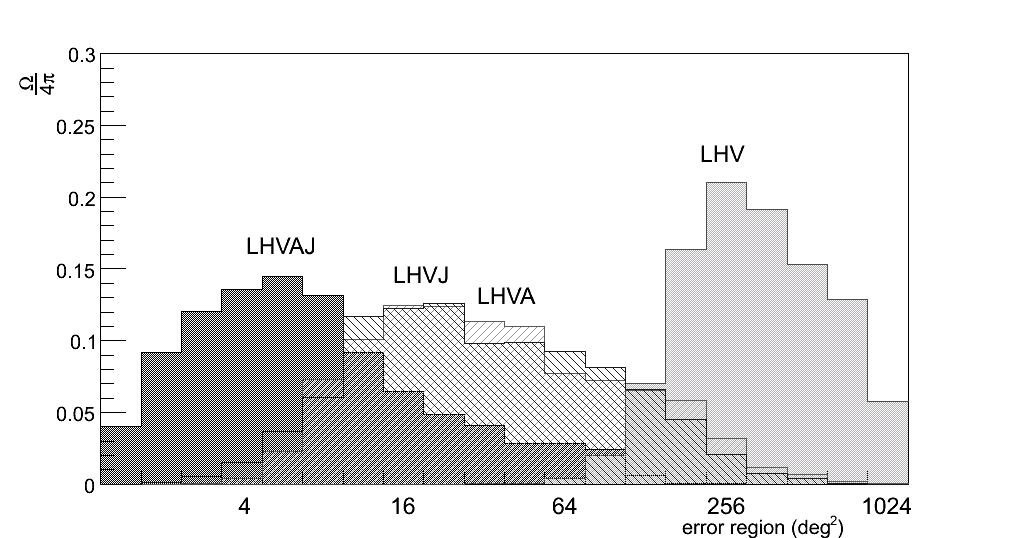
Figure 6 compares the pointing capabilities of the network consisting of three, four and five sites by presenting the fraction of the sky where the reconstruction is performed with a given error area. This figure also shows a significant improvement of the source localization (particularly for the error area) as more sites are used for the reconstruction. The best coordinate resolution is obtained with the 5-site network and it is compatible with the field-of-view of most optical telescopes.
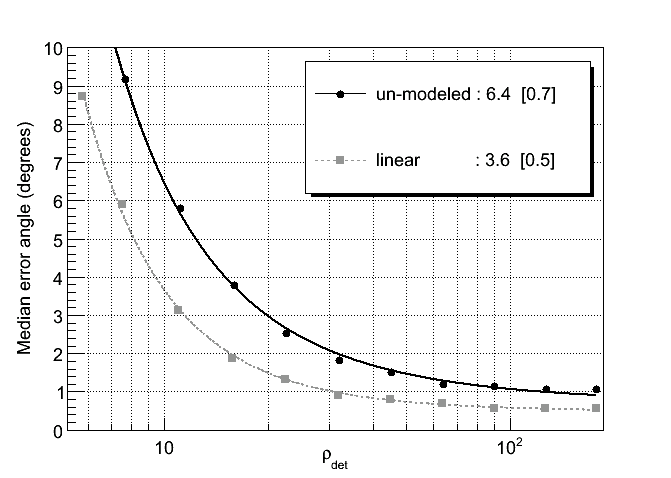
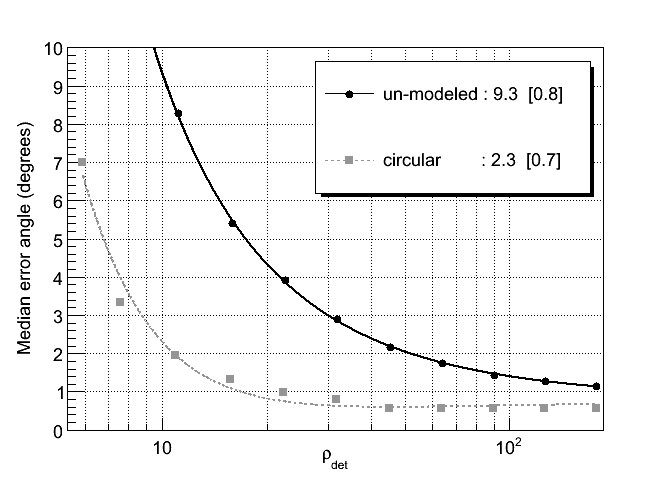
The coordinate resolution depends also on the waveform morphology and the polarization content of GW signals (see for details Section VI.2). If reconstructed with the least constrained unmodeled algorithm, the SG waves with linear and circular polarization have less accurate source localization (see Figure 7). However, the coordinate resolution can be significantly improved if reconstruction is constrained by the source polarization model.
In general, the reconstruction improves as more accurate models, with fewer free parameters, are used. We expect, for example, that the template analysis of waves from the coalescence of binary neutron stars and black holes cbc2010 should result in a better sky localization than for the unmodeled burst search.
Tables 5-8 summarize the results of the analysis for different injection signals, source polarization models and networks by showing the fit parameters A and A+B+C, which correspond to the median error angle for events with high and low SNR, respectively.
| unmodeled | LHV | LHVA | LHVJ | LHVAJ |
|---|---|---|---|---|
| WNB LF | 4.8∘/0.7∘ | 1.1∘/0.4∘ | 1.8∘/0.4∘ | 0.8∘/0.4∘ |
| WNB HF | 4.5∘/0.4∘ | 0.6∘/0.4∘ | 0.8∘/0.4∘ | 0.4∘/0.4∘ |
| SGQ9 LF | 6.4∘/0.7∘ | 1.4∘/0.4∘ | 1.6∘/0.4∘ | 1.0∘/0.4∘ |
| SGQ9 HF | 4.1∘/0.9∘ | 1.0∘/0.4∘ | 1.0∘/0.4∘ | 0.5∘/0.4∘ |
| SGQ3 LF | 9.4∘/0.5∘ | 1.1∘/0.5∘ | 1.5∘/0.4∘ | 0.9∘/0.4∘ |
| SGQ3 HF | 6.3∘/0.4∘ | 0.9∘/0.4∘ | 1.0∘/0.4∘ | 0.5∘/0.4∘ |
| SGCQ9 LF | 9.3∘/0.8∘ | 1.7∘/0.4∘ | 2.0∘/0.4∘ | 0.9∘/0.4∘ |
| SGCQ9 HF | 5.5∘/1.1∘ | 1.4∘/0.4∘ | 1.7∘/0.4∘ | 0.9∘/0.4∘ |
| elliptical | LHV | LHVA | LHVJ | LHVAJ |
|---|---|---|---|---|
| SGQ9 LF | 5.3∘/0.9∘ | 1.2∘/0.4∘ | 1.4∘/0.5∘ | 0.9∘/0.4∘ |
| SGQ9 HF | 4.5∘/0.8∘ | 0.8∘/0.4∘ | 0.9∘/0.6∘ | 0.5∘/0.4∘ |
| SGQ3 LF | 3.6∘/0.6∘ | 1.3∘/0.4∘ | 1.1∘/0.4∘ | 0.9∘/0.4∘ |
| SGQ3 HF | 4.4∘/0.7∘ | 0.9∘/0.4∘ | 0.8∘/0.4∘ | 0.5∘/0.4∘ |
| SGCQ9 LF | 8.2∘/0.7∘ | 1.9∘/0.4∘ | 1.5∘/0.4∘ | 0.9∘/0.4∘ |
| SGCQ9 HF | 7.2∘/0.8∘ | 1.4∘/0.4∘ | 1.1∘/0.4∘ | 0.9∘/0.4∘ |
| linear | LHV | LHVA | LHVJ | LHVAJ |
|---|---|---|---|---|
| SGQ9 LF | 3.6∘/0.5∘ | 1.1∘/0.4∘ | 1.1∘/0.4∘ | 0.7∘/0.4∘ |
| SGQ9 HF | 4.5∘/0.6∘ | 0.8∘/0.4∘ | 0.9∘/0.4∘ | 0.5∘/0.4∘ |
| SGQ3 LF | 2.7∘/0.5∘ | 1.1∘/0.4∘ | 0.9∘/0.4∘ | 0.7∘/0.4∘ |
| SGQ3 HF | 4.5∘/0.5∘ | 0.8∘/0.4∘ | 0.9∘/0.4∘ | 0.5∘/0.4∘ |
| circular | LHV | LHVA | LHVJ | LHVAJ |
|---|---|---|---|---|
| SGCQ9 LF | 2.3∘/0.6∘ | 0.8∘/0.4∘ | 1.0∘/0.4∘ | 0.7∘/0.4∘ |
| SGCQ9 HF | 1.7∘/0.6∘ | 0.8∘/0.4∘ | 0.6∘/0.4∘ | 0.6∘/0.4∘ |
V.2 Waveform Reconstruction
The signal waveforms are obtained from the solution of the likelihood functional. Those are the reconstructed detector response as defined by Eq. 22. To characterize the algorithm performances on waveform reconstruction we consider the normalized residual energy :
| (29) |
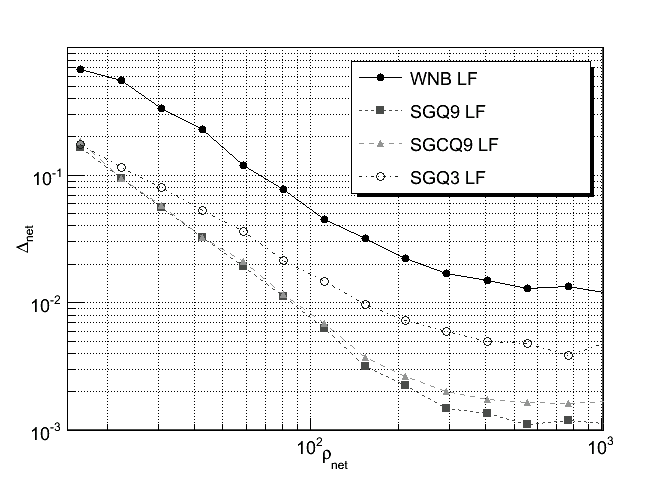
where the inner products are defined by Equation 5. The same as for the coordinate reconstruction, the accuracy of the waveform reconstruction strongly depends on the strength of detected signal and the waveform morphology. At low SNR, the reconstruction is affected by the detector noise, however it improves with the increasing value of SNR (see Figure 8). At high SNR, the reconstruction accuracy reaches a limit due to the finite precision of the algorithm. In this paper we do not present a detailed study of the waveform reconstruction. However, such work is planned in the future.
VI Factors limiting reconstruction
In this section we describe the factors which limit the accuracy of the coordinate reconstruction including: a) angular and strain sensitivity of the detectors, b) polarization content of the signals, c) calibration uncertainties and d) limitations of the reconstruction algorithm.
VI.1 Antenna patterns and detector noise
The angular and the strain sensitivity of the network is fully characterized by its noise-scaled antenna pattern vectors (see Eq. 1). Due to unfortunate sky location or elevated detector noise, the components of these vectors corresponding to an individual detector may be small with respect to the other detectors, effectively excluding this detector from the detection and reconstruction of a marginal GW signal. For example, for a source at () the angular sensitivity of the V1 detector is too low () and it can not contribute to the reconstruction unless the GW signal is very strong. For the LHV network it means that for a significant fraction of the sky the triangulation is performed with only two detectors, which is not sufficient for the accurate source localization. For this reasons it is very desirable to have four or more detectors in the network operating in coincidence.
VI.2 Waveforms and polarization
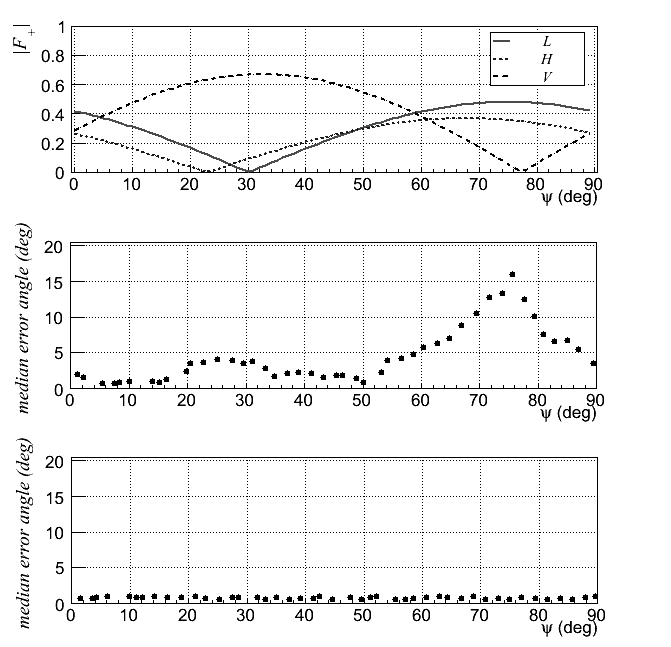
For a given direction to the source, the reconstruction accuracy may be very different depending on the signal polarization. For example, a linearly polarized signal ( may not be measured by one of the detectors for some values of the polarization angle when is almost null. As a result, with the 3-site networks the source localization for such signals is expected to be poor (see Figure 9). On contrary, signals with two polarization components can be localized well via their cross component even at the minimum of .
 |
VI.3 Calibration uncertainties
The coordinate reconstruction may be affected by the calibration uncertainties of recorded data streams. Typically the calibration uncertainties are of the order of 10% in the amplitude and few degrees in the phase S5-calib . These systematic distortions of the GW signal may result in a systematic shift of the reconstructed sky location away from a true source location.
To estimate this effect we introduce a variation of the amplitude and phase of the injected detector responses. The amplitude variation is selected randomly between or and the random time shifts of or 0 are introduced. The non-zero time shifts correspond to a phase shift of and at the low and high frequencies respectively. Such “misscalibration” is applied to all detectors in the network. The results are reported in table 9 for the LHV network. They show that depending on the signal morphology and bandwidth the calibration uncertainties may affect the coordinate reconstruction. The effect of calibration uncertainties is particularly visible at high SNR where the angular resolution is less affected by the detector noise. Similar studies for the LHVAJ network do not show, even at high SNR, any significant impact of the calibration errors used in the analysis. This is an expected result, because a better constrained LHVAJ network provides more robust source localization than the LHV network.
| Waveform | - | Amplitude | Phase |
|---|---|---|---|
| WNB LF | 0.7∘ | 1.0∘ | 0.9∘ |
| WNB HF | 0.4∘ | 0.6∘ | 0.8∘ |
| SGQ9 LF | 0.7∘ | 2.8∘ | 1.2∘ |
| SGQ9 HF | 0.9∘ | 1.6∘ | 1.4∘ |
| SGQ3 LF | 0.5∘ | 2.1∘ | 1.0∘ |
| SGQ3 HF | 0.4∘ | 1.1∘ | 1.0∘ |
| SGCQ9 LF | 0.8∘ | 2.5∘ | 1.1∘ |
| SGCQ9 HF | 1.1∘ | 1.9∘ | 2.0∘ |
VI.4 Reconstruction algorithm
There are several factors limiting the accuracy of the coordinate and waveform reconstruction due to the cWB algorithm. For high SNR events the coordinate resolution is limited by the cWB sky segmentation which is degrees. Therefore the error angle can not be less than degrees. Also for the high frequency events the coordinate resolution is limited by the discrete time delays (see section III) with the step of 1/16384 seconds and by the accuracy of the time delay filter (few percent) used in the analysis. Also in the analysis we did not use any unmodeled constraint specific for individual networks, which, in principle, may improve reconstruction. These limitations are not fundamental and the algorithm performance can be improved in the future.
VII Conclusion
In the paper we present the results of the source localization and reconstruction of GW waveforms with the networks of GW interferometers. For a general characterization of the detector networks we introduce few fundamental network parameters, including the effective noise, and the network antenna and alignment factors. The effective power spectral density of the network noise determines the average network SNR for a given population of GW signals. For each direction in the sky the network performance is characterized by its antenna and alignment factors. The antenna factor describes how uniform is the network response across the sky. The alignment factor, which strongly depends on the number of detectors and the orientation of their arms, determines the relative contribution of the two GW polarizations into the total network SNR.
It requires several non-aligned detectors (preferably more than three) for a robust detection and reconstruction of both GW components. The coordinate reconstruction strongly depends on the signal waveforms, network SNR and the number of detector sites in the network. The reconstruction can be significantly improved when it is constrained by the signal model. Although a crude coordinate reconstruction (ring in the sky) is possible with the networks of two spatially separated sites, at least three detector sites are required to perform the source localization. The accuracy of the localization dramatically increases for networks with more than three sites, particularly for the low SNR events. For example, the LHH̃V and LHVA networks are expected to have about the same detection rates, however, the 4-site LHVA network would have much better performance for the accurate reconstruction of GW signals. The pointing resolution required for joint observations with the electromagnetic telescopes is achievable with the networks consisting of four sites. The LHVAJ network demonstrates further improvements, both in the detection and reconstruction of GW signals, reaching a sub-degree angular resolution. In addition, due to the limited duty cycle of the detectors, both the LCGT and the Australian detectors will significantly increase the observation time when any of 4-site networks are operational.
The advanced LIGO and Virgo detectors are very capable of the first direct detection of gravitational waves. However, for better reconstruction of the GW signals more detectors are required. Extra detectors introduce an important redundancy which lower the impact of limited duty cycle of the detectors, makes the coordinate reconstruction more accurate, and less dependent on the waveform morphology and calibration uncertainties. The construction of the LCGT and the detector in Australia will significantly enhance the advanced LIGO-Virgo network and these detectors will play a vital role in the future GW astronomy.
VIII Acknowledgements
The authors are thankful to the LIGO-Australia committee members R. Weiss, P. Saulson, S. Sathyaprakash, F. Raab, P. Fritschel and S. Finn for useful discussion of the results. Also the authors appreciate suggestions by L. Bildsten on better presentation of the results, particularly in Figure 6. This work was supported by the US National Science Foundation grants PHY-0855044 and PHY-0855313 to the University of Florida, Gainesville, Florida.
References
References
- (1) B.P. Abbott et al., Rep. Prog. Phys 72, 076901 (2009)
- (2) F. Acernese et al., Class. Quantum Grav. 23, S635 (2006)
- (3) J. Abadie et al, arXiv:1003.2481v3 [gr-qc] June 1, 2010
- (4) B.P. Abbott et al, Phys. Rev. D 80, 047101 (2009)
- (5) J. Kanner et al, Class. Quantum Grav. 25, 184034 (2008).
- (6) R. Fender et al, Proceedings of Science, MQW6, 104 (2006)
- (7) http://www.naic.edu
- (8) N. Gehrels, J.K. Cannizzo and J.P. Norris, New Journal of Physics, 9, 37 (2007)
- (9) C.W. Akerlof et al, Publications of the Astronomical Society of the Pacific, 115, 132 (2003)
- (10) C. Baltay, C. et al, Publications of the Astronomical Society of the Pacific, 119, 1278 (2007)
- (11) A. Klotz, M. Bor, J.L. Atteia and B. Gendre, The Astronomical Journal, 137, 4100 (2009)
- (12) M. Ageron et al. [ANTARES Collaboration], Astropart. Phys. 31 (2009) 277
- (13) R. Abbasi et al. [IceCube Collaboration], Astrophys. J. 701 (2009) L47
- (14) J. Abadie et al, Class. Quantum Grav. 27, 173001, (2010)
- (15) http://www.lsst.org/lsst
- (16) http://pan-starrs.ifa.hawaii.edu/public/
- (17) http://www.tmt.org/
- (18) P. Jaranowski and A. Krolak, Phys. Rev. D 49, 1723 (1994)
- (19) J. Markowitz, M. Zanolin, L. Cadonati, and E. Katsavounidis, Phys. Rev. D 78, 122003 (2008)
- (20) S. Feirhurst, New J. Phys. 11, 123006 (2009)
- (21) L. Wen and Y. Chen, Phys. Rev. D 81, 082001 (2010)
- (22) Y. Gürsel and M. Tinto, Phys. Rev. D 40 (1998)
- (23) É.E. Flanagan and S.A. Hughes, Phys. Rev. D 57, 4566 (1998).
- (24) S. Klimenko, S. Mohanty, M. Rakhmanov and G. Mitselmakher, Phys. Rev. D 72, 122002 (2005)
- (25) S.Klimenko et al, Class. Quantum Grav. 25, 114029 (2008)
- (26) A.C. Searle, P.J. Sutton and M. Tinto, Class. Quantum Grav., 26, 155017 (2009)
- (27) D. Buskulic for the LIGO and Virgo collaborations, Class. Quantum Grav., 27, 194013 (2010)
- (28) B.F. Schutz and M. Tinto, Mon. Not. R. Astron. Soc., 224, 131-154 (1987).
- (29) A. C. Searle, S. M. Scott, D. E. McClelland and L. S. Finn, Phys. Rev. D 73, 124014 (2006).
- (30) R. Weiss et al. LIGO document T1000251-v1, LIGO Scientific Collaboration, 2010. https://dcc.ligo.org/cgi-bin/DocDB/ShowDocument?docid=11604
- (31) B.F. Schutz, submitted to Classical and Quantum Gravity.
- (32) M. Ando et al., Phys. Rev. D 71 082002 (2005).
- (33) H. Luck et al., Class. Quantum Grav. 23, S71 (2006)
- (34) G. M. Harry and the LIGO Scientific Collaboration, Class. Quantum Grav. 27, 084006 (2010)
- (35) G. Losurdo et al., VIR-089A-08 (2008)
- (36) T. Uchiyama for the LCGT collaboration, Class. Quantum Grav. 21, S1161 (2004)
- (37) K. Kuroda for the LCGT collaboration, Class. Quantum Grav. 27, 084004 (2010)
- (38) D.G. Blair for the AIGO Collaboration, Journal of Physics: Conference Series 122 (2008) 012001
- (39) J. Abadie et al, Phys. Rev. D 81, 102001 (2010)
- (40) J. Abadie et al, Nucl. Instrum. Meth. A624, 223 (2010)
- (41) C. Ott, A. Burrows, L .Dessart and E. Livne, Phys. Rev. Let. 96, 201102 (2006)
- (42) C. Ott, Classical Quantum Gravity 26, 063001 (2009)
- (43) C. Pankow et al., Class. Quantum Grav. 26, 204004 (2009)
- (44) B.P. Abbott et al, Astrophys. J. 681 1419 (2008)
- (45) B.P. Abbott et al, Phys. Rev. D 82, 102001 (2010)