Hysteresis in the spectral states of the neutron star low-mass X-ray binary EXO 1745–248
Abstract
We study the low-frequency timing properties and the spectral state evolution of the transient neutron star low-mass X-ray binary EXO 1745–248 using the entire Rossi X-ray Timing Explorer Proportional Counter Array data. We tentatively conclude that EXO 1745–248 is an atoll source, and report the discovery of a Hz low-frequency quasi-periodic oscillation and Hz peaked noises. If it is an atoll, this source is unusual because (1) instead of a ‘C’-like curve, it traced a clear overall clockwise hysteresis curve in each of the colour-colour diagram and the hardness-intensity diagram; and (2) the source took at least 2.5 months to trace the softer banana state, as opposed to a few hours to a day, which is typical for an atoll source. The shape of the hysteresis track was intermediate between the characteristic ‘q’-like curves of several black hole systems and ‘C’-like curves of atolls, implying that EXO 1745–248 is an important source for the unification of the black hole and neutron star accretion processes.
keywords:
accretion, accretion discs — methods: data analysis — stars: neutron — techniques: miscellaneous — X-rays: binaries — X-rays: individual (EXO 1745–248)1 Introduction
The spectral states and the correlated timing properties of neutron star and black hole low-mass X-ray binaries (LMXBs) can be very useful to understand the extreme environments of these sources (van der Klis, 2006). An excellent way to study these properties is to track these sources in the colour-colour diagram (CD; hard colour (HC) vs. soft colour (SC)) and in the hardness-intensity diagram (HID; hard colour vs. intensity; see § 2). From the beginning of an outburst, the intensity of a transient black hole source increases, typically keeping the HC at a near-constant value. Near the highest intensity the HC value quickly decreases, followed by an intensity decrease at a lower HC value, and a soft-to-hard transition at a lower intensity value. Thus a black hole LMXB typically traces a ‘q’-like hysteresis curve in the HID (van der Klis, 2006; Belloni, 2009). It is usually believed that neutron star LMXBs do not trace hysteresis curves in CD/HIDs (van der Klis, 2006). For example, the near-Eddington Z sources trace out roughly ‘Z’ shaped tracks on time scales of hours to a day, while the less luminous atoll sources have ‘C’ shaped tracks (van Straaten et al., 2003; van der Klis, 2006). The lower HC banana-like portion (BS) of the ‘C’ track can be divided into upper banana (UB), lower banana (LB) and lower left banana (LLB) based on spectral and timing properties. The BS is traced out on time scales of hours to a day without any hysteresis (van der Klis, 2006). On the other hand, the higher HC extreme island state (EIS) is traced out in days to weeks, and secular motions in the form of parallel tracks are seen in EIS. An atoll source moves from EIS to BS via an island state (IS). Probably the only transient atoll source showing a ‘q’-like hysteresis HID curve is Aql X-1 (Maitra and Bailyn (2004); Reig et al. (2004); see also Belloni et al. (2007) for 4U 1636–53 tracks). Such neutron star LMXBs, and more importantly sources showing intermediate tracks between ‘q’ and ‘C’, can be very useful (1) to unify the black hole and neutron star accretion processes, and (2) to sort out the mismatch between the standard EIS-IS-BS framework and the general hysteresis phenomena. In this Letter, we show that the bursting neutron star LMXB EXO 1745–248 (Markwardt and Swank, 2000; Wijnands et al., 2002; Heinke et al., 2003) is such an intermediate source with unique properties.
2 Data Analysis and Results
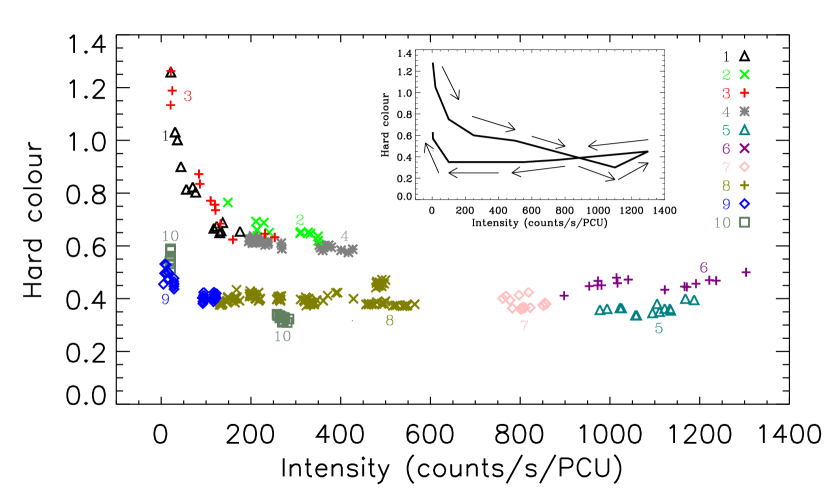
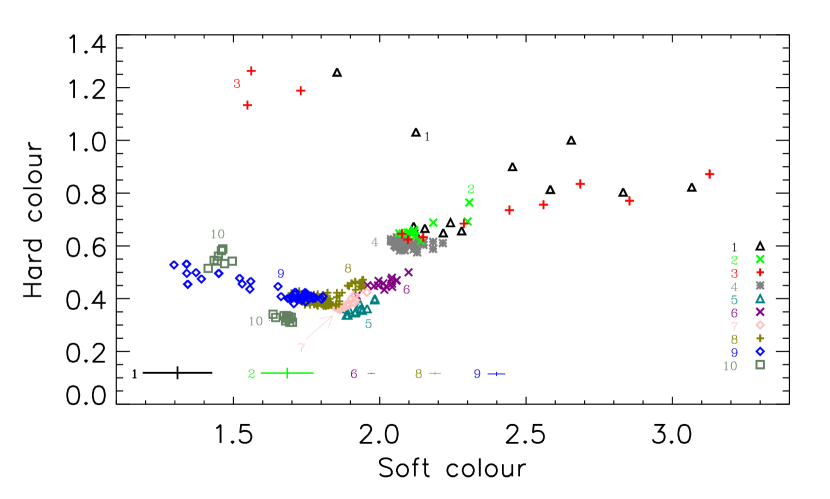
The neutron star transient LMXB EXO 1745–248 was observed with Rossi X-ray Timing Explorer (RXTE) in 2000 and 2002: (1) between Jul 13, 2000 (start time: 04:43:28) and Nov 3, 2000 (end time: 00:17:52; proposal nos.: P50054 and P50138); and (2) between Jul 2, 2002 (start time: 20:38:24) and Jul 22, 2002 (end time: 11:04:00; proposal no.: P70412) for a total observation time of 144 ks. We have produced CD and HID using the entire standard-2 mode data from the top layers of Proportional Counter Unit (PCU) 2. We have defined HC and SC as the ratio of the background-subtracted detector counts in the and keV energy bands, respectively. We have been able to divide the 2000 data in nine temporal segments, i.e., nine phases (see Table 1 for time ranges). Each phase traces a distiguishable portion of the HID track (see Fig. 1). This figure shows that the source starts from a low intensity and a high HC value, and in the hard state (phase 1–4) it traces a few adjacent curved parallel tracks below the intensity counts/s/PCU and in the HC range of . Unlike Aql X–1 and several black-hole sources, the intensity of EXO 1745–248 does not increase much in the highest HC value. Rather, Fig. 1 shows that the HC value decreases substantially and the intensity increases at a lower HC value of in the hard state. During the transition from phase 4 to phase 5, the source goes through a large intensity (in keV) jump from counts/s/PCU to counts/s/PCU while having a relatively small change in the HC value ( to ; see Table 1 and Fig. 1). In the high intensity state (phase 5–7) the source shows a clear anti-clockwise loop (hysteresis; Fig. 1). EXO 1745–248 undergoes a moderate intensity jump from phase 7 to phase 8, and the intensity steadily decreases up to phase 9 while keeping the HC value nearly same (Fig. 1). The lower intensity portion of phase 9 shows a significant increase in HC value. Since the ASM data confirm that the source intensity further decreases into the quiescence, Fig. 1 implies a clear overall clockwise loop (hysteresis) of the source. The Intensity and HC values of phase 10 (2002 data) are consistent with those of phases 8 and 9. The phases 5–10 show a clear banana-like track in the CD (Fig. 2). In the hard state, two phases (1,3), which display substantial changes in HC values, show large variation in SC values.
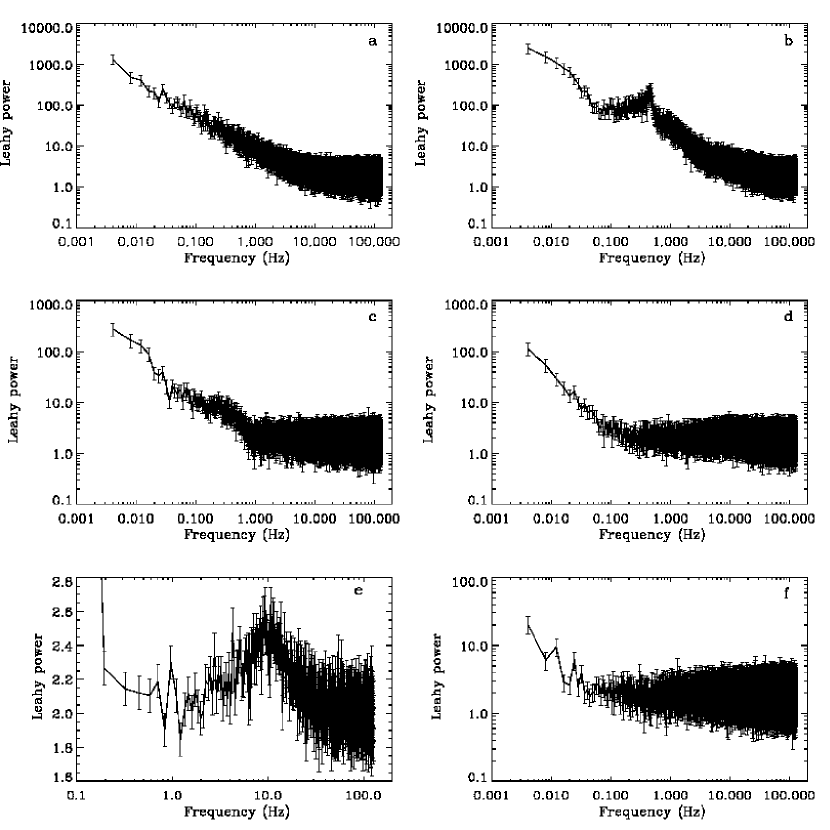
In order to identify the spectral states of EXO 1745–248, we have analyzed the low-frequency power spectra of each phase using all the PCA event-mode data with a standard technique (van der Klis, 1989). Each Leahy-normalized power spectrum has a Nyquist frequency of 128 Hz and the best resolution of 0.004 Hz. We have fitted the continuum component of a power spectrum with a constant+powerlaw model (describing white and red noises, respectively) and any narrow feature with a Lorentzian. The hard state (Phase 1–4) power spectra are typically well described with a constant+powerlaw, having a strong red noise (typical RMS ) below Hz with the Leahy-power reaching at 0.004 Hz (see panel a of Fig. 3; Table 1). Only one power spectrum in hard state shows a significant () low-frequency quasi-periodic oscillation (LFQPO) at Hz with a quality (Q) factor of (see Table 1 and panel b of Fig. 3). A high intensity state (phase 5–7) power spectrum typically shows a very-low-frequency-noise (VLFN) below Hz with an RMS having the Leahy-power reaching a few times 100 at 0.004 Hz. Such a power spectrum also shows a weak broad hump near 0.3 Hz (panel c of Fig. 3; Table 1). A phase 8 power spectrum shows a red noise (RMS ) roughly below 0.1 Hz with the Leahy-power reaching about at 0.004 Hz (panel d of Fig. 3). In most cases, such a power spectrum has a significant peaked noise at Hz (see Table 1 and panel e of Fig. 3). For example, the peaked noise in the data set of Nov 17, 2000 (03:46:10–04:45:07) has a significance of , a centroid-frequency of Hz, an RMS-amplitude of and a Q-factor of . A typical phase 9 power spectrum has a red noise (RMS ) below Hz with the Leahy-power reaching a few times 10 at 0.004 Hz (panel f of Fig. 3).
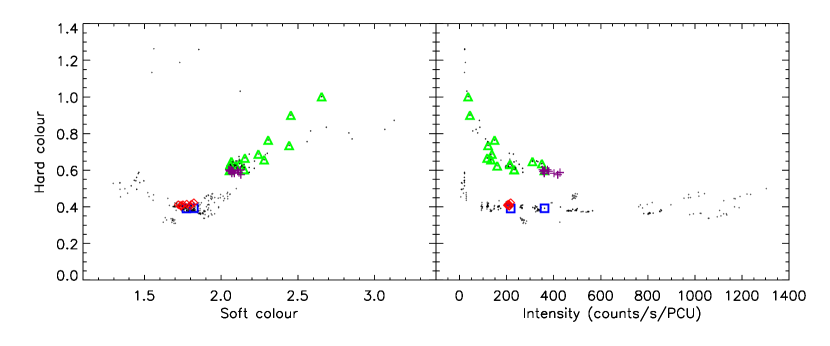
In Fig. 4, we have displayed the locations of the thermonuclear bursts, the LFQPO and the kilohertz (kHz) QPO (Mukherjee and Bhattacharyya, 2011) in the CD and the HID. While the non-photospheric-radius-expansion (non-PRE) bursts occured in the hard state, the PRE bursts and the kHz QPO appeared in phase 8 (Table 1).
3 Discussion and Conclusions
In this Letter, we have studied the evolution of spectral states of the neutron star LMXB EXO 1745–248. We tentatively conclude that it is an atoll source because of the following reasons. (1) From the spectral fitting, we find that the observed keV unabsorbed source flux varied in the range ergs cm-2 s-1. Such a large intensity variation does not happen in a source, which shows an exclusive ‘Z’ behaviour (van der Klis, 2006). (2) The hard colours (Fig. 1) of EXO 1745–248 are consistent with those of atoll sources, but different from Z sources (Muno et al., 2002). (3) The source shows parallel tracks for the higher hard colour values in HID (Fig. 1), which are typical of atoll sources (van der Klis, 2006). (4) Shape of the CD track for lower hard colour values looks like a banana (Fig. 2). (5) Hard state to soft state transition of the source was plausibly quick (van der Klis, 2006). (6) PRE bursts were found in the softer state (Fig. 4), as usually observed for fast spinning neutron star LMXBs (Muno et al., 2004). (7) The kHz QPO was observed in the transitional state (plausibly LB/LLB), which is usual for atolls (Maitra and Bailyn, 2004; van der Klis, 2006). (8) VLFN at HZ was observed in BS, and Hz peaked noise was detected in the transitional state (plausibly LB/LLB), which are usual for atolls (Maitra and Bailyn, 2004; van der Klis, 2006). (9) Red noise RMS is higher in the hard state (van der Klis, 2006). However, although we cannot confirm, there is some chance that at the most intense state, the source transformed into a Z source (e.g., Homan et al. (2010)). This is because, the estimated source luminosity in this state was times the Eddington luminosity (van der Klis, 2006), for a keV flux of ergs cm-2 s-1, and assuming a 5.5 kpc source distance, 1.4 M⊙ neutron star mass, 6.0 stellar radius-to-mass ratio and ionized hydrogenic accreted matter.
EXO 1745–248 is very interesting, unusual and important for the following reasons. (1) The source exhibited a clear overall clockwise hysteresis in HID and CD (Fig. 1 and 2). A local anti-clockwise hysteresis is also observed in the high intensity state (plausibly UB). (2) In the hard state (plausibly EIS), unlike a typical atoll, the hard colour changed largely, and no horizontal track is present at the highest hard colour in HID (van der Klis, 2006). Moreover, the hard-to-soft transition involved a large change in intensity, unlike several black hole sources. These caused an HID-track-shape intermediate between atoll ‘C’ tracks and black hole ‘q’ tracks. (3) In CD/HID, the source moved from EIS to UB, while usually an atoll moves to LB/LLB from EIS (van Straaten et al., 2003; van der Klis, 2006). (4) The CD/HID tracks of EXO 1745–248 could be segmented in time (Fig. 1 and 2). Several segments can be distinguished by timing properties (Fig. 3), which shows that these segments are actually in different states, i.e., not in the same state shifted by secular motions. The source typically dwells in a segment for a few days to about a month (Table 1). (5) EXO 1745–248 took at least 2.5 months to trace the BS, as opposed to a few hours to a day, which is typical for an atoll source (van der Klis, 2006).
The CD/HID hysteresis tracks of EXO 1745–248 could be very useful to relate the accretion processes in neutron star systems and black hole systems (§ 1). Finally, the HID hysteresis track of EXO 1745–248, which is intermediate between the ‘q’-like hysteresis track of Aql X-1 and ‘C’-like non-hysteresis tracks of most atoll sources, suggests that the popular EIS-IS-BS framework of ‘C’-like tracks might be a special case of a more general hysteresis behaviour. However, observations of more such intermediate sources are required to verify this.
References
- Belloni (2009) Belloni T., 2009, (astro-ph/0909.2474v1)
- Belloni et al. (2007) Belloni T., Homan J., Motta S., Ratti E., 2007, MNRAS, 379, 247
- Heinke et al. (2003) Heinke C.O., Edmonds P.D., Grindlay J.E., Lloyd D.A., Cohn H.N., Lugger P.M., 2003, ApJ, 590, 809
- Homan et al. (2010) Homan J., van der Klis M., Fridriksson J.K., et al., 2010, ApJ, 719, 201
- Maitra and Bailyn (2004) Maitra D., Bailyn C.D., 2004, ApJ, 608, 444
- Markwardt and Swank (2000) Markwardt C.B., Swank J.H., 2000, IAUC, 7454, 1
- Mukherjee and Bhattacharyya (2011) Mukherjee A., Bhattacharyya S., 2011, (astro-ph/1101.0358)
- Muno et al. (2004) Muno M.P., Galloway D.K., Chakrabarty D., 2004, ApJ, 608, 930
- Muno et al. (2002) Muno M.P., Remillard R.A., Chakrabarty D., 2002, ApJ, 568, L35
- Reig et al. (2004) Reig P., van Straaten S., van der Klis M., 2004, ApJ, 602, 918
- van der Klis (1989) van der Klis M., 1989, Eds. H. Ögelman and E.P.J. van den Heuvel, (Kluwer Academic Publishers: Boston), 27
- van der Klis (2006) van der Klis M., 2006, in Compact Stellar X-ray Sources, eds. Lewin W.H.G., van der Klis M., Cambridge Univ. Press, 39, 39
- van Straaten et al. (2003) van Straaten S., van der Klis M., Mèndez M., 2003, ApJ, 596, 1155
- Wijnands et al. (2002) Wijnands R., Homan J., Remillard R., 2002, ATel, 101, 1
| Phase | Start time1 | End time2 | Soft-colour3 | Hard-colour4 | Intensity5 | Remarks6 |
|---|---|---|---|---|---|---|
| Phase1 | 13/07/2000 04:43:28 | 13/07/2000 05:13:04 | 2.2418623 | 0.68810917 | 137.27226 | No narrow feature. |
| 21/07/2000 10:23:28 | 21/07/2000 11:44:00 | 2.2798728 | 0.65725367 | 133.26667 | The Leahy-powers start rising | |
| Phase2 | 24/07/2000 15:15:28 | 24/07/2000 16:16:00 | 2.1178232 | 0.66027898 | 213.43736 | significantly above 2 in Hz, |
| 06/08/2000 12:55:28 | 06/08/2000 13:28:00 | 2.0948016 | 0.65078129 | 240.75461 | and reach above 1000 at 0.004 Hz | |
| Phase3 | 06/08/2000 14:00:32 | 06/08/2000 15:10:08 | 2.1486752 | 0.63243319 | 252.97392 | (see Fig. 3-a). |
| 13/08/2000 09:58:24 | 13/08/2000 11:08:00 | 3.1275264 | 0.87214917 | 84.047352 | Non-PRE bursts observed. | |
| Phase4 | 13/08/2000 11:39:28 | 13/08/2000 12:50:08 | 2.0437827 | 0.61713214 | 195.17507 | Similar to the phases . An LFQPO |
| 15/08/2000 17:57:52 | 15/08/2000 19:26:40 | 2.054908 | 0.59863458 | 360.6038 | is detected in one segment (Fig. 3-b). | |
| Phase5 | 18/08/2000 13:08:32 | 18/08/2000 13:41:36 | 1.9404588 | 0.35567838 | 1135.4601 | The Leahy-powers start rising |
| 21/08/2000 19:36:32 | 21/08/2000 19:55:44 | 1.8951522 | 0.35778984 | 977.661 | significantly above 2 below Hz, | |
| Phase6 | 24/08/2000 10:48:48 | 24/08/2000 11:19:44 | 2.0420255 | 0.45687916 | 1191.8152 | and reach above 100 at 0.004 Hz. |
| 27/08/2000 05:51:28 | 27/08/2000 06:28:00 | 1.9212794 | 0.41142752 | 897.9504 | A plausible hump at Hz is | |
| Phase7 | 27/08/2000 06:53:36 | 27/08/2000 08:10:56 | 1.8786671 | 0.36700101 | 806.13514 | typically seen (see Fig. 3-c). |
| 30/08/2000 15:23:28 | 30/08/2000 15:46:40 | 1.9175748 | 0.39400707 | 777.30473 | ||
| Phase8 | 05/09/2000 09:41:20 | 05/09/2000 11:13:04 | 1.809879 | 0.37902471 | 340.92112 | The Leahy-powers start rising |
| 06/10/2000 05:00:32 | 06/10/2000 05:13:36 | 1.75375 | 0.38471589 | 164.56586 | significantly above 2 below Hz, and reach at 0.004 Hz. A peaked noise around 10 Hz is typically seen (see Figs. 3-d and 3-e). PRE bursts and kHz QPO found in this phase. | |
| Phase9 | 09/10/2000 05:13:20 | 09/10/2000 05:50:56 | 1.732144 | 0.4048109 | 120.68564 | The Leahy-powers start rising |
| 03/11/2000 00:02:24 | 03/11/2000 00:17:52 | 1.3439725 | 0.45464597 | 4.9097872 | significantly above 2 below Hz, and reach above 10 at 0.004 Hz (Fig. 3-f). | |
| Phase10 | 02/07/2002 20:38:24 | 02/07/2002 20:47:44 | 1.6929414 | 0.30983275 | 280.54887 | Roughly similar to phase 9. |
| 22/07/2002 08:46:24 | 22/07/2002 11:04:00 | 1.4488735 | 0.56095016 | 20.41566 |
1Start time of the first (upper line) and the last (lower line) continuous time segments of the phase.
2 End time of the first (upper line) and the last (lower line) continuous time segments of the phase.
3Soft-colours (defined in § 2) of the first time bin of the first continuous time segment (upper line), and the last time bin of the last continuous time segment (lower line) of the phase.
4Hard-colours (defined in § 2) of the first time bin of the first continuous time segment (upper line), and the last time bin of the last continuous time segment (lower line) of the phase.
5Intensities (defined in § 2) of the first time bin of the first continuous time segment (upper line), and the last time bin of the last continuous time segment (lower line) of the phase.
6Primarily a short description of a typical power spectrum of the phase (§ 2).
|
|