Structural Properties of High and Low Density Water in a Supercooled Aqueous Solution of Salt
Abstract
We consider and compare the structural properties of bulk TIP4P water and of a sodium chloride aqueous solution in TIP4P water with concentration c = 0.67 mol/kg, in the metastable supercooled region. In a previous paper [D. Corradini, M. Rovere and P. Gallo, J. Chem. Phys. 132, 134508 (2010)] we found in both systems the presence of a liquid-liquid critical point (LLCP). The LLCP is believed to be the end point of the coexistence line between a high density liquid (HDL) and a low density liquid (LDL) phase of water. In the present paper we study the different features of water-water structure in HDL and LDL both in bulk water and in the solution. We find that the ions are able to modify the bulk LDL structure, rendering water-water structure more similar to the bulk HDL case. By the study of the hydration structure in HDL and LDL, a possible mechanism for the modification of the bulk LDL structure in the solution is identified in the substitution of the oxygen by the chloride ion in oxygen coordination shells.
pacs:
61.20.-p,64.60.My,65.20.JkI Introduction
The possible existence of a second critical point of water in the liquid supercooled metastable phase has been the subject of a long debate in the literature. The first hypothesis of its existence originated from the results of a computer simulation on water modeled with the ST2 potential poole92nature . On the basis of those results the thermodynamic anomalies of water upon supercooling were interpreted in terms of the long range fluctuations induced by the presence of a second critical point. This critical point would be a liquid-liquid critical point (LLCP) located at the end of the coexistence line between a low density liquid (LDL) phase and a high density liquid (HDL) phase of water. In the LLCP scenario, these liquid phases would be the counterpart at higher temperature of the well-known low density amorphous (LDA) and high density amorphous (HDA) phases of glassy water. The hypothesis of a LLCP scenario for water motivated a large number of experimental, computational and theoretical investigations pabloreview ; deben03 .
Different interpretations of the origin of the thermodynamic anomalies of water have been also proposed as alternatives to the LLCP scenario. In the singularity free scenario sastry96 the anomalies of water are due to local density fluctuations and no critical phenomena take place. Recently a critical point free scenario angell08 has also been proposed in which the transition between HDL and LDL is seen as an order-disorder transition without a critical point.
A number of computer simulations, performed on supercooled water with different model potentials, confirmed the plausibility of the LLCP scenario poole93 ; poole95 ; harrington97 ; yamada02 ; paschek05 ; paschek08 ; vallauri05 ; tanaka96 ; liu09 ; sciortino97 . There are also indications from experiments of the existence of the LLCP in bulk water mishima98 ; banarjee09 ; mallamace08 ; mishima10 . It would be approximately located at K at MPa.
Because of the difficulties of performing experiments in the region where the LLCP would reside in bulk water, the possibility of observing the LLCP of water in aqueous solutions that can be more easily supercooled miyata02 has been recently explored theoretically chatterjee and in computer simulations corradini10jcp ; corradini10pre . Results compatible with the existence of a LLCP have been also found in aqueous solutions of salts through thermometric experiments archer00 ; archer00pccp ; mishima05 ; mishima07 .
In a recent paper corradini10jcp , by means of a computer simulation study of the phase diagram, we indicated the possible detection in thermometric experiments of the LLCP in a NaCl(aq) solution.
Since the detection of low and high density forms of water can also offer a viable path to the experimental detection of a LLCP, structural properties of supercooled water and aqueous solutions are of extreme interest in this context. The structure of water and of aqueous solutions, can be studied with neutron diffraction using isotopic substitution soper00 ; mancinelli07jpcb or by X-ray scattering neilson01 .
In the present paper we focus on the structural properties of bulk TIP4P water and of the NaCl(aq) solution with mol/kg, in order to analyze and compare the results in HDL and LDL especially close to the LLCP. The paper is organized as follows. In Sec. II the details of the computer simulations are given. In Sec. III we summarize the main results obtained on the thermodynamics of bulk water and NaCl(aq) and we present the potential energy of the systems. The new results for the structural properties of the systems are presented in Sec. IV. This section is divided in two parts: water-water structure is discussed in subsection IV.1, while the hydration structure of ions is addressed in subsection IV.2. Finally, conclusions are given in Sec. V.
II Computer simulation details
Molecular dynamics (MD) computer simulations were performed on bulk water and on NaCl(aq) with concentration mol/kg. The interaction potential between pairs of particles is given by the sum of the electrostatic and the Lennard-Jones (LJ) potentials.
| (1) |
Water molecules were modeled using the TIP4P potential jorgensen83 . The details about this potential are reported in the Appendix. TIP4P potential is known to well describe water properties in its liquid supercooled state jorgensen83 and also to be able to reproduce the very complex ices phase diagram sanz04 .
The LJ interaction parameters for the ions were taken from Jensen and Jorgensen jensen06 and the ion-water interaction parameters were calculated by using geometrical mixing rules and . The ion-ion and ion-water parameters are reported in Table 1. These parameters were optimized for use with TIP4P water and they well reproduce structural characteristics and free energies of hydration of the ions jensen06 .
Although the presence of ions would suggest the use of polarizable potentials, at the moment no joint set of polarizable potentials for water and ions are tested as reliable for very low temperatures.
| Atom pair | ||
|---|---|---|
| Na-Na | 0.002 | 4.070 |
| Na-Cl | 0.079 | 4.045 |
| Cl-Cl | 2.971 | 4.020 |
| Na-O | 0.037 | 3.583 |
| Cl-O | 1.388 | 3.561 |
Periodic boundary conditions were applied. The cutoff radius was set at 9 Å. Standard long-range corrections were applied for the calculation of the potential energy and the virial. The long-range electrostatic interactions were handled with the Ewald summation method. The integration time step was fixed at 1 fs.
The total number of particles contained in the simulation box is . For bulk water while in the case of NaCl(aq) with concentration mol/kg, and . Extensive sets of simulations were run both for bulk water and for NaCl(aq). The range of densities investigated spans from to and the range of temperatures goes from K to K. Temperature was controlled using the Berendsen thermostat berendsen . Equilibration and production simulation times were progressively increased with the decreasing temperature. The total running times span from 0.15 ns for the highest temperatures to 30 ns for the lowest ones. The parallelized version of the DL_POLY package dlpoly was employed to perform the simulations. The total simulation time is circa 6 single CPU years.
III Thermodynamics in the supercooled region
In this section we start by summarizing the main results on the thermodynamic behavior in the supercooled region of bulk water and of NaCl(aq) obtained in Ref. corradini10jcp, and then we analyze the behavior of the potential energy of the systems studied at different temperatures. From extensive simulations on bulk TIP4P water and on NaCl(aq) with concentration mol/kg, we located in both systems the LLCP. Details about the calculation of the position of the LLCP are given in Ref. corradini10jcp, .
In Fig. 1 we report a comparison of the phase diagrams of the supercooled regions of bulk water and NaCl(aq) as obtained directly from MD. Together with the LLCP of the two systems, we show the Widom lines, the temperature of maximum density (TMD) lines and the liquid-gas limit of mechanical stability (LG-LMS) lines. The Widom line can be considered an extension of the coexistence line in the one-phase region franzese07 ; xu05 . In bulk water the position of the LLCP is K and MPa. In a very recent paper abascal10 another estimate of the LLCP for bulk water has been performed with a TIP4P potential with modified parameters abascal05 . The values that the authors obtained for the critical point, K and MPa, and the Widom line appears substantially the same as the values that we found with the original TIP4P corradini10jcp .
Coming back to Fig. 1 we can see that in NaCl(aq) the position of the LLCP moves to lower pressure and higher temperature, appearing at K and MPa. The TMD line of the solution lies circa 10 K below in temperature and at slightly lower pressure with respect to bulk water. The LG-LMS instead is almost unchanged with respect to the bulk. From the comparison of the phase diagrams for these two systems, we found that the main effect of the presence of the ions is to shrink the region of existence of the LDL corradini10jcp , consistent with an observed increased solubility of ions in HDL water mishima07 ; souda .
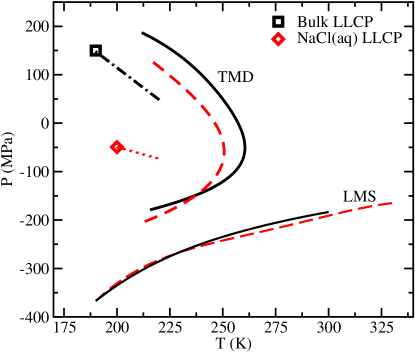
Importantly, we also found that with a rigid shift in temperature and pressure of the phase diagram of TIP4P bulk water (not shown), that brought the TMD curve to coincide with the experimental TMD values, the LLCP in bulk water appears at K and MPa, close to the experimental value estimated by Mishima and Stanley mishima98 K and MPa. We note that this shift in temperature is compatible with the shift between the melting line of TIP4P vega05 and the melting line of real water. Recently Mishima published a new estimate of the LLCP in the bulk at K and MPa mishima10 also compatible with our findings. These results confirm that TIP4P is a good potential for describing the supercooled water phase diagram. The same shift applied to our ionic solution led us to predict a LLCP in NaCl(aq) located at K and MPa. These last values appear to be in a region accessible by experiments, being above the homogeneous nucleation temperature of the solution miyata02 ; kanno75 .
Generally speaking, from the behavior of the potential energy it is also possible to extract information on the thermodynamics of a system close to a phase transition. As already pointed out in Ref. harrington97, and sciortino97, if we examine the curvature of the configurational part of the Helmholtz free energy ,
| (2) |
it must be positive in the region of stability of an homogeneous phase. When the curvature of is negative, the system can still be stable due to the contribution of a dominant entropic term in Eq. (2). At supercooled low temperatures, the stabilization induced by the entropic term can be less effective as the factor in front of the second derivative of the entropy in Eq. 2 becomes progressively smaller. Thus, at low temperatures the range of volumes where , corresponds to a region of reduced stability for the homogeneous liquid, where separation in two distinct phases with different densities may occur.
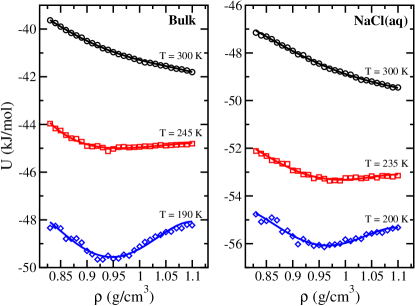
In Fig. 2 the isotherms of the potential energy are reported for three temperatures for bulk water and NaCl(aq). We show the behavior of potential energy for ambient temperature K, for the first temperature showing a negative curvature of , K in the bulk and K in the solution, and for the LLCP temperature, K in the bulk and K in the solution. In both systems, at high temperature the potential energy is a positively curved function of the density and it decreases monotonically (becomes more negative) as density increases. When the temperature is decreased, a minimum is formed after which the curvature of the potential energy becomes negative. The minimum corresponds to the presence of a tetrahedrally ordered liquid with an energetically favorable configuration sciortino97 . For the temperature corresponding to that of the LLCP, we see that in both systems the minimum becomes very deep and a maximum is suggested at high densities, indicating the possible occurrence of a second minimum at higher densities. This second minimum has been previously observed for confined bulk water kumar05 and for higher concentration NaCl(aq) solutions corradini09 and connected to the existence of two distinct liquid phases in the system, as at very low temperatures the entropic contribution is depressed and the behavior of the free energy can be approximated with that of the potential energy . Comparing the behavior of the potential energy of bulk water and NaCl(aq), we can notice that apart from the shift in the absolute value due the presence of ions, their behavior is quite similar. Nonetheless the minimum at low density becomes more shallow in the solution, indicating that this phase is made less stable by the presence of ions, consistent with the fact that ions stabilize the high density phase corradini10jcp .
IV Structural results
As discussed in the previous section, the study of the phase diagram of bulk water and of the aqueous solution shows the presence of a LLCP in the supercooled region. We now discuss the structural properties of the systems. In the following subsection, we analyze water-water structure both in the bulk and in the solution. Then we study the hydration (ion-water) structure.
IV.1 Water-water structure
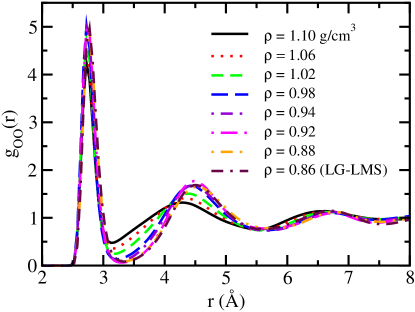
In Fig. 3 we report the O-O radial distribution functions (RDFs) of bulk water at the LLCP temperature for decreasing densities from to the LG-LMS density . According to our phase diagram, the LLCP in bulk water is located at . As a general trend, there is an increase of the first peak with decreasing density. We note that the second peak from to does not substantially change position. As the LLCP is approached, from it starts to shift to lower distances.
The LLCP is located at in NaCl(aq); thus in order to study the structural differences between the LDL and the HDL both in bulk water and in NaCl(aq), we will take into account, in the following discussion, the RDFs at two density values which are well above and well below the estimated critical densities, namely for HDL and for LDL.
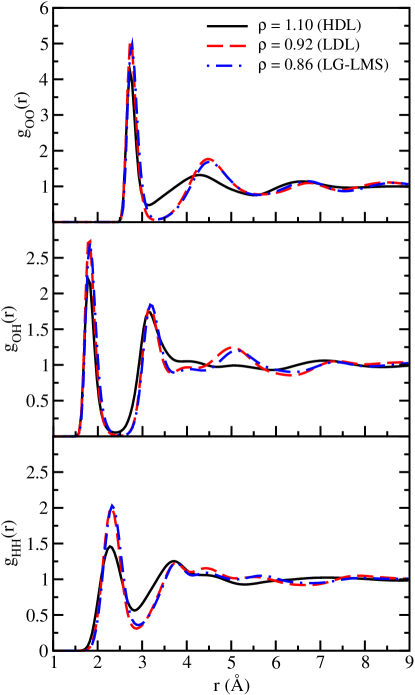
In Fig. 4 we compare the water-water RDFs , and of bulk water obtained at the thermodynamic conditions in which water is either in the LDL or in the HDL region. The RDFs are plotted for K at densities and representative of LDL and HDL respectively. The RDFs at the density that represents, at this temperature, the LG-LMS of bulk water are also reported for comparison. We observe for the O-O RDF that the height of the first peak decreases going from LDL to HDL while its position does not change. The second peak instead is markedly different. In HDL its position shifts to lower distances, its height decreases and its shape broadens, with respect to the LDL. For the the height of the first peak decreases in HDL and it moves to slightly lower distances. This slight shift is conserved between the first and the second shell, while the position and the height of the second shell are fairly similar for HDL and LDL, apart from the appearance of a shoulder between the second and the third shell in HDL. It can be also noted that while the LDL shows a very well-defined third shell, it disappears in HDL. For the (r) also the first peak of the HDL is less intense than the one of LDL and slightly shifted to lower distances. It can also be noted a widening of the second shell in the HDL. The overall trend of water-water RDFs and in particular the difference in the second shell of the O-O RDF clearly shows the disruption of hydrogen bonds between the first and second shell of water molecules that occurs in HDL, causing it to have a collapsed second shell with respect to the tetrahedrally coordinated LDL soper00 .
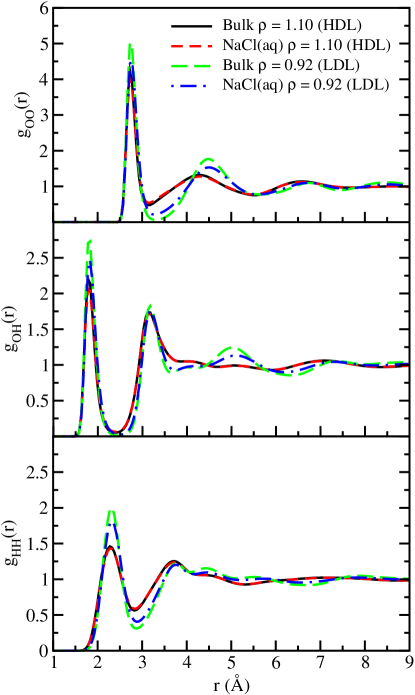
The results for HDL and LDL RDFs in bulk water are in good agreement with those found in experiments soper00 . It has been shown that the TIP4P model is a very reliable model for the study of the thermodynamics of solid sanz04 and supercooled liquid water corradini10jcp . Our results confirm the validity of the TIP4P model also for the study of the structural properties in the supercooled region.
In Fig. 5 we compare the HDL and LDL water-water RDFs for bulk water and for NaCl(aq). In NaCl(aq) the overall shape and positions of the peaks remain similar to those of bulk water in both cases, but some differences can be noted for the LDL. The height of the first peak of , and is slightly lower for the NaCl(aq) LDL with respect to the correspondent phase in bulk water. Furthermore in the the first minimum moves to lower distances in the solution and the height of the second peak is reduced. In the the first and the second shell remain similar but the height of the third shell is damped in the NaCl(aq). These results indicate that at this concentration the effect of ions on water-water structure is not strong and all the features found in bulk water are preserved. Nonetheless, LDL seems to be more affected by the presence of ions than HDL. This can be due to a certain degree of disruption of hydrogen bonds induced by the ions. In fact, as shown in Fig. 5 we see that the effect of ions is that of reducing the LDL character of water-water structure and making it more similar to the one of the HDL. These results are in agreement with that observed in our study the thermodynamics of these systems corradini10jcp . In fact, it was found that the range of existence of the LDL phase is reduced when ions are added to bulk water.
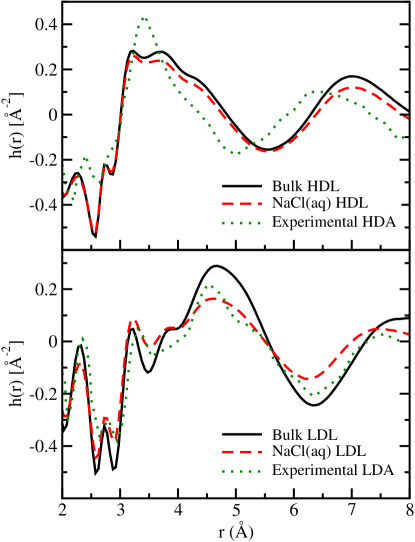
To complete the comparison between HDL and LDL in bulk water and in NaCl(aq) we report in Fig. 6 the quantity
| (3) |
This correlation function has been obtained in neutron diffraction experiments on the amorphous HDA and LDA phases of water bellissent92 ; bellissent89 . The qualitative agreement shows the existing relation between the LDA/HDA phases of ice with the corresponding LDL/HDL phases of water as already pointed out in simulations of bulk water with the ST2 potential sciortino97 . We observe again that LDL is more influenced by the presence of ions. The modifications to in fact appear larger in LDL with a significant reduction of the peak at about 4.6 Å and the different behavior for long distances, Å. This confirms the behavior that we observed for LDL, looking at the partial water-water RDFs.
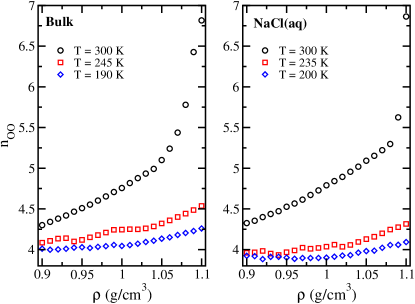
To conclude the analysis of water-water structure we report in Fig. 7 the oxygen-oxygen first shell coordination numbers as a function of density, at constant temperature. We report them at the same temperatures that we show in Fig. 2 for the potential energy, K, K and K for bulk water and K, K and K for NaCl(aq). The first shell coordination numbers can be calculated integrating the radial distribution function until the first minimum is reached, and thus they represent the average number of first neighbors around an oxygen atom. At high temperatures the coordination numbers decrease monotonically with the density, without reaching the value of 4 typical of LDL sciortino97 in the spanned range of simulated state points. As temperature is decreased, the isotherms of the coordination numbers approach an asymptotic value of 4 when density decreases. For the lowest temperature, the coordination number reaches the value 4 already at quite high densities in bulk water and it actually drops slightly below 4 in NaCl(aq). In the case of the first shell coordination numbers, HDL and LDL seem to be affected in a similar way by the presence of ions, with a slight decrease of the average number of first neighbors. Nonetheless, the weakening of the ordered tetrahedral configuration of LDL in the first shell induced by the ions may allow for a reorganization of the bonds that leads to a more packed, HDL-like structure, as we have seen looking at the RDFs.
IV.2 Hydration structure
The hydration structure in NaCl(aq) at ambient temperature and in the moderately supercooled region has been the subject of several experimental mancinelli07jpcb ; mancinelli07pccp ; ohtaki01 and computer simulation works corradini08 ; koneshan00 ; chowdhuri01-03 ; patra04 ; lenart07 ; alejandre07 ; lynden01 ; zhu92 ; kim08 ; du07 ; joung08 . Nonetheless, the hydration behavior close to the LLCP has never been studied previously.
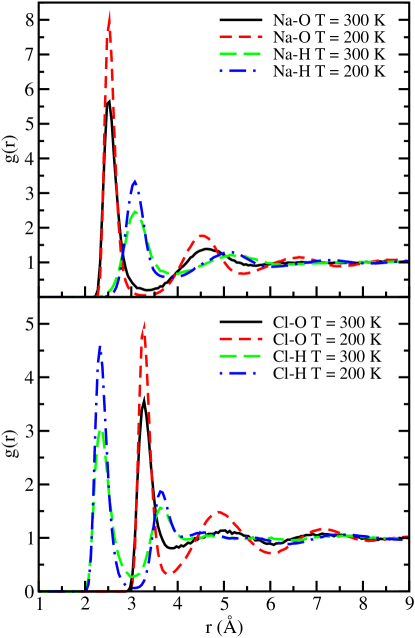
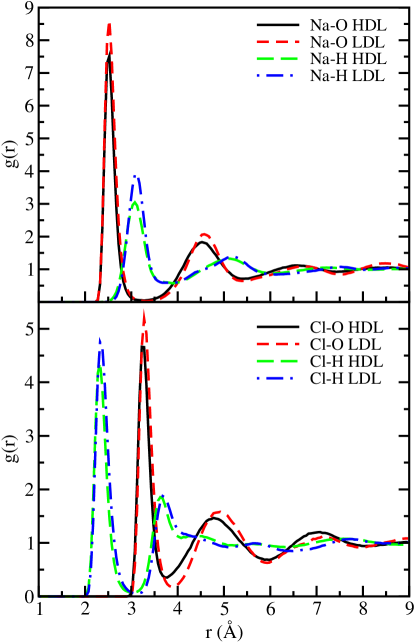
In order to study the general features of the hydration shells we show in Fig. 8 the Na-water and Cl-water RDFs for at ambient temperature K and in the deep supercooled region, at K, corresponding to the LLCP temperature in the solution. For all the four couples we can observe that there are two well-defined hydration shells. The height of both the first and second peak tends to increase greatly upon supercooling. In the case of Na-O and Cl-O we observe also for the second peak also a shift of its position to slightly lower distances at the lowest temperature. These results seem to indicate that upon supercooling the hydration shells tend to stabilize and to become more compact. In the case of the chloride ion, the Cl-O first and second peaks are very well separated from the respective Cl-H peaks, by roughly 1 Å. In the case of the sodium ion the distance is reduced to roughly 0.6 Å and there is actually an overlap of the Na-O and Na-H hydration shells. For the chloride ion the hydration structure of the shells is similar to the case of O-O and O-H structure (see Fig. 4 and Fig. 5). Thus, we argue that chloride can substitute oxygen in the hydration shells forming linear hydrogen bonds with oxygen atoms as indicated by the sharp, first Cl-H peak. The Na+ ion cannot simply substitute the oxygen atom. Its positive charge induces a major rearrangement of the hydration shells that results in more packed structure. The behavior of the hydration shells of Na+ and Cl- ions is in good agreement with those found experimentally for ambient temperature in recent neutron diffraction experiments mancinelli07jpcb ; mancinelli07pccp .
In Fig. 9 we report the Na-water and Cl-water RDFs for the HDL, at and the LDL at and at K. We can see that the hydration shells of sodium ions are not much affected by the HDL or LDL environment of the solvent. An increase of the first and second peak of the Na-O RDF and of the first peak of the Na-H RDF is observed in LDL with respect to HDL but the position of the peaks remains unaltered apart from a very slight shift to higher distances of the second shell of Na-O for the LDL. In the case of the chloride ion, the Cl-H RDF remains unchanged in HDL or LDL but the Cl-O RDF show some differences. In the LDL the first peak is higher than in HDL and the second peak is both higher and shifted to longer distances. We report in Table 2 the first shell and second shell hydration numbers for the sodium and chloride ions at the LLCP temperature. These numbers have been calculated by numerical integration of the first and second peak of the RDFs plotted in Fig. 9. The integration range spans form zero to the first minimum for the first hydration shell and from the first to the second minimum for the second hydration shell. The modifications of the first shell in going from HDL to LDL are practically imperceptible. The second shell appears already sensitive to the HDL and LDL environment as we can deduce from the decrease of hydration numbers in going from HDL to LDL.
| Atom pair | HDL | LDL | HDL | LDL |
|---|---|---|---|---|
| Na-O | 5.975 | 5.957 | 18.490 | 15.898 |
| Na-H | 15.912 | 15.364 | 49.474 | 43.521 |
| Cl-O | 7.214 | 7.032 | 23.193 | 19.378 |
| Cl-H | 6.983 | 7.002 | 33.177 | 27.069 |
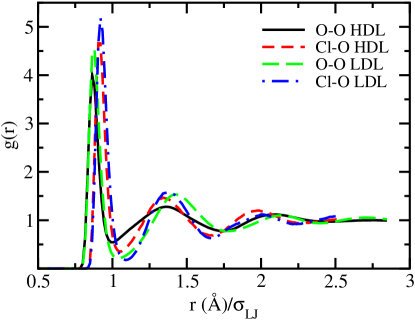
As shown in Fig. 5 and Fig. 6, the ions seem to affect the LDL more than the HDL. The most significant difference in the hydration shells of the ions is noticed in the second shell of the Cl-O RDF. We have also already mentioned that the hydration structure around the chloride ion resembles the O-O and O-H structures (Fig. 8) with the chloride ion able to substitute oxygen in shells of other oxygen atoms. To further inquire this possibility and to assess the effect of the chloride ion hydration on HDL/LDL we plot together in Fig. 10 the O-O and Cl-O RDFs for HDL and LDL with distances rescaled by the respective LJ interaction distance parameter . For the O-O pair Å as given in the TIP4P model jorgensen83 , for the Cl-O pair Å as reported in Table 1.
In both LDL and HDL the first and the second shell of oxygen atoms are closer in the case of the Cl-O RDF (see also Fig. 5 and Fig. 9). To make a quantitative comparison we can look at the distance between the first peak and the second peak of the RDFs . In HDL, for the O-O pair , for the Cl-O . In LDL, for the O-O pair and for Cl-O (distances in real units are obtained multiplying by the respective ). Thus we see that in LDL the chloride ion has the major effect in pulling inward its second hydration shell of oxygens. As shown in Fig. 4 and Fig. 5 the main difference in the structure of the HDL and LDL is in the position of the second shell of the O-O RDFs, therefore, a possible explanation for why the presence of ions affect the LDL more than the HDL. In fact the chloride ion can take the place of the central oxygen atom in oxygen shells and can be accommodated in water-water structure at the price of bending hydrogen bonds and pulling the second shell of oxygen closer to the first shell. This can be tolerated in HDL where the molecular structure is already collapsed in the second shell soper00 but the LDL structure results instead disrupted. In essence, the substitution of oxygen atoms by chloride atoms together with the hydrogen bond disruption caused by Na+ forces the LDL structure to become more HDL-like. Hence, we can understand also from a structural point of view why the region of existence of the LDL phase shrinks in the NaCl(aq) with respect to bulk water.
V Conclusions
By the use of MD computer simulations, we have studied the structural properties of TIP4P bulk water and of a sodium chloride solution in TIP4P water with concentration mol/kg. In particular, we were interested in the structural differences between the two phases of water, HDL and LDL, that appear in the deep supercooled region. From our previous work corradini10jcp we knew accurately the phase diagrams of these systems and in particular the position of the LLCP.
Our results showed that the TIP4P model can reproduce well the structural properties of the two phases of supercooled liquid water in addition to being a very good potential for the study of liquid corradini10jcp and solid sanz04 water thermodynamics. Comparing water-water RDFs in bulk water and in NaCl(aq) we have seen that the LDL is affected by the presence of ions more than the HDL, as indicated also by the shrinkage of the LDL phase observed in the study of the thermodynamics.
The study of the hydration structure of ions in HDL and LDL revealed that a disturbance to the LDL structure is induced by the substitution of oxygen by chloride ions in coordination shells of other oxygen atoms. The chloride ions in fact pull inward its second shell of oxygen atoms, disrupting the LDL structure. This, together with the hydrogen bond breaking caused by the sodium ion, causes the LDL phase to be less stable in NaCl(aq) solutions and its region of existence in the thermodynamic plane to reduce, with a consequent shift of the liquid-liquid coexistence line and of the LLCP to lower pressures with respect to bulk water.
Since from our thermodynamic results we hypothesize that the LLCP region is above the nucleation line in this solution, an observation of the structural features presented in this paper in X-ray and neutron scattering experiments, can also represent a viable route for experimentalists to solve the quest of the LLCP in bulk water. Along this line experimental indications of a HDL and LDL phase coexistence and LLCP have been recently found huang10 .
Acknowledgments
We gratefully acknowledge the computational resources offered by CINECA for the “Progetto Calcolo 891”, by the INFN RM3-GRID at Roma Tre University and by the Democritos National Simulation Center at SISSA (Trieste, Italy).
Appendix
The TIP4P model for water is a nonpolarizable potential where three sites are arranged according to the molecular geometry. The two sites representing the hydrogens are positively charged with ; each one forms a rigid bond with the site of the oxygen at distance Å. The angle between the bonds is . The site of the oxygen is neutral while a fourth site carries the negative charge of the oxygen . This site is located in the same plane of the molecule at a distance Å from the oxygen with an angle from the bond. The intermolecular interactions are represented by Eq. 1. The LJ parameters are given by Å and kJ/mol.
References
- (1) P. H. Poole, F. Sciortino, U. Essmann and H. E. Stanley, Nature 360, 324 (1992).
- (2) P. G. Debenedetti, J. Phys.: Condens. Matter 15, R1669 (2003) and references therein.
- (3) P. G. Debenedetti and H. E. Stanley, Phys. Today 56, 40 (2003).
- (4) S. Sastry, P. G. Debenedetti, F. Sciortino and H. E. Stanley, Phys. Rev. E 53, 6144 (1996).
- (5) C. A. Angell, Science 319, 582 (2008).
- (6) P. H. Poole, F. Sciortino, U. Essmann and H. E. Stanley, Phys. Rev. E 48, 3799 (1993).
- (7) P. H. Poole, I. Saika-Voivod and F. Sciortino J. Phys. Condens. Matter 17, L431 (2005).
- (8) S. Harrington, P. H. Poole, F. Sciortino and H. E. Stanley, J. Chem. Phys. 107, 7443 (1997).
- (9) M. Yamada, S. Mossa, H. E. Stanley and F. Sciortino, Phys. Rev. Lett. 88, 195701 (2002).
- (10) D. Paschek, Phys. Rev. Lett. 94, 217802 (2005).
- (11) D. Paschek, A. Rüppert and A. Geiger, Chem. Phys. Chem. 9 2737, (2008).
- (12) P. Jedlovszky and R. Vallauri, J. Chem. Phys. 122, 081101 (2005).
- (13) H. Tanaka, J. Chem. Phys. 105, 5099 (1996).
- (14) Y. Liu, A. Z. Panagiotopoulos and P. G. Debenedetti J. Chem. Phys. 131, 104508 (2009).
- (15) F. Sciortino, P. H. Poole, U. Essmann and H. E. Stanley, Phys. Rev. E 55, 727 (1997).
- (16) O. Mishima and H. E. Stanley, Nature 392, 164 (1998); ibid. 396, 329 (1998).
- (17) D. Banarjee, S. N. Bhat, S. V. Bhat and D. Leporini, Proc. Natl. Acad. Sci. USA 106, 11448 (2009).
- (18) F. Mallamace, C. Corsaro, M. Broccio, C. Branca, N. Gonzalez-Segredo, J. Spooren, S.-H. Chen and H. E. Stanley, Proc. Natl. Acad. Sci. USA 105, 12725 (2008).
- (19) O. Mishima J. Chem. Phys. 133, 144503 (2010).
- (20) K. Miyata, H. Kanno, T. Niino and K. Tomizawa, Chem. Phys. Lett. 354, 51 (2002).
- (21) S. Chatterjee and P. G. Debenedetti, J. Chem. Phys. 124, 154503 (2006).
- (22) D. Corradini, M. Rovere and P. Gallo, J. Chem. Phys. 132, 134508 (2010).
- (23) D. Corradini, S. V. Buldyrev, P. Gallo and H. E. Stanley, Phys. Rev. E 81, 061504 (2010).
- (24) D. G. Archer and R. W. Carter, J. Phys. Chem. B 104, 8563 (2000).
- (25) R. W. Carter and D. G. Archer Phys. Chem. Chem. Phys. 2, 5138 (2000).
- (26) O. Mishima, J. Chem. Phys. 123, 154506 (2005).
- (27) O. Mishima, J. Chem. Phys. 126, 244507 (2007).
- (28) A. K. Soper and M. A. Ricci, Phys. Rev. Lett. 84, 2881 (2000).
- (29) R. Mancinelli, A. Botti, F. Bruni and M. A. Ricci and A. K. Soper, J. Phys. Chem. B 111, 13570 (2007).
- (30) G. W. Neilson, P. E. Mason, S. Ramos and D. Sullivan, Phil. Trans. R. Soc. Lond. A 359, 1575 (2001).
- (31) W. L. Jorgensen, J. Chandrasekhar, J. D. Madura, R. W. Impey and M. L. Klein, J. Chem. Phys. 79, 926 (1983).
- (32) E. Sanz, C. Vega, J. L. F. Abascal and L. G. MacDowell, Phys. Rev. Lett. 92, 255701 (2004).
- (33) K. P. Jensen and W. L. Jorgensen, J. Chem. Theory Comput. 2, 1499 (2006)
- (34) H. J. C. Berendsen, J. P. M. Postma, W. F. van Gunsteren, A. DiNola and J. R. Haak, J. Chem. Phys. 81, 3684 (1984).
- (35) W. Smith, T. R. Forester and I. T. Todorov, The DL_ POLY_ 2.0 User Manual (Daresbury Laboratory, Daresbury, UK, 2006)
- (36) G. Franzese and H. E. Stanley, J. Phys. Condens. Matter 19, 205126 (2007).
- (37) L. Xu, P. Kumar, S. V. Buldyrev, S.-H. Chen, P. H. Poole, F. Sciortino and H. E. Stanley, Proc. Natl. Acad. Sci. USA 102, 16558 (2005).
- (38) J. L. F. Abascal and C. Vega, J. Chem. Phys. 133, 234502 (2010).
- (39) J. L. F. Abascal and C. Vega, J. Chem. Phys. 123, 234505 (2005).
- (40) R. Souda, J. Chem. Phys. 125, 181103 (2006).
- (41) C. Vega, E. Sanz and J. L. F. Abascal J. Chem. Phys. 122, 114507 (2005).
- (42) H. Kanno, R. J. Speedy and C. A. Angell, Science 189, 880 (1975).
- (43) P. Kumar, S. V. Buldyrev, F. W. Starr, N Giovambattista and H. E. Stanley, Phys. Rev. E. 72, 051503 (2005).
- (44) D. Corradini, P. Gallo, and M. Rovere, J. Chem. Phys. 130, 154511 (2009).
- (45) M. C. Bellissent-Funel, L. Bosio, A. Hallbrucker, E. Mayer and R. Sridi-Dorbez, J. Chem. Phys. 97, 1282 (1992).
- (46) M. C. Bellissent-Funel, J. Texeira, L. Bosio and J. C. Dore, J. Phys.: Condens. Matter 1, 7123 (1989).
- (47) R. Mancinelli, A. Botti, F. Bruni, M. A. Ricci and A. K. Soper, Phys. Chem. Chem. Phys. 9, 2959 (2007).
- (48) H. Ohtaki, Monatshefte für Chemie 132, 1237 (2001).
- (49) D. Corradini, P. Gallo, and M. Rovere, J. Chem. Phys. 128, 244508 (2008).
- (50) S. Koneshan and J. C. Rasaiah, J. Chem. Phys. 113, 8125 (2000).
- (51) S. Chowdhuri and A. Chandra, J. Chem. Phys. 115, 3732 (2001); ibid. 118, 9719 (2003).
- (52) M. Patra and M. Karttunen, J. Comput. Chem. 25, 678 (2004).
- (53) P. J. Lenart, A. Jusufi and A. Z. Panagiotopoulos, J. Chem. Phys. 126, 044509 (2007).
- (54) J. Alejandre and J.-P. Hansen, Phys. Rev. E 76, 061505 (2007).
- (55) R. M. Lynden-Bell, J. C. Rasaiah and J. P. Noworyta, Pure Appl. Chem. 73, 1721 (2001).
- (56) S.-B. Zhu and G. W. Robinson, J. Chem. Phys. 97, 4336 (1992).
- (57) J. S. Kim and A. Yethiraj, J. Phys. Chem. B 112, 1729 (2008).
- (58) H. Du, J. C. Rasaiah and J. D. Miller, J. Phys. Chem. B 111, 209 (2007).
- (59) I. S. Joung and T. E. Cheatham III, J. Phys. Chem. B 112, 9020 (2008).
- (60) C. Huang, T. M. Weiss, D. Nordlund, K. T. Wikfeldt, L. G. M. Pettersson, A. Nilsson, J. Chem. Phys. 133, 134504 (2010).