Computational modeling of differences in the quorum sensing induced luminescence phenotypes of Vibrio harveyi and Vibrio cholerae
Abstract
Vibrio harveyi and Vibrio cholerae have quorum sensing pathways with similar design and highly homologous components including multiple small RNAs (sRNAs). However, the associated luminescence phenotypes of strains with sRNA deletions differ dramatically: in V. harveyi, the sRNAs act additively; however, in V. cholerae, the sRNAs act redundantly. Furthermore, there are striking differences in the luminescence phenotypes for different pathway mutants in V. harveyi and V. cholerae. However these differences have not been connected with the observed differences for the sRNA deletion strains in these bacteria. In this work, we present a model for quorum sensing induced luminescence phenotypes focusing on the interactions of multiple sRNAs with target mRNA. Within our model, we find that one key parameter – the fold-change in protein concentration necessary for luminescence activation – can control whether the sRNAs appear to act additively or redundantly. For specific parameter choices, we find that differences in this key parameter can also explain hitherto unconnected luminescence phenotypes differences for various pathway mutants in V. harveyi and V. cholerae. The model can thus provide a unifying explanation for observed differences in luminescence phenotypes and can also be used to make testable predictions for future experiments.
keywords:
Vibrio harveyi , Vibrio cholerae , quorum sensing , sRNA , luminescence1 Introduction
Bacterial survival is critically dependent on regulatory networks which monitor and respond to environmental fluctuations. An important example of such a regulatory network is the pathway responsible for bacterial “quorum sensing”, commonly defined as the regulation of gene expression in response to cell density [6]. Quorum sensing bacteria produce, secrete and detect signalling molecules called autoinducers (AIs) which accumulate in the surroundings as the cell population increases. Differential expression of certain sets of genes occurs when the local concentration of AIs exceeds a critical threshold. Several processes critical to bacterial colonization and virulence e.g. biofilm formation, bioluminescence, and secretion of virulence factors [5, 18, 20, 7, 8, 32] were shown to be regulated in this manner, leading to increased interest in characterizing quorum sensing based regulation in bacteria.
The quorum sensing networks in Vibrio harveyi and Vibrio cholerae were recently analyzed in considerable detail [26]. The basic network components are highly homologous in the two species, to the extent that the bioluminescence genes from V. harveyi111The corresponding bioluminescence genes are absent in V. cholerae. were used to characterize the regulatory network in V. cholera using luminescence assays [21, 14, 13]. In both species, the central regulatory module consists of multiple quorum regulatory small RNAs (qrr1-4 in V. cholerae and qrr1-5 in V. harveyi) which control levels of the master regulator for quorum sensing: LuxR in V. harveyi and HapR in V. cholerae. LuxR/HapR levels are maintained below the threshold for luminescence activation at low cell densities due to repression by the small RNAs (sRNAs), whereas at high cell densities quorum sensing leads to a reduction in sRNA production rates, thereby increasing LuxR/HapR levels above the threshold leading to luminescence activation. By observing luminescence levels as a function of cell density for different mutants (corresponding to different deletions in the quorum sensing pathway components), several characteristics of pathway structure and function were inferred.
The above studies documented striking differences in luminescence phenotypes in the two species even though the regulatory components of the pathways are very similar. The most dramatic differences were seen in the luminescence phenotypes of the qrr sRNA mutants. In V. cholerae, the four qrr sRNAs acted redundantly [14] – all mutants with only one sRNA present had luminescence phenotypes that were identical to the WT luminescence phenotype. In contrast, the corresponding sRNAs in V. harveyi acted additively such that different mutants with only one sRNA present had distinct luminescence phenotypes compared to the WT phenotype. Thus in V. harveyi all the sRNAs must be present in order to mimic the wild-type luminescence phenotype [30]. Apart from these differences in the luminescence phenotypes of the sRNA mutants, there were also significant differences in the luminescence phenotypes of strains corresponding to deletions of upstream pathway elements in the two species. An important challenge for computational analysis of quorum sensing pathways is to present a unifying explanation for the various, apparently unrelated, differences in the luminescence phenotypes for the two species despite the fact that the pathway elements are very similar (see figure 1).
|
|
Previous work on modeling quorum sensing globally has developed a framework for measuring a bacterium’s ability to sense its microenvironment [27]. By modeling the relative concentration of autoinducers inside and outside the cell, quorum sensing bacteria can be characterized based on a ‘sensing potential’ and its relation to the associated activation properties, e.g. the critical population density [27]. Modeling has also been done at the genetic interaction level, in particular the interaction of sRNAs with target mRNAs. The solutions for the corresponding rate equations (for a range of parameter values) contained a sharp transition from a steady state wherein the target mRNA was strongly repressed to one in which the sRNA was strongly repressed [14, 16, 15, 19, 22, 23]. Since the WT luminescence phenotype also showed a sharp transition as cell density increased, it was initially suggested that this transition corresponded to the sharp transition seen in the sRNA-target rate equations. However, recent experimental results provide indications that this is not necessarily valid and correspondingly the picture needs to be revised.
Experiments in V. cholerae showed that the expression levels of the virulence regulator AphA [11] to be about three-fold lower in WT at low cell densities compared to a mutant. This indicates that WT V. cholerae maintains HapR at low but significant levels at low cell densities (such that it can effectively repress AphA to the extent noted) rather than fully repressing it. Furthermore, experiments in V. harveyi examining regulation of additional targets by LuxR indicated that LuxR levels change in a graded manner as opposed to a sharp, ultrasensitive switch [33]. Thus, there is a need for computational analysis of sRNA-target regulatory interactions in the context of the quorum sensing pathway, which is consistent with these experimental results and which also provides a unifying explanation for observed luminescence phenotypes.
In what follows, we will present a simplified model for luminescence regulation during quorum sensing in V. harveyi and V. cholerae, which is an extension of work previously done by the authors of this paper [2]. For a given choice of parameters, the model accounts for the dramatic differences in the luminescence phenotypes for the sRNA mutants in the two species based on a single parameter difference. The analysis also provides a unifying explanation for currently unrelated differences between the luminescence phenotypes of different mutants in the quorum sensing pathways and gives rise to testable predictions for future experiments. This work thus provides a framework for systems-level analysis of the quorum sensing pathway in the V. harveyi and V. cholerae while complementing previous models of V. fischeri [25, 12, 24] and suggests future experiments that can help in further unraveling the function of this critical regulatory pathway.
1.1 Overview of experimental results
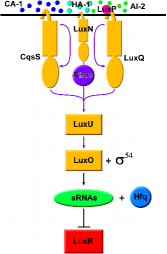
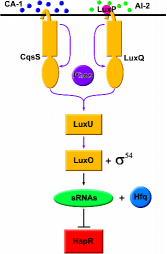
We begin with an overview of the two pathways and associated luminescence phenotypes in the two species. A schematic representation of the two pathways is shown in figure 1. The core elements are the same in both species: a multi-component phosphorelay involving sensor proteins (which can function as kinases as well as phosphatases), the phosphotransfer protein LuxU, and the response regulator protein LuxO. Phosphorylated LuxO is responsible for the activation of multiple qrr sRNAs which in turn repress the quorum sensing master regulator (LuxR in V. harveyi and HapR in V. cholerae).
The pathways do exhibit some differences in the number of autoinducer synthase/sensor protein pairs and in the number of sRNAs present. V. harveyi has three known autoinducer synthase/sensor protein pairs whereas V. cholerae has only two known autoinducer synthase/sensor protein pairs. Furthermore, V. harveyi has five qrr sRNAs as opposed to four in V. cholerae [26]. However, our current understanding indicates that these differences are not significant under the conditions tested. For example, it was shown that qrr5 in V. harveyi is not quorum sensing regulated or expressed under normal conditions [30] and one of the autoinducer synthase/sensor protein pairs in V. harveyi has minimal effects on quorum sensing based regulation [9]. Thus, both pathways can effectively be considered as having two autoinducer synthase/sensor protein pairs and four qrr sRNAs. Furthermore, the pathway components are highly homologous, e.g. LuxR is greater than 90% identical to HapR. However, despite these common features and similarities between components, the luminescence phenotypes show dramatic differences as detailed below.
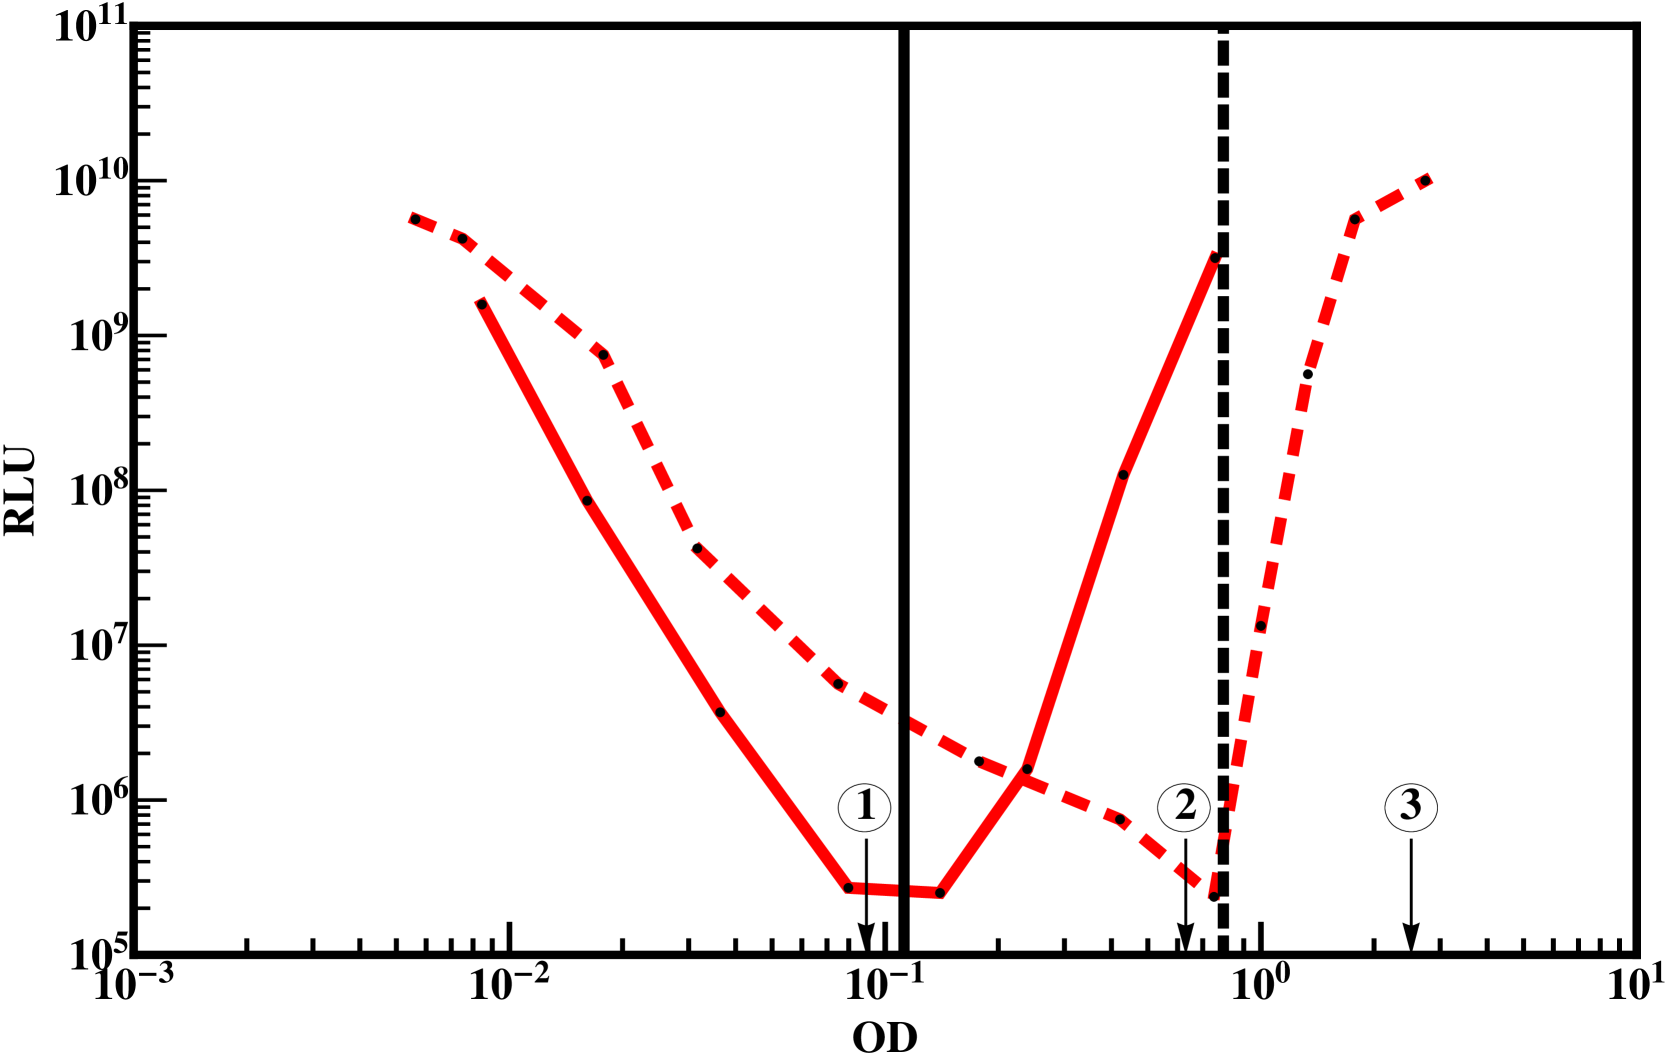
While the most dramatic differences in luminescence phenotypes occur in the qrr and luxU mutants, distinct qualitative differences exist even in the WT phenotypes, see figure 2. These qualitative differences serve as motivation for our modeling and help in discerning a key difference between the two genetic networks that can potentially explain the various differences in luminescence phenotypes. The luminescence curves for WT strains of V. harveyi and V. cholerae (based on experimental data from [30] and [14]) are shown in figure 2. In both cases, the luminescence per cell begin at a high value since the initial state corresponded to a dilution of the high cell density culture which was maximally bright. As the colony density increases, the luminescence level drops until a critical cell density is reached, after this critical point there is a subsequent rise in luminescence back to the initial level. While the luminescence curves of WT V. harveyi and V. cholerae look similar, there are important differences between the two curves. Wild-type V. harveyi showed an almost symmetric parabola centered around OD 0.1 [30]; however, wild-type V. cholerae showed a continued decline in relative light unit (RLU) output until the colony reached an OD600 1.0. The luminescence levels then increased by several orders of magnitude over a timescale during which cell density changed by a small factor ( fold) [14].
The luminescence phenotypes of strains corresponding to deletions of various pathway elements also depicted important differences between the two species. As mentioned in the Introduction, luminescence curves of qrr sRNA mutants in the two species suggested that the sRNAs functioned additively in V. harveyi [30] but were redundant in V. cholerae [14]. Another striking difference was seen in the luxU mutant which was always bright regardless of cell density in V. harveyi whereas the luxU mutant showed a density-dependent luminescence phenotype in V. cholerae. Furthermore, while deletion of the sensor kinases (e.g. for the cqsS,luxQ mutant) changed the luminescence phenotype with respect to WT for V. harveyi, the corresponding WT and deletion mutant luminescence curves were almost identical for V. cholerae [13]. These observations based on experimental luminescence curves lead to some important questions which need to be addressed:
1) How can we understand changes in RLU (Relative Light Unit)/cell over several orders of magnitude corresponding to small changes in cell density? 2) How are the phenotypes dramatically different despite the basic components/circuitry being the same? 3) Is there a unifying explanation for the seemingly unrelated differences in luminescence phenotypes for different mutant strains?
2 Methods
2.1 Modeling framework
In order to address the issues raised above, we will first discuss the modeling framework and key assumptions of our model. They are schematically illustrated in this section and more quantitatively developed in following sections.
We assume that the measured luminescence levels per cell are proportional to the rate of transcription of the luminescence genes. Since these genes are activated by the quorum sensing master regulators, their transcription rate is a function of cellular concentrations of LuxR/HapR. We assume that this function has a sharp threshold; as a simplification we represent it by a step function such that cells with LuxR/HapR concentrations below the threshold produce no light whereas cells with LuxR/HapR concentrations above the threshold produce maximal luminescence.
Since the experimentally measured quantity is the population average of the luminescence output/cell, we need to consider the steady state distribution of LuxR/HapR levels across all cells. Recent work showed that the steady state protein distribution for proteins can be characterized as a Gamma distribution [4]. Accordingly, we represent the LuxR/HapR distribution by a Gamma distribution with a given variance and whose mean value is determined by solving the rate equations of our model (see next section).
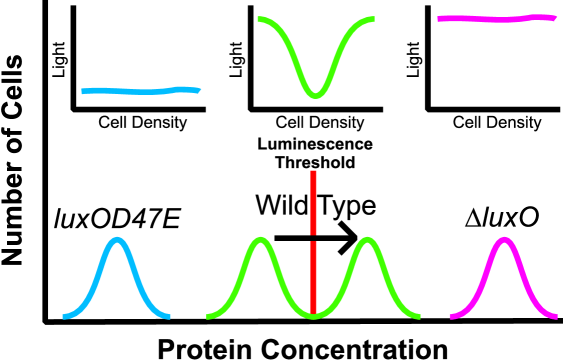
With the assumptions mentioned above, we can make significant inferences about quorum sensing networks based on the luminescence data. The change in RLU/cell over several orders of magnitude corresponds to the steady state distribution for LuxR/HapR crossing the luminescence activation threshold (see figure 3). Thus the mean concentration of LuxR/HapR must change by the minimal amount indicated in the figure during the transition from the ‘dark’ phenotype to the maximally luminescent phenotype. The WT luminescence curves indicate that this change occurs gradually in V. harveyi (positions (1) and (2) in figure 2) as compared to V. cholerae (positions (2) and (3) in figure 2). Since the change in mean HapR levels in V. cholera (at OD ) occurs without a corresponding significant change in cell density, it is unlikely to be driven solely by quorum sensing. Instead we infer, based on the luminescence phenotype, that there is a sharp rise in HapR levels around OD in V.cholerae. One potential cause for this rise is a further reduction in the available regulatory sRNAs allowing for more available hapR transcripts. A possible source of the sRNA reduction is that as the cells move into stationary phase from growth phase, there is a decrease in the production of the Hfq chaperone [10]. A decrease in Hfq corresponds to a decrease in the concentration of sRNA-Hfq complexes which are necessary to regulate the target mRNA. Recent experiments in V. cholerae have indeed found evidence for a sharp rise in HapR levels at OD [28].
In contrast, the transition in the WT luminescence phenotype for V. harveyi occurs at lower OD values and is more gradual suggesting that it is driven by the quorum sensing pathway. This observation leads to the suggestion that the crucial difference between the two species lies in the location of the threshold for luminescence activation: in V. harveyi, quorum sensing based regulation suffices for moving the steady state LuxR distribution across the threshold, whereas in V. cholerae this requires an additional jump in HapR levels at OD .
2.2 A minimal model for luminescence activation
We focus on quorum sensing pathway elements corresponding to the production of sRNAs, the transcription of the target mRNA (luxR or hapR), and the interaction between the sRNAs and target mRNA. We start with a model containing only one sRNA species and neglect autoregulation of the target protein. Then we add the contributions of multiple sRNAs and autoregulation to the model.
The basic equations for a simplified model of sRNA-target interaction have been introduced and analyzed in previous work [14, 16, 15, 23] and are given below (equations (1) and (2)). Consider first the case of a single sRNA species regulating one target mRNA species. If denotes the concentration of the sRNA and the concentration of the target mRNA, the corresponding equations are:
| (1) | |||||
| (2) |
where the ’s are the production rates of each species, the ’s are the degradation rates of each species, and is an effective parameter for mutual degradation of sRNA and target mRNA.
To generalize the above equations (1) and (2) while taking care of the effective parameter constraints (see Appendix A), we include the effects of 1) multiple sRNAs regulating luxR/hapR and 2) autoregulation of LuxR/HapR [3, 17]. The corresponding equations are,
| (3) | |||||
| (4) |
The constant , represents the threshold concentration for binding of the target protein to its own mRNA. When the target protein is bound to the promoter region, transcription of the target gene is effectively blocked.
Bioinformatic analysis [14] indicates that the 32 bp region in the qrr sRNAs which is involved in regulation of hapR/luxR is absolutely conserved for all the sRNAs. Thus, we make the assumption that all the sRNAs have the same affinity for the target mRNA, i.e. we set . We further assume that the degradation rates of all sRNAs are the same (). However, the model does consider differences in the sRNAs production rates () as demonstrated by experiment [31].
At steady state, the mean protein concentration is the mean mRNA concentration scaled by a constant – the ratio of the protein translation rate to the protein degradation rate. Therefore, we use the scaled mRNA concentration in place of the protein concentration (see Appendix).
To make the connection to luminescence curves, we have to consider the distribution of protein levels across cell populations. Recent work by Friedman et al. showed the distribution of the protein concentration per cell for the colony can be represented by a Gamma distribution [4]. Furthermore, recent flow cytometry work showed the distributions of fluorescence per cell from a luxR-gfp fusion had a nearly constant variance for a variety of conditions related to the concentration of AIs [33]. Similarly, luminescence output from Vibrio harveyi was shown to be heterogenous across cell populations [1]. Therefore, we model the protein distribution as a Gamma distribution with a fixed variance. The mean of the distribution is obtained from the equations above for a given choice of parameters. Using this framework, we show in the following section how a single parameter difference can account for the vastly different luminescence phenotypes of V. harveyi and of V. cholerae.
3 Results and Discussion
In this section we show how the minimal model discussed above with only one essential difference (the threshold for luminescence activation) between the V. harveyi and V. cholerae pathways can explain the observed differences in luminescence phenotypes as well as lead to testable predictions.
We note that bacterial colonies are observed to change their luminescence production by many orders of magnitude in a relatively short amount of time, see figure 2. However, the changes in the level of the master regulator proteins and sRNAs are not nearly as dramatic [33, 30]. We interpret this as indicating that a significant fraction of all the cells in the colony reach the conditions necessary for luminescence activation upon a small change in the master regulator protein levels. We model this as corresponding to a significant fraction of the master regulator distribution moving across sharp threshold values of concentrations necessary to activate luminescence (see figure 3).
3.0.1 The protein distributions for WT strains
Using the model equations with parameter values guided by experiment (see Appendix), we plot the the distribution of the protein concentration for a WT colony (representing either V. harveyi or V. cholerae) at the low-cell density limit, high-cell density limit, and entering stationary phase labeled as positions (1), (2), and (3) respectively, see figure 4. Since the protein distributions for WT and all the mutants in either V. harveyi or V. cholerae are not available, we plot the distributions with respect to fold changes relative to the mean protein concentration for a WT colony at the low-cell density limit.222At the time of this work, the experimental protocol for measuring the exact protein concentration per cell in vivo was not available and has now only recently been published [29]. Specifically, the first two distributions in figure 4 are representative of the maximal relative change in protein concentration in going from low-cell density to high-cell density based on changes due to quorum sensing alone. The third distribution in figure 4 is the resulting distribution after the final reduction in sRNA production leading to a rise in HapR due to entering stationary phase.
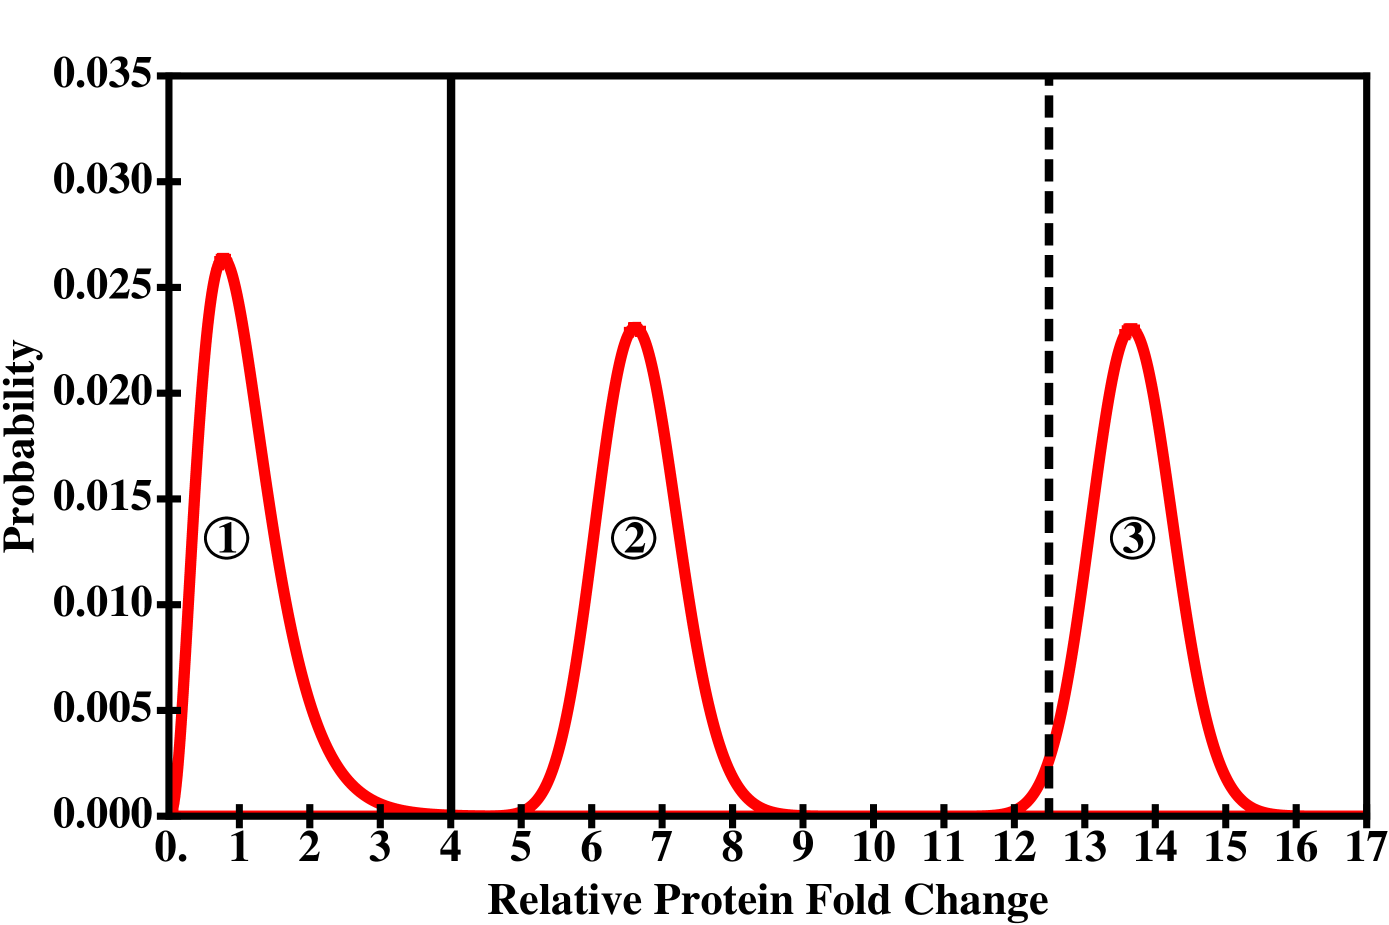
The distributions at positions (1) and (2) in figure 4 represent the maximally dark and maximally bright WT V. harveyi colonies, respectively. Similarly, the distributions at positions (1-2) and (3) in figure 4 represent the maximally dark and maximally bright WT V. cholerae colonies, respectively. Ideally none of the bacteria in the dark colony should be “on” and none of the bacteria in the bright colony should be “off”, therefore we set the threshold of light activation for V. harveyi at a fold change directly in between the two distributions – depicted as the solid, vertical line in figure 4. Since experiments have shown that the activation of V. cholerae to occur at a larger cell density than V. harveyi, we propose the threshold of light activation for V. cholerae to be at a larger fold change – depicted as the dashed, vertical line in figure 4. As indicated in the figure, this corresponds to luminescence activation occurring in V. harveyi using quorum sensing alone, whereas for V. cholerae luminescence activation requires both transition to the high-cell density limit for the quorum sensing pathway and additional changes in HapR levels associated with entry into stationary phase. In what follows, we will discuss how assuming V. cholerae has a different threshold of light activation than V. harveyi can consistently explain the differences in the sRNAs and mutant phenotypes.
3.0.2 Additivity vs redundancy
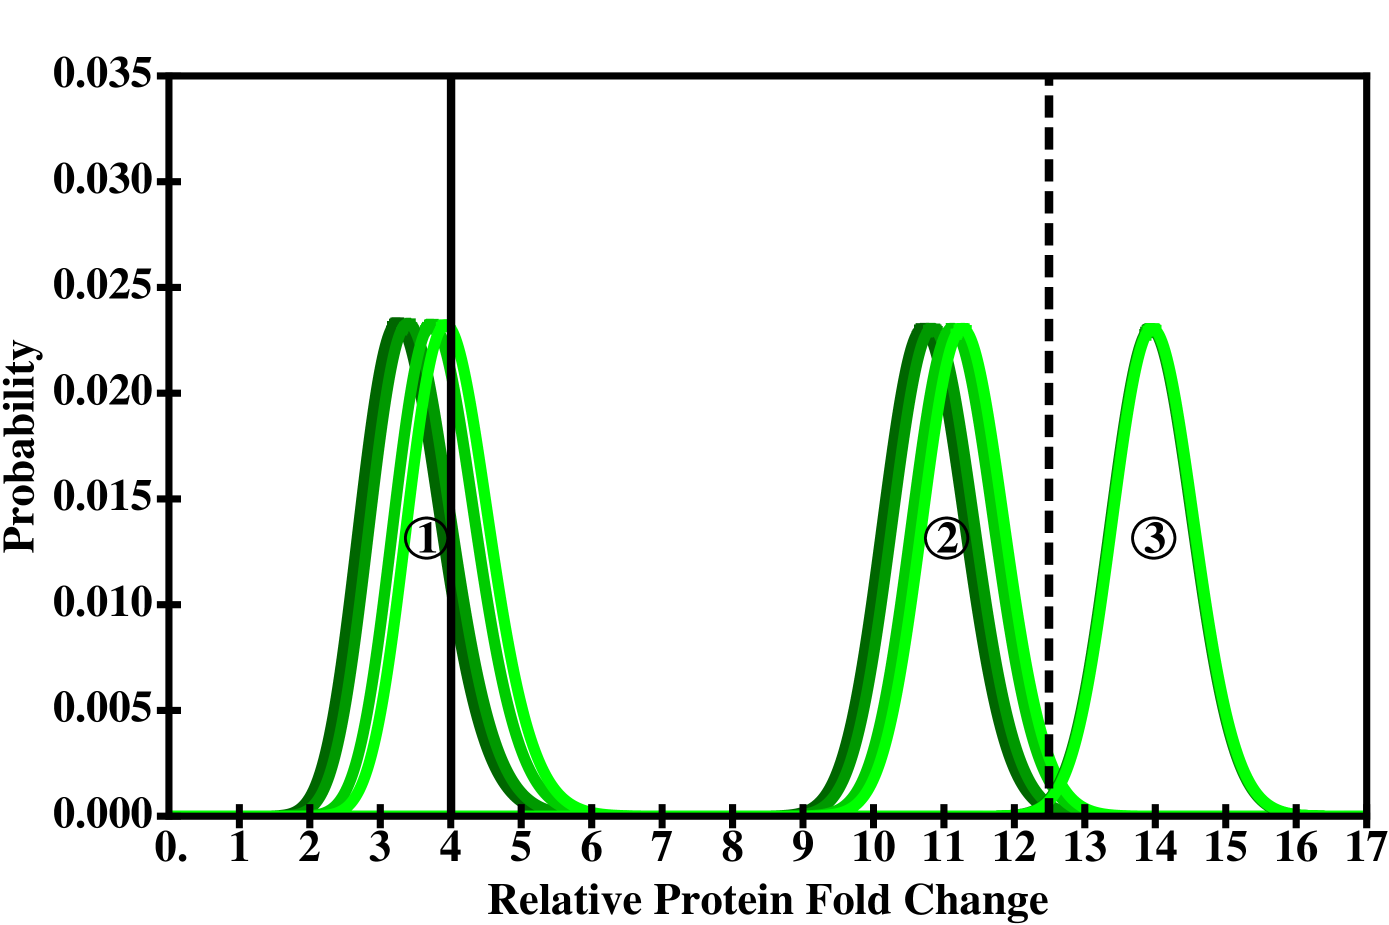
We account for each of the four active qrr sRNAs having a different production rate and set the rates with the following hierarchy: qrr4 qrr2 qrr3 qrr1, which is consistent with experimental results in V. harveyi [30]. Figure 5 shows the distributions of the protein concentrations for mutant colonies containing only one of the four active qrr sRNAs for both V. harveyi and V. cholerae – each sRNA mutant is represented as a different shade of green in figure 5.
In the low-cell density limit, position (1) in figure 5, the distributions all have regions extending past the threshold for luminescence in V. harveyi. This is a representation of the qrr “additivity” response seen in V. harveyi as all qrrs are needed to prevent any appreciable region of the protein distribution from extending past the threshold in the low-cell density limit [30]. For the sRNA mutants, the regions of the distributions in the low-cell density limit that extend past the threshold represent the amount of bacteria in the colony that are “on” regardless of cell density.
The story is different from the perspective of V. cholerae. In the high-cell density limit, position (2) in figure 5, the distributions are all below the threshold for luminescence in V. cholerae, which corresponds to complete light repression and mimics the WT V. cholerae response [14]. We suggest that once the final reduction in sRNA production occurs, e.g. entering stationary phase, all the distributions cross the threshold for luminescence, position (3) in figure 5. The resulting phenotype looks to be the same as the WT V. cholerae phenotype with the conclusion that the sRNAs act “redundantly”. However, the prediction from our model is that the sRNAs behave the same in both V. harveyi and V. cholerae, but the associated thresholds for luminescence are different.
3.0.3 The luxU mutant
The luxU mutant is another example of a difference in luminescence phenotypes between V. harveyi and V. cholerae. The protein LuxU is responsible for coupling the autoinducer input signal to the rest of the quorum sensing network, see figure 1. If LuxU is removed from the pathway, the total sRNA transcription rate would drop to minimal levels, and the system would no longer respond to changes in cell density. Therefore if the quorum sensing pathway is the only factor controlling the luminescence phenotypes, removal of the the gene should result in a bright, density independent phenotype. For V. harveyi, this is indeed the case – the mutant is bright regardless of cell density.
The story, as before with the sRNAs, is different with V. cholerae. In V. cholerae, the mutant shows a density dependent luminescence phenotype, but the shape of the luminescence curve is different from the canonical quorum sensing luminescence curves [21]. In the low-cell density limit, there is a detectable level of light production that is larger than WT value or any of the sRNA mutants values but much less than the maximal level of light production. This low level of luminescence remains stable for a significant portion of the exponential phase, and then sharply increases to the maximum level of luminescence – a feature present in most V. cholerae luminescence curves.
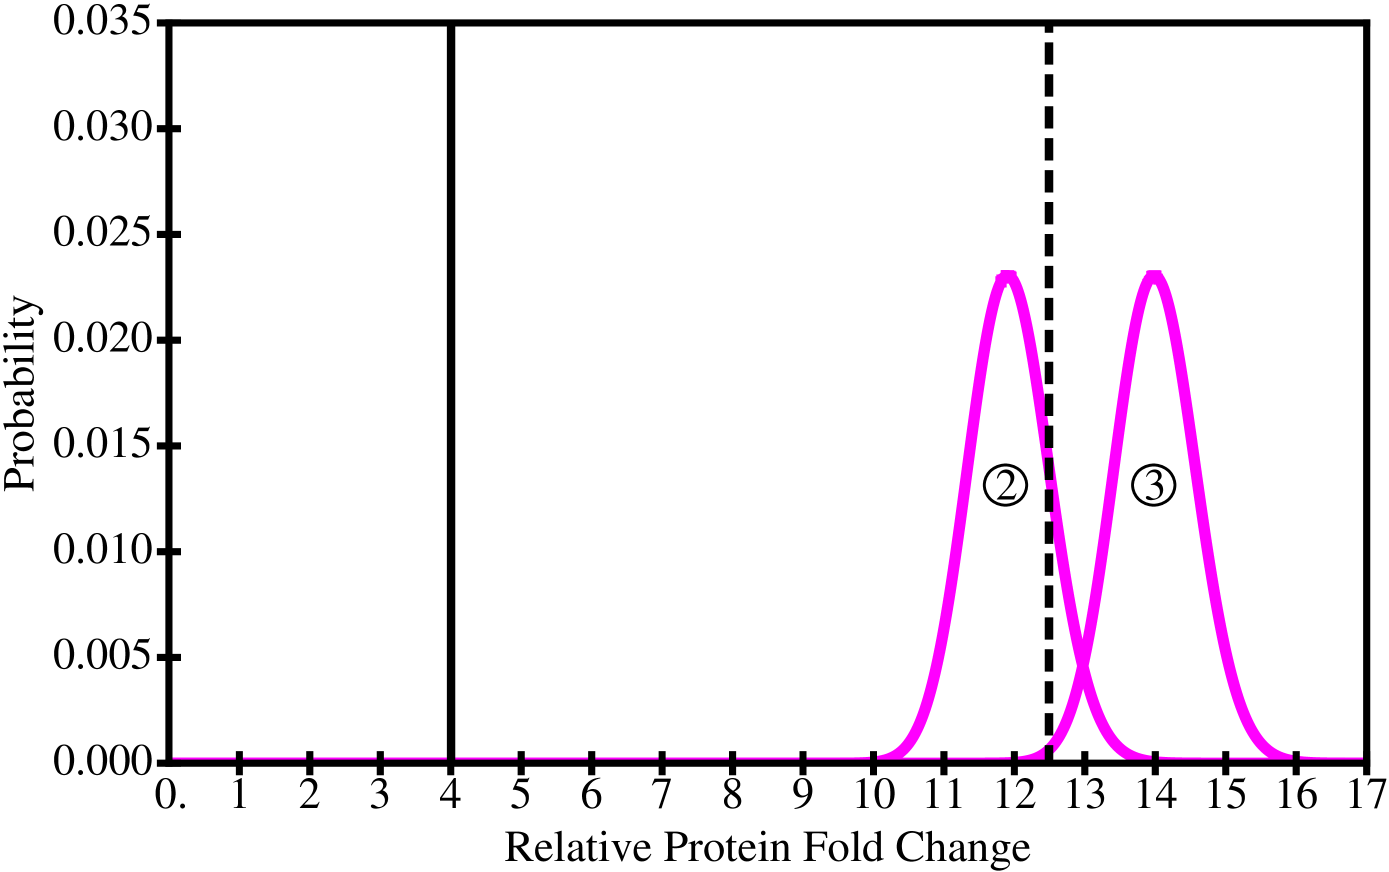
Our model reproduces this observed mutant behavior in V. harveyi and V. cholerae. In figure 6, there are only two distributions: one for the high-cell density limit (position (2)) and one for the high-cell density limit entering stationary phase (position (3)). From the perspective of LuxR/HapR regulation, the removal of effectively decouples the quorum sensing pathway from the outside inputs. Therefore, the system effectively starts at the high-cell density limit, and the associated protein distribution is always past the V. harveyi luminescence threshold. This results in a fully bright, density independent phenotype, see figure 6. However, the distribution associated with the high-cell density is only partially across the V. cholerae luminescence threshold resulting in a small concentration of the cells being “on” and a majority being “off”. The V. cholerae colony will remain in this state until it enters stationary phase where the protein distribution completely crosses the V. cholerae luminescence threshold, see figure 6.
Finally, the luminescent behavior of the and double mutant in V. cholerae is also consistent with the model. Essentially, this double mutant shows a WT response even though the both autoinducer sensors are removed [13]. In our model, this would correspond to the system starting in the WT high-cell density limit, position (2) in figure 4, which is below the threshold for luminescence in V. cholerae. Therefore, the observed phenotype should be nearly identical to WT.
By just having two thresholds separating three distinct regions of protein regulation, our model is able to consistently link the sRNAs acting additively in V. harveyi [30], the sRNAs acting redundantly in V. cholerae [14], and the density dependent phenotype in V. cholerae for the mutant [21]. With the relative positions of the thresholds and protein distributions now in place, we now discuss the predictions that come from our model.
3.1 Predictions
Current experimental techniques can produce a variety of different mutant strains of V. harveyi and of V. cholerae. Depending on the genes and sRNAs being removed from the strain, the experimental techniques generate even up to triple knock-out mutants (and possibly more if required). Since our simplified model, with the given choice of parameters, reproduces features of the observed luminescence phenotypes, it is of interest to examine the model predictions for luminescence phenotypes of different gene and sRNA mutant strains that should be experimentally feasible to test.
The model distinguishes the varying behaviors of V. harveyi and of V. cholerae as a difference in the threshold protein concentration of the master regulatory gene, and the concentration of the master regulatory gene at any position is determined by the associated production rate of the sRNAs. Therefore, there is an effective total sRNA production rate that coincides with the distribution of the master regulatory protein being centered at a given threshold value. We refer to this critical value of total sRNA production as .
Since we assume the threshold values are different for V. harveyi and V. cholerae, their associated critical value of total sRNA production, , is different. Each mutant has an associated total sRNA production rate at low-cell density and high-cell density limits. A hierarchy of sRNA production rates for different mutants and colony cell densities relative to explains currently seen phenotypes, and we will use this hierarchy as a basis for predicting new phenotypes.
| (5) | |||
| (6) |
Equations (5) and (6) represent the hierarchies for V. harveyi and V. cholerae, respectively. Those rates greater than correspond to “dark” phenotypes, and those rates less than correspond to “bright” phenotypes. In equations (5) and (6), and represent the total sRNA production rate for wild-type bacteria in the low-cell density and high-cell density limits before the transition to stationary phase. and are the sRNA production rates for any mutant with at least one active sRNA removed from the system in the low-cell density and high-cell density limits before the transition to stationary phase. Finally, and in equations (5) and (6) are the sRNA production rates for the mutants where LuxU and LuxO has been deleted, respectively. Now that the hierarchy is established, we discuss below the resulting predictions.
One way to explore the different quorum sensing responses of the network is to add an external concentration of autoinducers to a low-cell density colony, also know as “cross-feeding”. The additional autoinducers will “trick” a colony into behaving as if it is in the high-cell density limit which causes a transition in the total sRNA production rate. Since the production rates specifically dependent on cell density, , , , and are separated by in equation (5), the model predicts a low-cell density colony of wild-type or any sRNA mutant V. harveyi will start to luminesce when extra autoinducers are added to the colony.
However, for V. cholerae, the production rates specifically dependent on cell density are all greater than in equation (6). Even the production rate of the mutant is greater than . Therefore, the model predicts that a low-cell density colony of wild-type or any sRNA mutant V. cholerae will remain dark when extra autoinducers are added to the colony. Also, the model predicts this outcome for any mutant V. cholerae corresponding to a total sRNA production rate greater than , including the mutant and the and double mutant.
The model also predicts cases where the sRNAs act “additively” in the mutant V. cholerae. Since the total sRNA production rate associated with the mutant (6) is adjacent to , reducing the total sRNA production rate to a value less than will result in light production. This could be achieved by combining with sRNA mutants. Therefore, the different sRNA triple mutants in combination with the mutant for V. cholerae should show the associated HapR concentration changing in a graded manner. Thus our model predicts that, in a mutant background, the different triple sRNA mutants will appear to behave additively with regards to the luminescence – a phenotypic response similar to sRNA mutants in WT V. harveyi.
3.2 Discussion
In this study, we have shown how a simple set of equations, with appropriate choice of parameters, can effectively mimic the quorum sensing luminescence phenotypes of V. harveyi and V. cholerae. While the components of the quorum sensing regulatory network in each of the bacteria are biologically similar in both homology and function, there are striking differences in luminescence phenotypes for the same mutant, e.g. . Even the sRNAs, which are virtually identical in their sequence specificity to the target gene, act additively versus redundantly for V. harveyi and V. cholerae.
We account for the striking differences by suggesting that the threshold concentration of the master protein needed for the bacteria to start luminesce activation is larger in V. cholerae than V. harveyi. The larger threshold concentration correspondingly implies the need for a mechanism that increases the levels of the master regulator in addition to the increases due to quorum sensing. The increase in master regulator levels can be effectively modeled as a sharp drop in sRNA productions rates and one possible source of this reduction can arise from the transition from exponential growth phase to stationary phase.
We considered solutions of the model equations for specific parameter choices motivated by experiments and analyzed the effect different mutants have on the sRNAs’ production rates. In V. harveyi, the removal of either LuxO or LuxU causes a sufficient reduction in the sRNAs’ production rate to result in the bacterial colony achieving maximal luminescence at any cell densities. Only the removal of LuxO from V. cholerae results in a similar response. Removing LuxU does not drop the sRNAs’ production rates enough for the bacteria to luminesce at any cell density. The extra reduction in the sRNAs’ production rates from the transition to stationary-phase is required for the mutant of V. cholerae to luminesce.
We note that differences in the rate parameters between the two species could also account for some of the observed differences in phenotypes. However, quantifying the multitude of reaction rates in both organisms is a challenging task experimentally. Also, even if significant differences in the rates between the two species are found, it is not clear if they will account for the observed dramatic differences in phenotypes. Instead of considering a multitude of parameter differences as the explanation for the observed phenotypes, our model suggests that changes in a single parameter can provide a unifying explanation for all the observed differences. Furthermore our model leads to testable predictions which can easily be validated experimentally (e.g. changes in luminescence upon crossfeeding).
We further note that an alternative explanation for the differences in the luminescence phenotypes (in particular for the mutant phenotypes) is based on the observation that the VarA/S-CsrA pathway interacts with the the quorum sensing pathway in V. cholerae [13]. While the corresponding interaction has not been studied in V. harveyi, it is likely that VarA/S-CsrA pathway interacts with the quorum sensing pathway in a similar fashion in V. harveyi. If, however, it turns out that the interaction between the two pathways is absent in V. harveyi, then this observation could account for some of the differences seen. In this case, the fold-change required for luminescence activation would be higher in V. cholerae due to repression by CsrA taking place in V. cholerae but not in V. harveyi. However, even with the deletion of in V. cholerae, the mutant still shows a density-dependent phenotype in V. cholerae [13] in contrast to the observed phenotype in V. harveyi. Thus there is a clear difference between the mutant phenotypes between the two species which cannot be ascribed to potential differences in the interactions between the quorum sensing pathways and the VarA/S-CsrA pathway.
Within our model, the relationship between the threshold concentration and the total of all the sRNAs’ production rates leads to experimental predictions. The first prediction is the inability to prematurely initiate luminescence in a low-cell density colony of V. cholerae through the addition of a large concentration of autoinducers. Thus cross-feeding based activation of luminescence should work in V. harveyi but not in V. cholerae We also predict that a mutant of V. cholerae combined with sRNAs mutants will result in a phenotype where the sRNAs act additively.
In summary, we have presented a simplified model for quorum sensing induced luminescence phenotypes in V. harveyi and V. cholerae. Our analysis suggests that a single parameter difference in our model effectively reproduces many features of observed luminescence curves which were hitherto unconnected. Thus large sequence-based differences are, in principle, not required to explain the dramatic differences between the luminescence phenotypes in these two species. Our model also makes testable predictions for observable luminescence phenotypes (specifically in V. cholerae) which, if validated, should shed new light on luminescence regulation by quorum sensing.
Acknowledgements
RVK acknowledges support from the U.S National Science Foundation (NSF) through grant PHY-0957430. ATF acknowledges support from NSF IGERT grant DGE-0504196. The authors also acknowledge support from ICTAS (Virginia Tech) and the Virginia Tech ASPIRES award.
4 Appendix
4.1 Single sRNA model
Here we provide additional details for the single sRNA model. For convenience, we introduce the following dimensionless parameters; , , , and in equations (1) and (2) so that the corresponding equations at steady state become:
| (7) | |||||
| (8) |
These equations can be readily solved to determine how steady state sRNA-mRNA levels change as system parameters are varied. In the limit , the solutions show a sharp transition as the ratio changes from to . This parameter regime lets the system respond in an ultrasensitive manner as discussed in previous works [14, 23]. During quorum sensing, the production rate of the sRNA () decreases and hence the parameter is lowered as bacteria make the transition from low-cell density to high-cell density. Correspondingly the system evolution traces out a trajectory in phase space. For the target mRNA levels show a sharp change as the line is crossed; thus it seems natural to identify the sharp transition observed in the luminescence profile with the sharp transition in target mRNA levels as is lowered. However, as argued in the previous sections, this identification is unlikely to be valid based on the following observations: 1) the quorum sensing response in V. harveyi is observed to be graded rather than all-or-none [33]. 2) Recent experiments have shown that HapR represses aphA at low cell density [11], thus target mRNA levels are significant even at low cell densities. 3) northern blots show little difference in the amount of sRNA in V. cholerae when the target mRNA (hapR) is deleted [14].
Observation 3.) from above suggests that the sRNA and mRNA interactions occur in a parameter regime where the sRNA is never fully suppressed. To adhere to this constraint, we look at the limit and which effectively holds the sRNA concentration constant regardless of the target mRNA concentration. In this limit, the system no longer has an ultrasensitive response, but instead responds in a controlled manner. As sRNA production rates double, the mRNA concentrations are about halved, thus allowing for a graded response. Applying the limits and to equations (7) and (8) in the steady state explicitly shows the controlled response:
| (9) | |||||
| (10) |
We note that recent research [28] has provided evidence for dosage compensation in V. cholerae due to regulation of sRNA production by HapR. While the inclusion of this effect will imply that the restrictions on the parameter noted above are not required, the observation that the response of the regulated target is graded in a controlled manner remains the same.
4.2 Multiple sRNA with autoregulation model
Here we provide additional details for the multiple sRNA with autoregulation model. In V. harveyi, there are a total of five sRNAs; however, only four are actively controlling the concentration of luxR mRNA. Likewise, V. cholerae contains four active sRNAs. Including multiple sRNAs has generated the new constants: , , and . However, we make the assumptions that each sRNA has equal affinity to the target mRNA and all the sRNAs have the same degradation rate in both bacteria. These assumptions return to and to . To model autoregulation, we introduce the dimensionless parameter as the threshold concentration for effective autoregulation of the target gene. In dimensionless units, the system should be tuned in such a way that is not larger than the maximum value obtainable by which is 1.
Using similar dimensionless parameters as the single sRNA model, we replace with , and introduce the dimensionless parameter , which is only necessary in the time dependent solutions of the model. Equations (3) and (4) are therefore rewritten as the following set of dimensionless equations
| (11) | |||||
| (12) |
The addition of multiple sRNAs to the model does not change the production rate of the target mRNA; therefore, we still consider the system to be in the parameter space where . At steady state, and the summation in equation (12) reduces to . Since is independent of the summation, the sum is only of , which results in just a constant representing all the contributions of the sRNAs, . The effects of multiple sRNAs are all integrated into the constant , and their removal via mutations to the wild-type bacteria is equivalent to reducing the maximum and minimum value of as the bacteria moves from low cell density to high cell density respectively. The steady state concentration of therefore becomes:
| (13) |
The effect of the autoregulation is best seen via different limiting cases of ratio in equation (13). When , then resulting in . This corresponds to the case where autoregulation is maximally on which prevents the system from sustaining any appreciable amount of protein. When , then resulting in which is similar in form to equation (10) where autoregulation is absent from the system. Since the amount of is constrained to a value between 0 and 1, and is the effective concentration needed of the target protein before autoregulation occurs, we set , which corresponds to the production rate dropping by close to half as seen by experiment [3].
4.3 Parameter space analysis
Here we discuss the various parameter values and their associated experimental motivation used in the preceding models. Fluorescence experiments involving the expression of V. harveyi’s qrr2 in the low-cell density and high-cell density limits provide a possible measure for estimating the sRNA fold change between the two cell density limits [33]. The same type of fluorescence experiment shows the translational rate of luxR [33] when LuxR autoregulation is removed. A direct determination of relative fold differences using Real-Time Quantitative PCR for qrr1, qrr2, qrr3, qrr4, qrr5, and luxR with autoregulation intact has also been done [30]. In the case without autoregulation, luxR translational levels change 10 fold and qrr2 expression levels also change 10 fold.
| LCD (1) | HCD (2) | Stationary (3) | |
|---|---|---|---|
| WT | |||
| qrr1 | |||
| qrr2 | |||
| qrr3 | |||
| qrr4 | |||
| luxU | |||
| luxO |
With regards to the experimentally shown constraints, we let change 10 fold between the low-cell density and high-cell density limits. Since we are in the limit where is always greater than 1, we chose for the low-cell density resulting in for the high-cell density limit. We set to satisfy the previously discussed constraint: . The values chosen for and minimally satisfy the limits set on parameter space; and yet, the system behaves in a manner consistent with experiment. Smaller values of and/or larger values of are also consistent with experiment showing robustness of the system in this parameter regime.
To incorporate the effect of the system entering stationary phase, we introduced the parameter such that . we set to the fixed value 0.025 – the maximal value necessary to have a clear enough distinction between the distributions at position (2) and (3) for the mutant, where position (3) represents the colony entering stationary phase (see figure 6).
, , and are the only parameters necessary to determine the (normalized) mean values of LuxR/HapR. Furthermore, and remain a fixed value throughout our analysis, 0.1 and 0.025 respectively. , which is a function of the sRNA production rates, only changes in value between the low-cell density limit and the high-cell density limit. The effects of the different mutants are also embedded into as they represent variations to the sRNA production rates relative to the WT.
The critical factor in determining the decomposition of is the fraction of LuxO () that is capable of promoting the production of sRNA. Therefore, is a function of , . To better understand the contributions of LuxU and LuxO to , we specify the different values can achieve depending on cell density and genotype. First, quantitative real-time PCR experiments show a basal rate sRNA production that is independent of the presence of LuxO which we label: [30]. Next there is the rate, , that depends on the presence of LuxO which is evident in the mutant showing a wild-type like luminescence phenotype in V. cholerae [21]. Then there are the rates associated with phosphorylating LuxO, the dominant factor in sRNA production, in the low cell density limit () and in the high cell density limit (). The different values for WT, luxU, luxO, and the qrr mutants are listed in table 1.
References
- Anetzberger et al. [2009] Anetzberger, C., Pirch, T., Jung, K., Jul. 2009. Heterogeneity in quorum sensing-regulated bioluminescence of Vibrio harveyi. Mol Microbiol 73 (2), 267–77.
- Banik et al. [2009] Banik, S. K., Fenley, A. T., Kulkarni, R. V., December 2009. A model for signal transduction during quorum sensing in vibrio harveyi. Phys Biol 6 (4), 046008+.
- Chatterjee et al. [1996] Chatterjee, J., Miyamoto, C. M., Meighen, E. A., Apr 1996. Autoregulation of luxr: the vibrio harveyi lux-operon activator functions as a repressor. Mol Microbiol 20 (2), 415–425.
- Friedman et al. [2006] Friedman, N., Cai, L., Xie, X. S., Oct 2006. Linking stochastic dynamics to population distribution: an analytical framework of gene expression. Phys Rev Lett 97 (16), 168302–168302.
- Fuqua et al. [1996] Fuqua, C., Winans, S. C., Greenberg, E. P., 1996. Census and consensus in bacterial ecosystems: the LuxR-LuxI family of quorum-sensing transcriptional regulators. Annu Rev Microbiol 50, 727–751.
- Fuqua et al. [1994] Fuqua, W. C., Winans, S. C., Greenberg, E. P., Jan 1994. Quorum sensing in bacteria: the luxr-luxi family of cell density-responsive transcriptional regulators. J Bacteriol 176 (2), 269–275.
- Hammer and Bassler [2003] Hammer, B. K., Bassler, B. L., Oct 2003. Quorum sensing controls biofilm formation in vibrio cholerae. Mol Microbiol 50, 101–104.
- Henke and Bassler [2004a] Henke, J. M., Bassler, B. L., Jun 2004a. Quorum sensing regulates type iii secretion in vibrio harveyi and vibrio parahaemolyticus. J Bacteriol 186 (12), 3794–3805.
- Henke and Bassler [2004b] Henke, J. M., Bassler, B. L., Oct 2004b. Three parallel quorum-sensing systems regulate gene expression in Vibrio harveyi. J Bacteriol 186 (20), 6902–6914.
- Ishihama [1999] Ishihama, A., Mar 1999. Modulation of the nucleoid, the transcription apparatus, and the translation machinery in bacteria for stationary phase survival. Genes Cells 4 (3), 135–143.
- Kovacikova and Skorupski [2002] Kovacikova, G., Skorupski, K., 2002. Regulation of virulence gene expression in Vibrio cholerae by quorum sensing: Hapr functions at the aphA promoter. Mol Microbiol 46 (4), 1135–1147.
- Kuttler and Hense [2008] Kuttler, C., Hense, B. A., Mar. 2008. Interplay of two quorum sensing regulation systems of Vibrio fischeri. J Theor Biol 251 (1), 167–80.
- Lenz et al. [2005] Lenz, D. H., Miller, M. B., Zhu, J., Kulkarni, R. V., Bassler, B. L., Nov 2005. CsrA and three redundant small RNAs regulate quorum sensing in Vibrio cholerae. Mol Microbiol 58 (4), 1186–1202.
- Lenz et al. [2004] Lenz, D. H., Mok, K. C., Lilley, B. N., Kulkarni, R. V., Wingreen, N. S., Bassler, B. L., Jul 2004. The small RNA chaperone Hfq and multiple small RNAs control quorum sensing in Vibrio harveyi and Vibrio cholerae. Cell 118, 69–82.
- Levine and Hwa [2008] Levine, E., Hwa, T., December 2008. Small RNAs establish gene expression thresholds. Curr Opin Microbiol 11 (6), 574–579.
- Levine et al. [2007] Levine, E., Zhang, Z., Kuhlman, T., Hwa, T., August 2007. Quantitative Characteristics of Gene Regulation by Small RNA. PLoS Biol. 5 (9).
- Lin et al. [2005] Lin, W., Kovacikova, G., Skorupski, K., May 2005. Requirements for vibrio cholerae hapr binding and transcriptional repression at the hapr promoter are distinct from those at the apha promoter. J Bacteriol 187 (9), 3013–3019.
- McFall-Ngai and Ruby [2000] McFall-Ngai, M. J., Ruby, E. G., Dec 2000. Developmental biology in marine invertebrate symbioses. Curr. Opin. Microbiol. 3 (6), 603–607.
- Mehta et al. [2008] Mehta, P., Goyal, S., Wingreen, N. S., October 2008. A quantitative comparison of sRNA-based and protein-based gene regulation. Mol. Syst. Biol. 4.
- Miller and Bassler [2001] Miller, M. B., Bassler, B. L., 2001. Quorum sensing in bacteria. Annu. Rev. Microbiol. 55, 165–199.
- Miller et al. [2002] Miller, M. B., Skorupski, K., Lenz, D. H., Taylor, R. K., Bassler, B. L., Aug 2002. Parallel quorum sensing systems converge to regulate virulence in vibrio cholerae. Cell 110 (3), 303–314.
- Mitarai et al. [2007] Mitarai, N., Andersson, A. M., Krishna, S., Semsey, S., Sneppen, K., Sep 2007. Efficient degradation and expression prioritization with small rnas. Phys. Biol. 4 (3), 164–171.
- Mitarai et al. [2009] Mitarai, N., Benjamin, J.-A. M., Krishna, S., Semsey, S., Csiszovszki, Z., Massé, E., Sneppen, K., June 2009. Dynamic features of gene expression control by small regulatory RNAs. Proc. Natnl. Acad. Sci. U. S. A. 106 (26), 10655–10659.
- Müller et al. [2008] Müller, J., Kuttler, C., Hense, B. a., Apr. 2008. Sensitivity of the quorum sensing system is achieved by low pass filtering. Bio Systems 92 (1), 76–81.
- Müller et al. [2006] Müller, J., Kuttler, C., Hense, B. A., Rothballer, M., Hartmann, A., Oct. 2006. Cell-cell communication by quorum sensing and dimension-reduction. Journal of mathematical biology 53 (4), 672–702.
- Ng and Bassler [2009] Ng, W. L., Bassler, B. L., 2009. Bacterial quorum-sensing network architectures. Annu. Rev. Genet. 43, 197–222.
- Pai and You [2009] Pai, A., You, L., Jul. 2009. Optimal tuning of bacterial sensing potential. Molecular Systems Biology 5 (286), 1–11.
- Svenningsen et al. [2008] Svenningsen, S. L., Waters, C. M., Bassler, B. L., January 2008. A negative feedback loop involving small rnas accelerates vibrio cholerae’s transition out of quorum-sensing mode. Genes Dev. 22 (2), 226–238.
- Teng et al. [2010] Teng, S.-W., Wang, Y., Tu, K. C., Long, T., Mehta, P., Wingreen, N. S., Bassler, B. L., Ong, N. P., May 2010. Measurement of the Copy Number of the Master Quorum-Sensing Regulator of a Bacterial Cell. Biophysical Journal 98 (9), 2024–2031.
- Tu and Bassler [2007] Tu, K. C., Bassler, B. L., Jan 2007. Multiple small RNAs act additively to integrate sensory information and control quorum sensing in vibrio harveyi. Genes. Dev. 21 (2), 221–233.
- Tu et al. [2008] Tu, K. C., Waters, C. M., Svenningsen, S. L., Bassler, B. L., November 2008. A small-rna-mediated negative feedback loop controls quorum-sensing dynamics in vibrio harveyi. Mol. Microbiol. 70 (4), 896–907.
- Waters and Bassler [2005] Waters, C. M., Bassler, B. L., 2005. Quorum sensing: cell-to-cell communication in bacteria. Annu. Rev. Cell. Dev. Biol. 21, 319–346.
- Waters and Bassler [2006] Waters, C. M., Bassler, B. L., Oct 2006. The Vibrio harveyi quorum-sensing system uses shared regulatory components to discriminate between multiple autoinducers. Genes Dev. 20 (19), 2754–2767.