Two-dimensional H kinematics of bulgeless disk galaxies
Abstract
We present two-dimensional H velocity fields for 20 late-type, disk-dominated spiral galaxies, the largest sample to date with high-resolution H velocity fields for bulgeless disks. From these data we derive rotation curves and the location of the kinematic centers. The galaxy sample was selected to contain nucleated and non-nucleated galaxies (as determined from prior HST imaging), which allows us to investigate what impact the gas kinematics in the host disk have on the presence (or absence) of a nuclear star cluster. In general, we find that the velocity fields span a broad range of morphologies. While some galaxies show regular rotation, most have some degree of irregular gas motions, which in nearly all cases can be either attributed to the presence of a bar or is connected to a rather patchy distribution of the H emission and the stellar light. There appears to be no systematic difference in the kinematics of nucleated and non-nucleated disks. Due to the large fields of view of the integral field units we use, we are able to observe the flattening of the rotation curve in almost all of our sample galaxies. This makes modeling of the velocity fields relatively straight-forward.
Due to the complexities of the velocity fields, we obtain reliable determinations of the kinematic center for only 6 of our 20 sample galaxies. For all of these the locations of the nuclear star cluster/photometric center and the kinematic center agree within the uncertainties. These locations also agree for 7 more objects, despite considerably larger uncertainties as to the accuracy of the kinematic center. If we disregard all kinematically irregular galaxies, our study concludes that nuclear star clusters truly occupy the nuclei, or dynamical centers, of their hosts. Our results are thus consistent with in-situ formation of nuclear star clusters. Yet, many well-motivated formation scenarios for nuclear clusters invoke off-center cluster formation and subsequent sinking of clusters due to dynamical friction. In that case, our results imply that dynamical friction in the centers of bulgeless galaxies must be very effective in driving massive clusters to the kinematic center.
keywords:
galaxies: bulges; galaxies: nuclei; galaxies: star clusters; galaxies: spiral; galaxies: kinematics and dynamics1 Introduction
What defines the center of a galaxy? This question is not merely academic, because throughout the last decade, a number of studies have found tight correlations between the global properties of galaxies and the properties of their nuclei (e.g. Ferrarese & Merritt, 2000; Gebhardt et al., 2000; Marconi & Hunt, 2003; Häring & Rix, 2004). These global-to-nuclear scaling relations can be interpreted such that the mass assembly of a galaxy is pre-determined by its nuclear properties, or alternatively, that galaxy nuclei evolve in a way that is governed by the assembly of the entire galaxy.
Either way, characterizing the nuclear properties has become an important diagnostic tool in constraining the formation mechanism(s) of galaxies. The question of where the galaxy nucleus - i.e. its center of mass - is located seems obvious in ellipticals and bulge-dominated spirals, where very often a luminous active galactic nucleus (AGN) marks the location of a super-massive black hole (SMBH) which almost certainly marks the bottom of the potential well.
However, in the latest Hubble-types, i.e. in bulgeless, “pure” disk galaxies, (luminous) AGN are rare (Satyapal et al., 2009), and it is less obvious whether the galaxy disk rotates around a nucleus that follows in any way the scaling relations mentioned above. A number of recent studies have suggested that in late-type spirals, the nucleus is marked by a massive stellar cluster (Phillips et al., 1996; Carollo et al., 1998; Matthews et al., 1999; Böker et al., 2002, 2004). Such Nuclear Clusters (NCs) are also present in earlier type galaxies (e.g. recently Balcells et al., 2003; Lotz et al., 2004; Côté et al., 2006), but the exact relation between NCs in galaxies of different Hubble types remains unclear to date. NCs have masses of (Walcher et al., 2005) and show stellar populations of multiple ages (Walcher et al., 2006; Rossa et al., 2006; Seth et al., 2006), pointing towards them having a complex formation history.
On average, the location of NCs appears to coincide with the photometric center (PC) as derived from isophotal fits (Böker et al., 2002). However, the often irregular and asymmetric shape of late-type disk galaxies causes rather large uncertainties in defining the PC, and doubts have been raised on whether NCs actually define the bottom of the potential well (Matthews & Gallagher, 2002; Andersen et al., 2008).
Settling this question is important in order to rule out a number of suggested formation mechanisms for NCs. For example, if migration and/or merging of massive clusters is the dominant formation mechanism of NCs, as suggested by Bekki (2007), Capuzzo-Dolcetta & Miocchi (2008) and Agarwal & Milosavljevic (2010), one would expect to find a number of NCs displaced from the nucleus, as e.g. Georgiev et al. (2009) find for dwarf irregular galaxies.
Since not all late-type spirals harbor an obvious NC (Böker et al., 2002), one may also ask whether there is a galaxy property that prevents the formation of a NC. Nuclear star formation may be suppressed in galaxies with irregular gas kinematics, and hence there may be systematic differences in the gas rotation patterns of galaxies with and without NCs.
In order to address both these questions, we have obtained two-dimensional velocity fields of the ionized gas (as traced by the H line) for a sample of 20 late-type spiral galaxies. The use of H as a tracer for the general gas kinematics is required for an accurate comparison of the position of the kinematic center (KC) and the PC, because it can be observed at high spatial resolution. While H may be affected by stellar winds, supernovae, or other deviations from the pure disk rotation, in general, it has been found to represent well the overall rotation field of the neutral (i.e. HI) gas (Swaters et al., 2009).
Similar studies have been performed in the past (e.g. Ganda et al., 2006; Bershady et al., 2010) but this study is the first to focus exclusively on bulgeless spirals. In addition, our analysis includes parameterised descriptions of the H rotation curve for all galaxies, thus enabling a direct comparison with the kinematics of other gas components.
This paper is structured as follows: following this introduction, we describe in § 2 the galaxy sample, the observations, and data reduction methods. In § 3, we detail the methods used to fit the H velocity fields, to derive the H rotation curves, and to extract the location of the KC. We discuss our results in § 4 and conclude in § 5.
2 Galaxy sample and Observations
2.1 Sample Selection
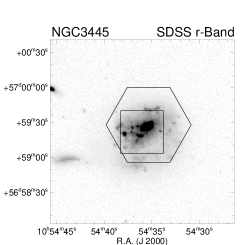
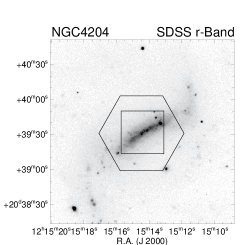
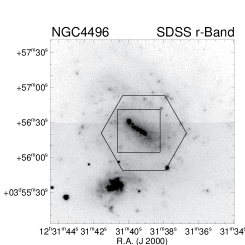
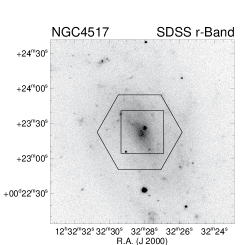
The galaxy sample discussed here was selected from the sample of Böker et al. (2002), and thus consists of spirals with late Hubble-type (Scd or later) and low inclination (). In order to gauge the importance of a NC for the H kinematics, we selected galaxies with and without a NC in roughly equal parts. Given the visibility constraints from Calar Alto111The German-Spanish Astronomical Center, Calar Alto, is jointly operated by the Max-Planck-Institut f r Astronomie Heidelberg and the Instituto de Astrof sica de Andaluc a (CSIC). and WIYN222The WIYN Observatory is a joint facility of the University of Wisconsin-Madison, Indiana University, Yale University, and the National Optical Astronomy Observatories., we identified a sample of 20 objects, summarized in Table 1. The object distances are between 6 and 28 Mpc, which implies that the field of view of the Ppak and SparsePak instruments cover between 2 and 9.5 kpc in radius. The main instrumental parameters of Ppak and SparsePak are summarised in Table 2.
| Galaxy | Hubble type | RA | DEC | D | ||||||||
|---|---|---|---|---|---|---|---|---|---|---|---|---|
| (hh:mm:ss.ss) | (dd:mm:ss.s) | (Mpc) | ( L⊙) | (km s-1) | (mag) | (mag/arcsec2) | ||||||
| UGC 35742 | SAcd | 06:53:10.4 | +57:10:40 | 20. | 73.0 | 10. | 0 | 167 | . | 90 | 18. | 90.1 |
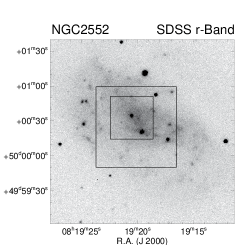
| NGC 25522 | SAm | 08:19:20.5 | +50:00:35 | 11. | 92.0 | 2. | 3 | 62 | . | 04 | 20. | 150.1 |
| UGC 44992 | SABdm | 08:37:41.5 | +51:39:09 | 12. | 82.0 | 0. | 23 | 51 | . | 59 | 19. | 85 |
| UGC 52881 | Sdm | 09:51:17.0 | +07:49:39 | 6. | 01.2 | 0. | 072 | 49 | – | 19. | 8 0.1 | |
| NGC 32062 | SBcd | 10:21:47.6 | +56:55:50 | 20. | 70.4 | 3. | 0 | 78 | – | 18. | 780.05 | |
| NGC 33461 | SBcd | 10:43:38.9 | +14:52:19 | 22. | 43.0 | 8. | 8 | 124 | . | 78 | 18. | 30.2 |
| NGC 34232 | SAcd | 10:51:14.3 | +05:50:24 | 11. | 30.6 | 1. | 4 | 127 | . | 84 | 17. | 90.15 |
| NGC 34451 | SABm | 10:54:35.5 | +56:59:26 | 17. | 52.0 | 3. | 4 | 148 | . | 42 | 18. | 10.1 |
| NGC 42041 | SBdm | 12:15:14.3 | +20:39:32 | 7. | 92.0 | 0. | 25 | – | . | 26 | 19. | 60.1 |
| NGC 42991 | SABdm | 12:21:40.9 | +11:30:12 | 16. | 82.0 | 3. | 9 | 109 | . | 73 | 19. | 00.5 |
| NGC 4496a1 | SBm | 12:31:39.2 | +03:56:22 | 15. | 61.2 | 5. | 8 | 94 | . | 99 | 18. | 90.1 |
| NGC 4517a1 | SBdm | 12:32:28.1 | +00:23:23 | 24. | 53.0 | 1. | 4 | 69 | – | 19. | 80.1 | |
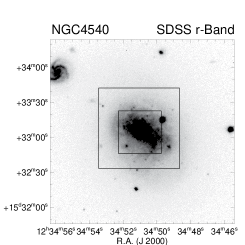
| NGC 45402 | SABcd | 12:34:50.8 | +15:33:05 | 16. | 82.0 | 4. | 8 | 83 | . | 29 | 18. | 050.05 |
| NGC 46251 | SABm | 12:41:52.7 | +41:16:26 | 8. | 22.0 | 0. | 51 | 39 | . | 61 | 17. | 50.2 |
| NGC 49041,2 | SBcd | 13:00:58.6 | :01:40 | 20. | 02.0 | 2. | 1 | 105 | – | 17. | 30.2 | |
| UGC 85161 | Scd | 13:31:52.6 | +20:00:04 | 20. | 42.0 | 1. | 6 | 60 | . | 97 | 18. | 70.1 |
| NGC 56692 | SABcd | 14:32:43.5 | +09:53:26 | 18. | 02.0 | 8. | 6 | 98 | . | 03 | 18. | 50.1 |
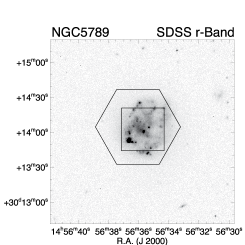
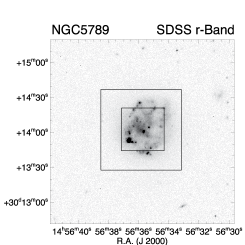
| NGC 57891,2 | Sdm | 14:56:35.5 | +30:14:03 | 33. | 03.0 | 4. | 3 | 123 | – | 19. | 90.05 | |
| NGC 59641 | SBd | 15:37:36.3 | +05:58:24 | 26. | 52.0 | 21. | 6 | 121 | . | 62 | 18. | 90.1 |
| NGC 65091 | Sd | 17:59:25.3 | +06:17:13 | 28. | 23.0 | 6. | 3 | 218 | . | 08 | 17. | 80.1 |
Note. – Galaxies with 1 were observed with CAHA/Ppak, those with 2 with WIYN/SparsePak. RA, DEC and Hubble types are from the RC3 (de Vaucouleurs et al., 1991) through NED. Distances have been assembled through NEDs summary statistics and are from redshift independent measurements, where possible. If only one measurement was available we assumed a default uncertainty of max(2Mpc, D*0.1). For UGC 8516 and NGC 5789 the distance comes from the redshift, corrected for Virgo, Great Attractor and Shapley cluster infall, following the formulae of Mould et al. (2000). and have been assembled through Leda and use their itc and parameters. Central surface brightnesses have been derived from the HST I-band surface brightness profiles (SBP) of Böker et al. (2002). For galaxies without a NC the SBPs are flat in all cases and is well defined. For galaxies with a NC it is unclear to what extend the disk extends further into the NC, we therefore chose to use the surface brightness just outside the NC as a measure of . Error bars give our estimate of the systematic uncertainty of this number.
2.2 Ppak Data
During the nights of May 7th and 8th, 2007, thirteen galaxies of our sample were observed at the 3.5 m telescope of the Calar Alto observatory, using the Potsdam Multi Aperture Spectrograph (PMAS, Roth et al., 2005) in its Ppak mode (Kelz et al., 2006). The Ppak science fibre bundle consists of 382 fibres of 2.7 arcsec diameter each, of which 331 (the science fibres) are concentrated in a hexagonal bundle covering a field-of-view of 72”64” with a filling factor of 65%. The sky background is sampled by 36 additional fibres, distributed in 6 bundles of 6 fibres each, distributed along a circle 90 arcsec from the center of the instrument FOV. The sky-fibres are distributed among the science fibres within the pseudo-slit in order to have a good characterization of the sky; the remaining 15 fibres are used for calibration purposes. Cross-talk between adjacent fibres is estimated to be less than 5% when using a simple aperture extraction (Sánchez, 2006). Adjacent fibres in the pseudo-slit may cover very different locations on the sky, thus further reducing the effect of cross-talk.
The J1200 grating, mounted backwards in 2nd order, was used for all observations. It covers the wavelength range 6350-6690 Å with a spectral resolution of 0.5 Å(11000). For each galaxy, two exposures were taken, with exposure times between 900s and 1500s, depending on the target brightness. The nights were clear, with a slightly elevated extinction (0.18 mag), but stable in both cases. The seeing was variable, ranging between 0.8 and 1.3. A spectrophotometric standard star was observed each night, in order to correct for the transmission curve of the instrument. Note though that spectrophotometric accuracy is not required for our analysis.
The data were reduced using R3D (Sánchez, 2006), in combination with IRAF333IRAF is distributed by the National Optical Astronomy Observatories, which are operated by the Association of Universities for Research in Astronomy, Inc., under cooperative agreement with the National Science Foundation. packages and E3D (Sánchez, 2004). The reduction consists of the standard steps for fibre-based integral-field spectroscopy. A master bias frame (created by averaging all bias frames observed during the night) was subtracted from the science frames. Exposures of a given sky position were median-combined using IRAF routines, thus clipping any cosmic rays. The locations of the spectra on the CCD were traced using an exposure of a continuum lamp taken before the science exposures. Each spectrum was then extracted from the science frames, and stored in a row-stacked-spectrum file (Sánchez, 2004). Wavelength calibration was performed using the position of Ne lines in lamp exposures obtained before and after each pointing, yielding an accuracy of rms 0.15 Å. Differences in the relative fibre-to-fibre transmission throughput were corrected by comparing the wavelength-calibrated science frames with the corresponding frames derived from sky exposures taken during twilight. Then, the data was corrected for the average instrument throughput curve, by comparing the observed spectrum of the spectrophotometric calibration star with a flux-calibrated one. Finally, a contemporaneous (average) night sky spectrum was obtained by combining the spectra of the 36 sky fibers, and subtracted from the science spectra. The relative location of the final science spectra on the sky were obtained via the standard Ppak position table.
| Ppak | SparsePak | |
| # science fibres | 331 | 75 |
| # sky fibres | 36 | 7 |
| size of fibres | 27 | 4675 |
| field-of-view | ||
| filling factor | ||
| wavelength range | ||
| instrumental FWHM |
2.3 SparsePak Data
Nine galaxies in our sample were observed using SparsePak (Bershady et al., 2004) on the 3.5m WIYN telescope during the course of four nights, namely March 27–30, 2007.
SparsePak is a fiber optic–array that feeds light from the WIYN Nasmyth f/6.3 focus imaging port to the Bench Spectrograph. The SparsePak IFU consists of 82 fibers with a diameter of each, arranged in a sparse grid with a field of regard of , thus offering good coverage and sampling of our target galaxies. The spectrograph was configured with the Bench Spectrograph Camera (BSC) and an Echelle grating with 316 lines/mm, used in 8th order. It covers the wavelength range 6500 Å Åwith a dispersion of 0.195 Å/pix (8.6 km s-1/pix) and an instrumental FWHM of 0.67 Å (30.5 km s-1).
This rather high resolution is mandatory for our purpose: fitting velocity field models to galaxies with observed rotation velocities of roughly 100 km s-1 requires a centroiding accuracy of 5 km s-1. The BSC images the spectrograph onto a T2KA CCD with 2048x2048 pixels. The spectra are aligned along the columns of the CCD. The chip has a read noise of 4 e- and was used with the standard gain of 2.1 e-/ADU. The system throughput for this setup is roughly 4% (Bershady et al., 2005).
The sparse grid can be filled in with 3 pointings, and we observed 8 of the 9 galaxies with 3 pointings (NGC 5789 was only observed with two pointings). When WIYN first points to a target, the slit-viewing camera is used to put the PC roughly coincident with fiber 52 at the center of the SparsePak array (if the target has a surface brightness that is too low, as is the case for many of these targets, we trust that the WIYN pointing is accurate enough to deliver the science target onto the fiber array after offsetting from a nearby star). After minute exposures (we use 2 exposures to be able to better reject cosmic rays), guiding is stopped, and the telescope is offset by towards the South and guiding is resumed. After the next minute exposures, guiding is paused, the telescope is offset by West and North from the second position. Guiding is resumed, and the final minute exposures for a galaxy are taken.
Data were overscan- and bias-corrected and trimmed using the NOAO IRAF package ccdproc. Cosmic ray rejection was performed before spectral extraction, using the method described in Andersen et al. (2006). Following cosmic-ray cleaning, basic spectral extraction, flattening, and wavelength calibration were done using the IRAF package dohydra. During this process, we made use of bias frames, dome flats, and Thorium Argon emission spectra that were taken each night. Finally, the emission from the night sky was subtracted by averaging the spectra of the seven sky fibers, and subtracting the result from each of the 75 source spectra.
2.4 Image Registration
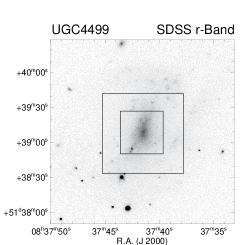
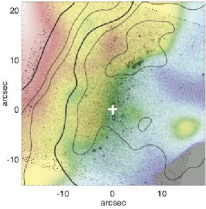
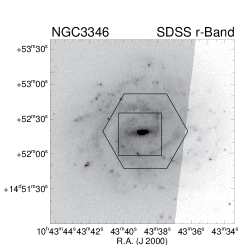
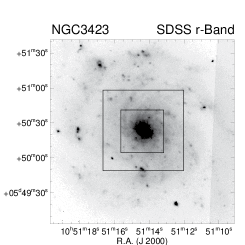
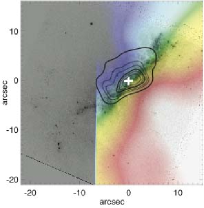
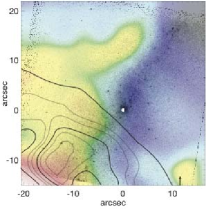
In order to correlate the results of the kinematical analysis with the galaxy morphology, and in particular the positions of KC, PC, and NC, we use archival HST/WFPC2 F814W images (roughly corresponding to the Johnson I-band) from the snapshot survey of Böker et al. (2002). For each galaxy, we first created a continuum image from the IFU data cube by fitting the continuum in a spectral window free of emission lines. This should allow a fair comparison to the I-band images. We then smoothed the HST image with a Gaussian beam whose width matches the seeing-limited resolution of the IFU observations (typically 1.0″).
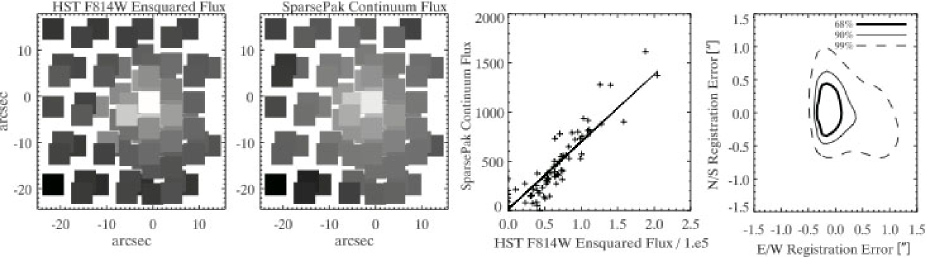
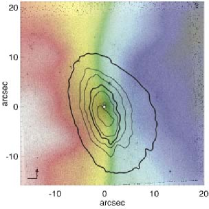
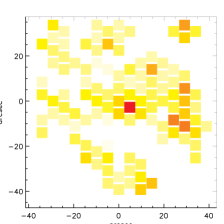
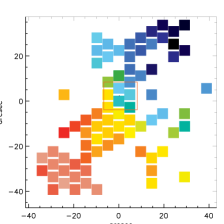
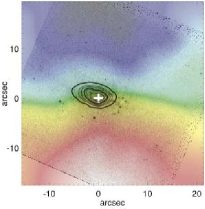
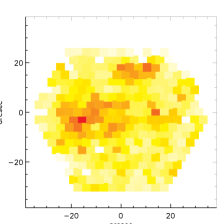
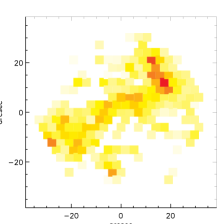
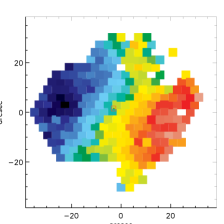
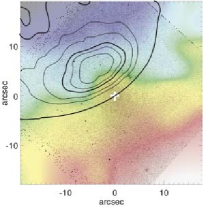
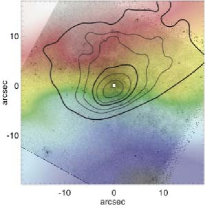
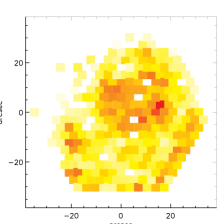
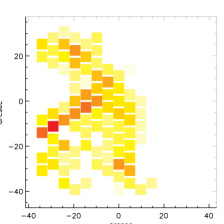
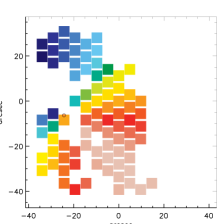
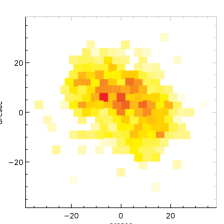
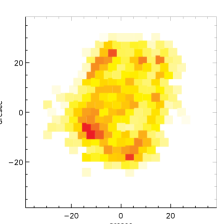
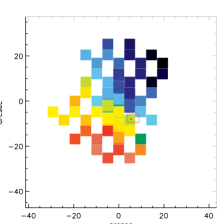
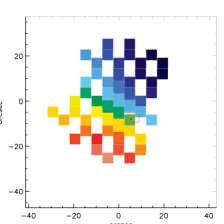
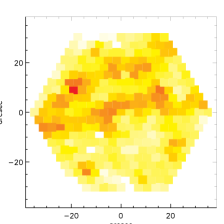
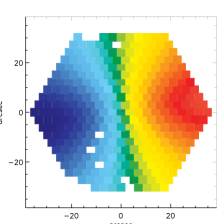
We cross-correlated both images as follows: for a given position of the (smoothed) HST image, we extracted its flux within the footprint of each IFU spaxel. We then fit a linear relation between the IFU and the HST spaxel fluxes and tabulated . We repeated this process over a grid of offsets between both images, thus “mapping” . The offset grid has a granularity corresponding to five times the pixel size of the WFPC2 data, i.e. 0.232″. The location of the minimum within the offset grid was used as the best registration, and the minimum value to estimate the uncertainty in the registration (see Fig. 1 for an illustration).
2.5 Line Fitting and Extraction of Velocity Fields
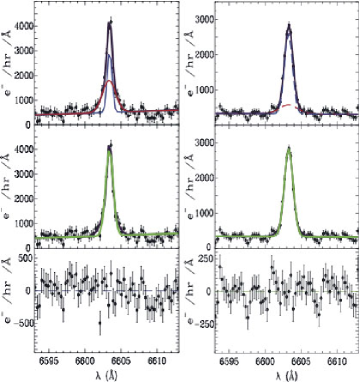
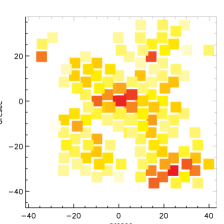
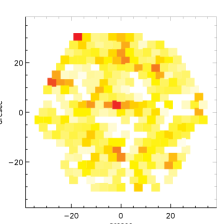
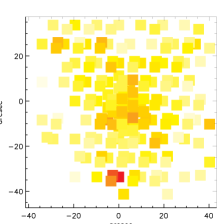
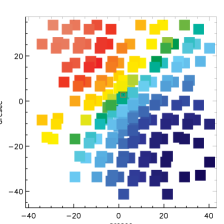
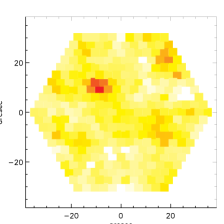
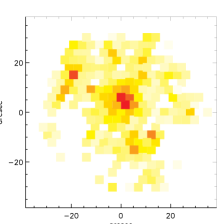
Once spectra were processed as described in § 2, we identified H emission-lines and measured fluxes, widths, centers and the corresponding errors for lines in a given spectral window. We detected H emission lines and measured their fluxes, widths and centroids in 3078 of 4303 Ppak and 1220 of 1950 SparsePak object spectra (72% and 63% detection rate, respectively). While the galaxy described in Andersen et al. (2008), NGC 2139, contained multiple kinematic components in each spectra, most emission lines in this sample were best fit by a single Gaussian line. Furthermore, typically 10 spectra per galaxy were best fit by two Gaussians with centers that were close to being coincident, i.e., the lines appeared to have a strong core with broader, low-level wings. Still, the center positions and widths of these lines can be very well fit by a single Gaussian (see Fig. 2). Only about 2-3 lines per galaxy exhibited two de-coupled Gaussian profiles. Almost all of these double-line features occur at the very center of the galaxies. In case of double line features, we used the more highly peaked, dominant component of the line fit to derive the velocity map.
3 Analysis
3.1 Kinematic Modelling
In order to interpret the H velocity fields that result from the analysis described in the last section, we fit them with a kinematic model. While there are arguments for fitting a more flexible tilted ring model, which allows for warps in the gas disks, the sometimes sparse sampling of the overall velocity field of our data did not allow this approach for all galaxies. In the interest of a uniform analysis for the entire sample, we therefore chose to follow the approach of Courteau (1997) who proposed the following parametric form for the (de-projected) rotation curve:
| (1) |
Courteau (1997) shows that this function describes the rotation curves of spiral galaxies well. Its specific advantage in our context is that it has only two intrinsic free parameters, i.e. scale radius and velocity scale, which is the minimum number of parameters possible for a rotation curve. The modeled two-dimensional velocity fields thus have seven free parameters: the systemic velocity ,the asymptotic velocity , the center positions and , the scale radius , the inclination and the position angle .
The fits are carried out via a custom-written Markov Chain Monte Carlo code. In addition to the best fit parameters, we also obtain their uncertainties. As in Andersen et al. (2008) we find that the formal, statistical errors on the H velocities are too small to yield a useful measure of the quality of the fit. We thus add a second, additive error term to make sure that the reduced of the best fit is not unreasonably high. We found that although our best-fit center does not depend on , the uncertainties in the position of the KC do. Also, this ad-hoc additional error term, hampers our capability to independently assess the quality of the final fit. We chose to set km/s for all galaxies (compare e.g. Kamphuis & Sancisi, 1993; Andersen et al., 2006; Sellwood & Sánchez, 2010, and references therein).
| Galaxy | Vsys | Vsys,NED | PA | i | Center RA | Center DEC | Center error | vcirc | rt | |||||
|---|---|---|---|---|---|---|---|---|---|---|---|---|---|---|
| (km s-1 ) | (km s-1 ) | (∘) | (∘) | (hh:mm:ss.ss) | (dd:mm:ss.s) | (arcsec) | (km s-1) | arcsec | ||||||
| (1) | (2) | (3) | (4) | (5) | (6) | (7) | (8) | (9) | (10) | |||||
| UGC 35742 | 1438 | 2 | 1441 | 98.4 | 0.5 | 25.3 | 0.2 | 06:53:10.43 | +57:10:37.9 | 0.9 | 167.2 | 0.3 | 198.4 | 0.4 |
| NGC 25522 | 511 | 3 | 524 | 62.4 | 0.9 | 25.4 | 0.4 | 08:19:19.44 | +50:00:48.7 | 2.3 | 62.2 | 1.6 | 221.0 | 1.9 |
| UGC 44992 | 685 | 2 | 691 | 141.9 | 1.7 | 29.0 | 0.2 | 08:37:41.49 | +51:39:13.6 | 6.8 | 50.9 | 1.6 | 200.2 | 2.7 |
| UGC 52881 | 576 | 6 | 556 | 56.7 | 0.5 | 29.9 | 0.2 | 09:51:16.88 | +07:49:47.3 | 4.3 | 48.6 | 0.4 | 179.0 | 0.4 |
| NGC 32062 | 1151 | 1 | 1150 | 183.0 | 0.5 | 26.5 | 0.1 | 10:21:47.81 | +56:55:49.8 | 0.6 | 78.4 | 0.4 | 229.3 | 1.2 |
| NGC 33461 | 1274 | 1 | 1260 | -67.1 | 0.6 | 29.4 | 0.3 | 10:43:38.85 | +14:52:16.6 | 0.6 | 123.6 | 0.8 | 207.1 | 1.3 |
| NGC 34232 | 1004 | 2 | 1011 | 45.1 | 0.8 | 19.0 | 0.2 | 10:51:14.36 | +05:50:24.3 | 1.1 | 127.0 | 0.5 | 295.6 | 1.2 |
| NGC 34451 | 2048 | 1 | 2069 | -9.8 | 1.1 | 27.6 | 0.4 | 10:54:35.21 | +56:59:23.7 | 1.9 | 148.1 | 2.3 | 132.1 | 4.9 |
| NGC 42041 | 870 | 3 | 856 | 240.2 | 2.5 | 13.6 | 1.7 | 12:15:14.36 | +20:39:29.6 | 2.6 | 50.0 | 2.8 | 238.0 | 19.3 |
| NGC 42991 | 237 | 2 | 232 | -110.3 | 1.0 | 28.7 | 1.2 | 12:21:40.59 | +11:30:11.4 | 0.9 | 109.1 | 1.1 | 189.9 | 4.8 |
| NGC 4496a1 | 1747 | 3 | 1730 | 47.5 | 0.3 | 30.4 | 0.1 | 12:31:39.75 | +03:56:18.9 | 1.7 | 94.3 | 0.2 | 221.3 | 0.5 |
| NGC 4517a1 | 1525 | 2 | 1509 | -156.6 | 1.5 | 33.7 | 1.2 | 12:32:28.32 | +00:23:28.7 | 1.9 | 68.6 | 0.8 | 175.5 | 5.8 |
| NGC 45402 | 1291 | 2 | 1286 | 13.9 | 1.7 | 27.9 | 1.1 | 12:34:50.91 | +15:33:06.3 | 1.4 | 83.4 | 1.5 | 201.0 | 2.6 |
| NGC 46251 | 621 | 1 | 609 | -55.8 | 1.1 | 13.3 | 0.3 | 12:41:53.06 | +41:16:24.0 | 1.3 | 38.7 | 0.2 | 188.3 | 1.3 |
| NGC 49041 | 1180 | 1 | 1189 | -134.0 | 0.5 | 38.5 | 0.6 | 13:00:58.62 | -00:01:37.8 | 0.3 | 105.2 | 0.2 | 235.1 | 1.8 |
| NGC 49042 | 1162 | 2 | 1189 | 227.2 | 0.9 | 39.0 | 0.5 | 13:00:58.54 | -00:01:37.9 | 0.4 | 105.2 | 0.9 | 247.5 | 2.8 |
| UGC 85161 | 1026 | 3 | 1023 | 14.5 | 0.7 | 43.3 | 0.3 | 13:31:52.60 | +20:00:03.9 | 1.4 | 60.2 | 0.9 | 154.5 | 1.2 |
| NGC 56692 | 1368 | 2 | 1371 | 69.1 | 0.7 | 35.6 | 0.0 | 14:32:44.06 | +09:53:29.5 | 0.5 | 98.4 | 0.5 | 186.6 | 0.6 |
| NGC 57891 | 1811 | 1 | 1805 | 150.3 | 0.8 | 27.4 | 0.1 | 14:56:35.58 | +30:14:02.4 | 1.2 | 122.9 | 1.0 | 140.3 | .6 |
| NGC 57892 | 1809 | 2 | 1805 | 151.7 | 2.9 | 27.0 | 0.2 | 14:56:35.56 | +30:14:01.1 | 2.2 | 122.9 | 1.3 | 148.8 | 4.5 |
| NGC 59641 | 1457 | 4 | 1447 | 131.8 | 0.9 | 38.4 | 0.2 | 15:37:36.94 | +05:58:17.3 | 5.1 | 120.8 | 0.8 | 220.1 | 1.2 |
| NGC 65091 | 1780 | 1 | 1813 | -81.6 | 0.4 | 49.3 | 0.7 | 17:59:25.46 | +06:17:10.5 | 0.3 | 218.1 | 0.4 | 213.7 | 0.7 |
Note. – Galaxies with 1 were observed with CAHA/Ppak, those with 2 with WIYN/SparsePak. The kinematic parameters as derived in this paper are (2) systemic velocity , (4) Position to the major axis, (5) inclination, (6) and (7) RA and DEC of the KC, (8) error on the kinematic center, (9) Circular velocity, defined as the maximum velocity in the rotation curve fits, and (10) the scale radius of the rotation curve. For comparison to the modelled systemic velocity (2), we give the systemic velocity assembled through NED (3).
| Kinematic Center | offset | Nuclear Cluster Position | offset | Photometric Center | |||||
|---|---|---|---|---|---|---|---|---|---|
| Galaxy | RA | DEC | (KC-NC) | RA | DEC | (PC-KC) | RA | DEC | |
| hh:mm:ss.ss | dd:mm:ss.s | /pc | hh:mm:ss.ss | dd:mm:ss.s | /pc | hh:mm:ss.ss | dd:mm:ss.s | ||
| UGC 35742 | 06:53:10.43 | +57:10:37.9 | 1.7/170.6 | 06:53:10.39 | +57:10:39.5 | 5.7/ 572.0 | 06:53:10.39 | +57:10:39.5 | 1 |
| NGC 25522 | 08:19:19.44 | +50:00:48.7 | 21.3/1228.9 | 08:19:20.38 | +50:00:32.8 | 20.6/1188.5 | 08:19:20.28 | +50:00:32.4 | 1 |
| UGC 44992 | 08:37:41.49 | +51:39:13.6 | 4.5/279.3 | 08:37:41.43 | +51:39:09.2 | 5.1/316.5 | 08:37:41.44 | +51:39:08.6 | 1 |
| UGC 52881 | 09:51:16.88 | +07:49:47.3 | – | – | – | 8.8/256.0 | 09:51:17.09 | +07:49:39.1 | 0 |
| NGC 32062 | 10:21:47.81 | +56:55:49.8 | – | – | – | 0.2/20.1 | 10:21:47.79 | +56:55:49.7 | 2 |
| NGC 33461 | 10:43:38.85 | +14:52:16.6 | 0.6/65.2 | 10:43:38.84 | +14:52:17.2 | 0.9/97.7 | 10:43:38.82 | +14:52:17.4 | 2 |
| NGC 34232 | 10:51:14.36 | +05:50:24.3 | 3.1/169.8 | 10:51:14.31 | +05:50:24.3 | 3.1/169.8 | 10:51:14.31 | +05:50:24.3 | 2 |
| NGC 34451 | 10:54:35.21 | +56:59:23.7 | 5.8/492.1 | 10:54:35.55 | +56:59:26.4 | 6.1/517.5 | 10:54:35.59 | +56:59:25.9 | 1 |
| NGC 42041 | 12:15:14.36 | +20:39:29.6 | 1.4/53.6 | 12:15:14.43 | +20:39:28.8 | 1.4/53.6 | 12:15:14.40 | +20:39:29.6 | 0 |
| NGC 42991 | 12:21:40.59 | +11:30:11.4 | 2.9/236.2 | 12:21:40.39 | +11:30:11.8 | 2.3/187.3 | 12:21:40.44 | +11:30:10.6 | 2 |
| NGC 4496a1 | 12:31:39.75 | +03:56:18.9 | 7.8/589.9 | 12:31:39.24 | +03:56:20.5 | 7.6/574.8 | 12:31:39.26 | +03:56:20.9 | 1 |
| NGC 4517a1 | 12:32:28.32 | +00:23:28.7 | – | – | – | 7.0/831.5 | 12:32:28.15 | +00:23:22.2 | 1 |
| NGC 45402 | 12:34:50.91 | +15:33:06.3 | 2.7/219.9 | 12:34:50.89 | +15:33:06.9 | 0.7/57.0 | 12:34:50.89 | +15:33;06.9 | 1 |
| NGC 46251 | 12:41:53.06 | +41:16:24.0 | 1.6/63.6 | 12:41:53.06 | +41:16:25.6 | 1.6/63.6 | 12:41:53.06 | +41:16:25.6 | 1 |
| NGC 49041 | 13:00:58.62 | -00:01:37.8 | – | – | – | 2.8/271.5 | 13:00:58.59 | -00:01:37.9 | 2 |
| NGC 49042 | 13:00:58.54 | -00:01:37.9 | – | – | – | 0.8/77.6 | 13:00:58.59 | -00:01:37.9 | 2 |
| UGC 85161 | 13:31:52.60 | +20:00:03.9 | 0.6/59.3 | 13:31:52.56 | +20:00:03.8 | 0.9/89.0 | 13:31:52.54 | +20:00:03.6 | 1 |
| NGC 56692 | 14:32:44.06 | +09:53:29.5 | 1.2/104.7 | 14:32:44.09 | +09:53:30.6 | 1.0/87.3 | 14:32:44.09 | +09:53:30.4 | 2 |
| NGC 57891 | 14:56:35.58 | +30:14:02.4 | – | – | – | 4.0/640.0 | 14:56:35.84 | +30:14:03.1 | 1 |
| NGC 57892 | 14:56:35.56 | +30:14:01.1 | – | – | – | 4.8/767.9 | 14:56:35.84 | +30:14:03.1 | 1 |
| NGC 59641 | 15:37:36.94 | +05:58:17.3 | 15.0/1927.1 | 15:37:36.11 | +05:58:25.9 | 14.7/1888.6 | 15:37:36.13 | +05:58:25.7 | 0 |
| NGC 65091 | 17:59:25.46 | +06:17:10.5 | 2.5/341.8 | 17:59:25.36 | +06:17:12.5 | 2.6/ 355.5 | 17:59:25.34 | +06:17:12.4 | 1 |
Note. – Galaxies with 1 were observed with CAHA/Ppak, those with 2 with WIYN/SparsePak. The position of the kinematic center as derived in this paper is given in columns RAKC and DECKC. The Nuclear Cluster coordinates (RANC/DECNC) and coordinates of the photometric center (RAPC/DECPC) are taken from Böker et al. (2002). The offsets between nuclear cluster and kinematic centre (KC-NC) and photometric centre and kinematic centre (PC-KC) are given in arcseconds and parsecs (using the distances given in Table 1. The parameter is a measure for how well the velocity fields can be modelled, where 0 denotes a bad fit to the data, 1 denotes models with low trust and 2 denote models of high fidelity.
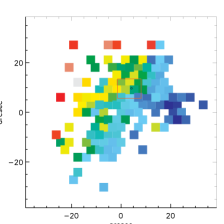
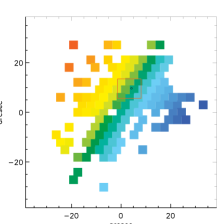
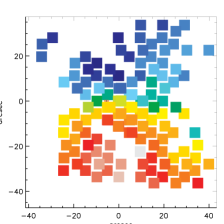
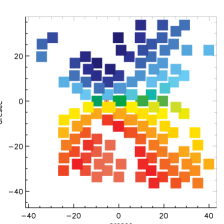
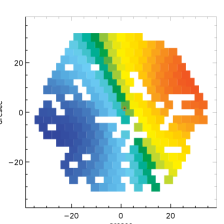
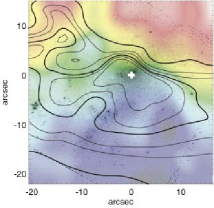
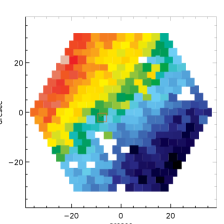
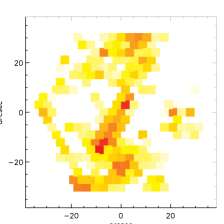
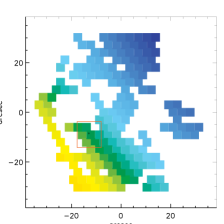
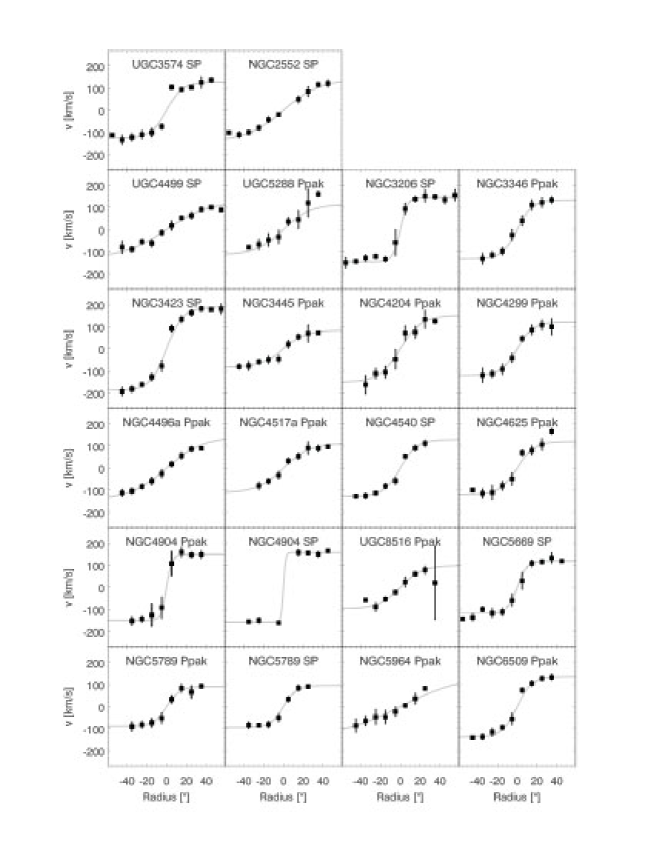
The best-fit kinematic models are presented in column 4 of Fig. 4, and the derived rotation curves, including the best fit to Eq. 1, are shown in Figure 9. The Figures show that our model velocity fields seem to be a fair representation of the observations, confirming that also the latest Hubble types can be fit reasonably well with this simple functional form. The resulting best-fit kinematic parameters are summarised in Table 3.
Since we are mostly interested in the position of the KC, we have checked the dependence of the fit results on the chosen starting values for the center position, for , , , etc. We find that the fit always converges to the same solution, within 30% of the nominal error bar, demonstrating that our results are insensitive to the choice of starting values. The derived coordinates of the KCs are given in Table 4.

3.2 Uncertainties in the kinematic modelling
For an independent check, we compared our results to the apparent maximal rotation velocity of the gas (parameter ) from the HyperLEDA database444http://leda.univ-lyon1.fr (Paturel et al., 2003). As pointed out by Courteau (1997), the parameter in Eq. 1 is in itself not a good measure of the maximal velocity. Instead, we use , i.e. the model velocity at three times . Figure 3 shows that correlates well with the parameter from LEDA, after correction for the galaxy inclination as derived from our fits. There are a number of uncertainties underlying the plotted values giving rise to the scatter in the plotted relation, like irregularities in the velocity fields for both HI and H or the fact that we do not sample the full velocity field with our Hdata. Given these uncertainties, the scatter is surprisingly low. This demonstrates the reliability of our kinematic models555We note that it is doubtful whether further exploration of our data for Tully-Fisher relation purposes is reasonable, due to the many kinematic uncertainties we identify..
|


|

|
|
|

|

|


|


|

|

|


|


|


|


|

|


|
|


|
|

|

|
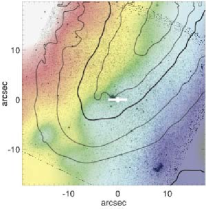
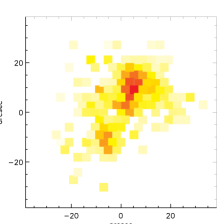
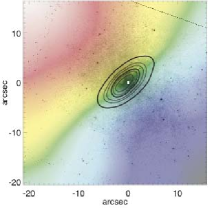
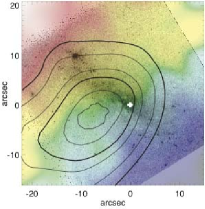
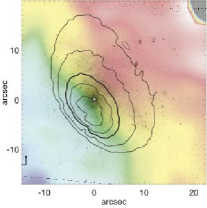
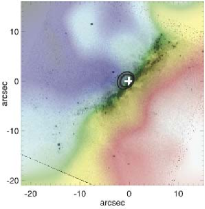
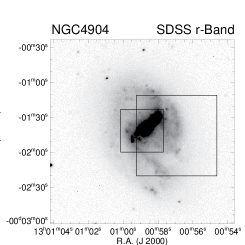
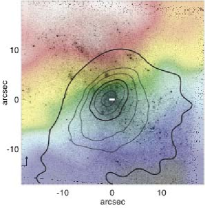
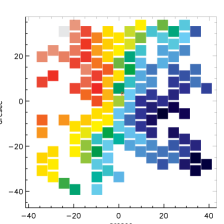
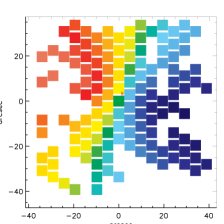
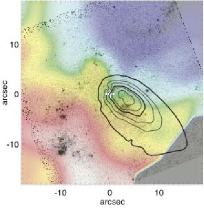
A further consistency check can be performed by comparing the dynamical models derived from Ppak and SparsePak data for NGC 4904 and NGC 5789, the two galaxies which have been observed with both instruments. As can be seen from Fig. 4, the observations agree well in both cases. The fit results also agree well, both in the location of the KC, and in the overall shape of the contours, despite marked differences in the spatial sampling. We take this as confirmation of both the quality of our data and the robustness of our analysis method.
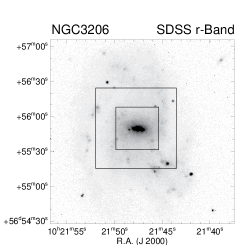
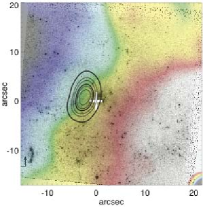
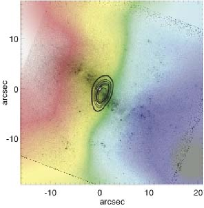
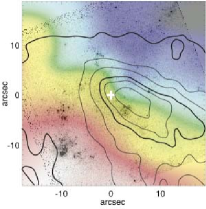
However, our main uncertainty in the velocity field modelling is the actual complexity of the velocity fields. Our simple model does e.g. not include the effects of streaming motions due to bars or the effects on the velocity field due to interactions with a companion galaxy. We have performed an eye-ball check of our trust in the velocity field modelling, by looking at the spacing of the contours of the fit to the dynamical centre (see Fig. 4 column 5), weighing in the presence/absence of a bar/companion, the filling factor of Halpha emission, the overall regularity of the velocity field and the quality of the fit to the rotation curve. On that basis we have assigned quality flags from 0 (unusable) over 1 (low trust) to 2 (well modelled) to each velocity field. This quality assessments number is added as a column in Table 4. This exercise has been somewhat sobering as to our ability to systematically determine dynamical galaxy centers, as only 7 velocity fields out of 22 obtain the label “well modelled”. Only two of these are neither barred nor show any other sign of problems (NGC 3423, NGC 3206). Late type disk galaxies tend to be irregular and a well-defined center simply does not exist in quite a few of them. The implications of this will be further discussed in Section 4.
3.3 Comparing kinematic centers and photocenters
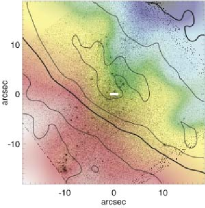
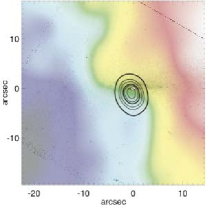
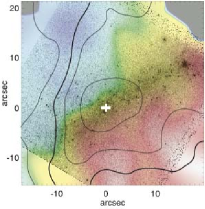
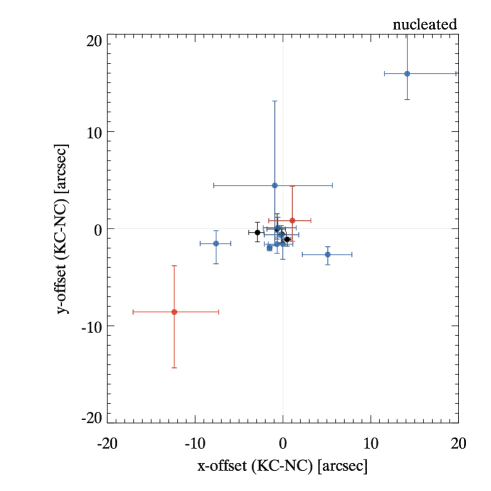
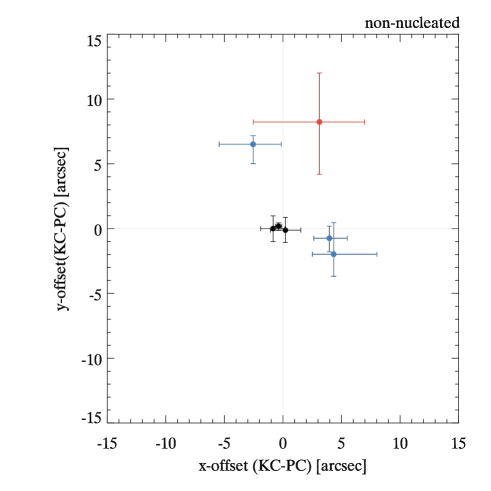
Following image registration as described in § 2.4, we can measure the absolute coordinates of the best fit KC. Table 4 summarizes the KC positions, along with those of the PC and NC (if present). The latter two were derived from isophotal fits to the WFPC2 image, as described in Böker et al. (2002). All coordinates in Table 4 refer to the J2000 coordinate system of the HST image, which has an absolute accuracy with respect to the ICRS system of ″. In Fig. 10, we compare the relative positions of the NC and the KC as well as the PC and the KC for the non-nucleated galaxies.
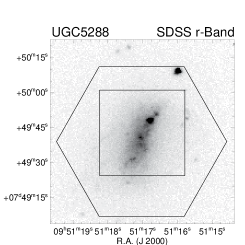
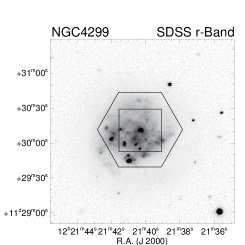
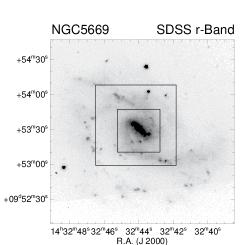
Generally, we find that there are only a few galaxies (6 out of 20) with a velocity field regular enough (trust level 2 in Table 4) to meaningfully compare the locations of NC, PC and KC. For all of these galaxies these locations agree within the uncertainties, although some of the galaxies show bars. On the other hand, for all but one galaxy with offset KC we can always identify a reason. NGC 2552, NGC 4299, NGC 5789, have a very fuzzy or patchy appearance in H and in stellar emission. These galaxies may simply not be in regular rotation. UGC 5288, NGC 4204, NGC 4496, NGC 5669, NGC 5964, NGC 6509 show a strong bar and the velocity field is clearly affected by large scale streaming motions along the bar. NGC 4625 is lopsided from a strong m=1 mode, which seems to displace the KC. There are only two potentially odd cases: in NGC4517 there is a large offset between KC and NC. However, this galaxy probably has a nuclear starburst (see H map) that affects the central part of the velocity field, although a possible bar is weak if existent. UGC 3574 looks very regular, yet NC and KC show an offset of the size of the 1 error bar. However, in this galaxy the central unfortunately do not show H emission, which might hamper our ability to determine an accurate KC. We are left with no confirmed offset between the NC and the KC.
3.4 Rotation curves and velocity residuals
Rotation curves of our sample galaxies are shown in Figure 9. As mentioned in Section 3.1 we find that the functional form given in Eq. 1 represents the rotation curves of latest type spirals well in general. To quantify this statement in terms of the scientific goal of our paper we have used the rotation curves of our best models (trust level 2 in Table 4) and our bad models (trust level 0). There is no obvious trend with nucleatedness (4 out of 6 well-fit galaxies are nucleated and 1 out of 3 not-well-fit galaxies).
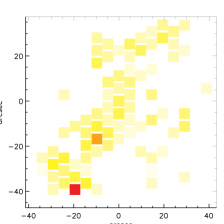
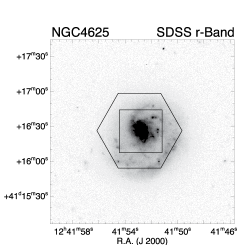
Those rotation curves which are least consistent with the arctan functional form are dominated by irregularities of their host galaxies. The irregular rotation curve of NGC 4625 can be explained by an ongoing interaction, while NGC 5964 is strongly barred, and UGC 4499 has a very sparsely sampled velocity field.
The rotation curve shapes of late type galaxies have also been discussed in Swaters et al. (2009) from HI data. The morphological variety of their rotation curves is similar to ours.
3.5 Dynamical Friction Timescales
Based on Chandrasekhar’s formula we calculate the dynamical friction timescales for star clusters in our galaxies using equation 8.12 of Binney & Tremaine (2008):
| (2) |
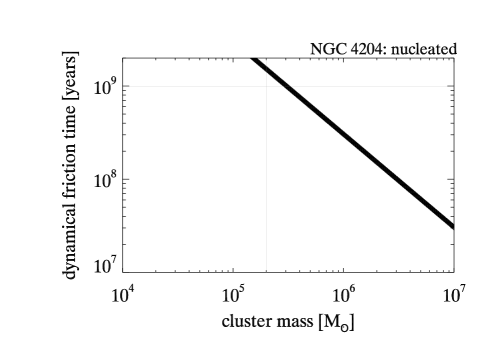
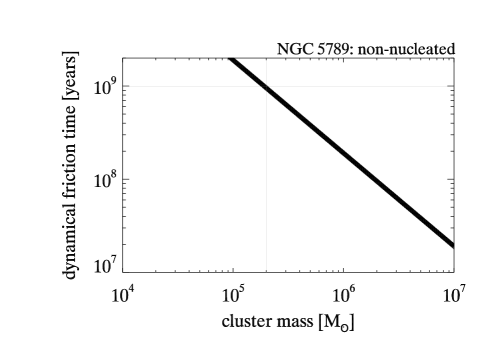
where is the Coulomb logarithm, the typical velocity of the stars in the galaxy at radius ri, and is the mass of the test particle that is going through the much larger mass of the underlying galaxy. Although Binney & Tremaine (2008) derived Eq. 2 for the decay of black hole orbits in a singular isothermal sphere, they explicitly state that it is approximately correct even for mass distributions other than the singular isothermal sphere (given that the mass ratio of the subject body to the interior mass of the host ). For point like particles, , while for extended bodies the Coulomb logarithm is obtained from N-body simulations, that give values of (Spinnato et al., 2003; Peñarrubia et al., 2004). The calculation of tfric requires the typical stellar velocity, while we are actually measuring the velocity fields of the ionised gas. The circular velocity of the stars in the central region of disk galaxies will be 1.5-2 times slower than the ionized gas (Ganda et al. 2006) due to asymmetric drift. We scale our measured velocity values to take that into account.
We calculate the dynamical friction timescale for clusters (taken to be point-like test particles) of masses between and , that start at an initial distance of pc to the center. We find that typically clusters with masses above will make it to the dynamical center within years (see Figure 11). These findings are in very good agreement with the recent study by Bekki (2010), who performed numerical simulations on dynamical evolution of disk galaxies and investigated the orbital evolution of star clusters influenced by dynamical friction against disk field stars. Bekki (2010) finds that dynamical friction of star clusters against disk field stars is much more effective in orbital decay of star clusters in comparison with that against galactic halos in disk galaxies. Moreover, dynamical friction seems to be most effective in disks with disk masses lower than owing to smaller stellar velocity dispersions. Milosavljević (2004) argued that dynamical friction timescales are too long to bring massive clusters to the centers of late-type spiral galaxies. However, recently Agarwal & Milosavljevic (2010) pointed out that Milosavljević (2004) only considered migration from a distant location in the disk, and indeed clusters that form close to the galactic center can reach the center and merge with the nuclear cluster.
4 Discussion
The main goal of this paper is to verify whether the NC and the KC in late-type, bulgeless galaxies always coincide and whether the presence or mass of a NC is related to the kinematic state of its host galaxy. As discussed in Section 3, we indeed find that for galaxies with high fidelity velocity fields, the NC, the KC and the PC coincide within the errors. A similar result was obtained by Trachternach et al. (2008) who conclude, based on HI rotation curves, that there are no systematic offsets between optical and kinematic centers.
However, Trachternach et al. (2008) also conclude that, based on HI observations, non-circular motions are small, especially in late Hubble types. As has become evident, this is not the case for velocity fields with higher spatial resolution and derived from the ionized gas.
Our derived velocity fields compare well with literature results. For example, Ganda et al. (2006) have published H velocity fields for NGC 3346 and NGC 3423. While they did not perform kinematical modeling of their data, i.e. did not publish rotation curves or the KC location, the general shape and orientation of their velocity fields agrees well with those published here.
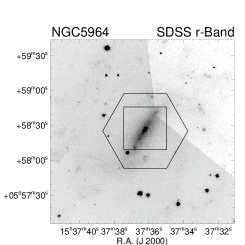
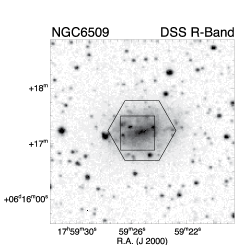
Two of our galaxies, NGC 5964 and NGC 6509, are also part of the recent HI study of bulgeless spirals by Watson et al. (2010). Comparing our H velocity fields to their HI data, we find that the position angles and velocity scales are in good agreement between atomic and ionised hydrogen. The advantage of the HI maps is their large field of view, which covers the entire galaxy and thus the complete rotation curve. Our H velocity fields cover a good fraction of the rotation curves, but for some galaxies we are restricted to the central part of the velocity gradient and do miss the turnover of the velocity curve, like in the case of NGC 5964. This results in large error bars on the location of the KC. We compare the KC position derived from HI (Watson et al., 2010) and H and find good agreement in the case of NGC 6509 but for NGC 5964 the offset is larger than the measurement error. This is reflected in the fact that the best fit to the velocity field of NGC 5964 appears unreliable.
We have used our measurements to derive realistic dynamical friction timescales for all sample galaxies (see Section 3.5). We find that the threshold mass for a star cluster to be able to migrate to the center efficiently from a realistic distance (pc) is (in very good agreement with the numerical simulations by Bekki (2010)). This is indeed the observed lower mass threshold for NCs. Böker et al. (2002) find that there is a lower luminosity cut-off to the NC luminosity function at M. For a known M/L this would imply a lower limit mass cut-off for NCs. Walcher et al. (2005) published dynamically determined M/L ratios for a sample of nine NCs with a mean of M/LI = 0.6. This would translate into an observed lower mass limit for NCs of .
We thus find that our data are entirely consistent with a NC formation scenario in which a massive seed cluster forms within pc from the center of the galaxy, and spirals in to the center due to dynamical friction. This scenario has the advantage of automatically accounting for galaxies without a nuclear star cluster, implying merely that no suitable seed clusters formed close enough to the center in these disks. We also note that this lower mass threshold is one order of magnitude lower than the threshold mass of derived by Pflamm-Altenburg & Kroupa (2009) for efficient accretion of gas into the NC, which would lead to repetitive bursts of star formation there. Therefore, it may be that further NC growth through in-situ star formation starts out quite slowly, but picks up in pace as the NC grows. Mass growth may be further supported by accretion of other massive inspiralling clusters. Soon after its formation the seed cluster would then satisfy our definition and observations of a nuclear star cluster, namely being massive, sitting close to the center, having undergone recurrent star formation, and being compact. This formation and growth mechanism is also supported by the fact that NCs are observed to rotate (Seth et al., 2008, 2010).
The long dynamical friction timescales we infer for massive star clusters that are initially located at significant ( kpc) distances from the galaxy center do not favour models where the NC grows only through accretion of globular clusters. We emphasize on the other hand that we have not found a confirmed case where the NC sits outside of the KC. We thus cannot rule out in-situ formation scenarios for NCs from our data.
5 Conclusions
We have presented two-dimensional H velocity fields for 20 late-type, disk-dominated spiral galaxies, the largest sample of bulgeless disks with high-resolution H velocity fields to date.
We fitted the data with kinematic models in order to derive rotation curves and the location of the dynamical centers. Most rotation curves are well-fit by the arctan form of Courteau (1997) used for earlier-type spirals. We find that the velocity fields span a broad range of morphologies. Some galaxies show regular rotation, which allows accurate determination of the kinematic center. However, only 2 out of 20 galaxies have a completely regular velocity field. Many galaxies without bulges, but with strong bars show steep rises of their ”velocity gradients” (”rotation curves”) in the inner part. These steep rises are not necessarily due to mass concentrations, but to streaming motions along the bar. However, quite a few have some degree of irregular gas motion, which in nearly all cases can be either attributed to the presence of a bar or is connected to a rather patchy appearance of the H emission and the stellar light. Thus most galaxies in the sample show strong gas motions that cannot be attributed to the overall gravitational potential of the galaxy, implying low surface mass densities (compare Dalcanton & Stilp, 2010) and implying that many bulgeless galaxies are not in dynamical equilibrium.
There appears to be no systematic difference in the kinematics of nucleated and non-nucleated disks. For galaxies with regular, well-sampled velocity fields, the photometric center, the nuclear cluster and the kinematic center coincide within the errors. These centers also coincide for quite a few of the not-so-regular galaxies (in total for 13 out of our sample of 20 galaxies). However, we also find that nuclear clusters also occur in galaxies with disordered rotation fields. Hence, the large-scale velocity field is not a good predictor for the presence or mass of a nuclear cluster. Many formation scenarios for nuclear clusters invoke off-center cluster formation and subsequent “sinking” of clusters due to dynamical friction. We confirm that this scenario is viable for clusters that form within pc of the center of the galaxy, as the dynamical friction timescales inferred from our data are consistent with this scenario. More distant globular clusters do not seem to be promising candidates for nuclear cluster seeds, due to their long dynamical friction timescales. On the other hand, we point out that we cannot rule out an in-situ formation scenario.
Acknowledgments
The authors thank the referee for a constructive report. We thank the MPIA for hospitality and support during a very productive visit. NN acknowledges the financial support of ESA through the ESTEC visitor program, where part of this work has been performed, and G. and M. Häring, who made this visit possible. NN acknowledges support by the DFG cluster of excellence ‘Origin and Structure of the Universe’. This research has made use of the NASA/IPAC Extragalactic Database (NED) which is operated by the Jet Propulsion Laboratory, California Institute of Technology, under contract with the National Aeronautics and Space Administration. We acknowledge the usage of the HyperLeda database (http://leda.univ-lyon1.fr). This research has made use of NASA’s Astrophysics Data System Bibliographic Services, as well as of IPAC’s Skyview Image Display and Analysis Program, developed with support from the National Aeronautics and Space Administration.
References
- Agarwal & Milosavljevic (2010) Agarwal M., Milosavljevic M., 2010, arXiv:1008.2986
- Andersen et al. (2006) Andersen D. R., Bershady M. A., Sparke L. S., Gallagher III J. S., Wilcots E. M., van Driel W., Monnier-Ragaigne D., 2006, ApJS, 166, 505
- Andersen et al. (2008) Andersen D. R., Walcher C. J., Böker T., Ho L. C., van der Marel R. P., Rix H.-W., Shields J. C., 2008, The Astrophysical Journal, 688, 990
- Balcells et al. (2003) Balcells M., Graham A. W., Domínguez-Palmero L., Peletier R. F., 2003, ApJ, 582, L79
- Bekki (2007) Bekki K., 2007, Publ. Astron. Soc. Aust., 24, 77
- Bekki (2010) Bekki K., 2010, MNRAS, 401, 2753
- Bershady et al. (2004) Bershady M. A., Andersen D. R., Harker J., Ramsey L. W., Verheijen M. A. W., 2004, PASP, 116, 565
- Bershady et al. (2005) Bershady M. A., Andersen D. R., Verheijen M. A. W., Westfall K. B., Crawford S. M., Swaters R. A., 2005, ApJS, 156, 311
- Bershady et al. (2010) Bershady M. A., Verheijen M. A. W., Swaters R. A., Andersen D. R., Westfall K. B., Martinsson T., 2010, ApJ, 716, 198
- Binney & Tremaine (2008) Binney J., Tremaine S., 2008, Galactic Dynamics: Second Edition. Princeton University Press
- Böker et al. (2002) Böker T., Laine S., van der Marel R. P., Sarzi M., Rix H.-W., Ho L. C., Shields J. C., 2002, The Astronomical Journal, 123, 1389
- Böker et al. (2004) Böker T., Sarzi M., McLaughlin D. E., van der Marel R. P., Rix H.-W., Ho L. C., Shields J. C., 2004, The Astronomical Journal, 127, 105
- Capuzzo-Dolcetta & Miocchi (2008) Capuzzo-Dolcetta R., Miocchi P., 2008, MNRAS, 388, L69
- Carollo et al. (1998) Carollo C. M., Stiavelli M., Mack J., 1998, The Astronomical Journal, 116, 68
- Côté et al. (2006) Côté P., Piatek S., Ferrarese L., Jordán A., Merritt D., Peng E. W., Haşegan M., Blakeslee J. P., Mei S., West M. J., Milosavljević M., Tonry J. L., 2006, ApJS, 165, 57
- Courteau (1997) Courteau S., 1997, AJ, 114, 2402
- Dalcanton & Stilp (2010) Dalcanton J. J., Stilp A. M., 2010, ApJ, 721, 547
- de Vaucouleurs et al. (1991) de Vaucouleurs G., de Vaucouleurs A., Corwin Jr. H. G., Buta R. J., Paturel G., Fouque P., 1991, Third Reference Catalogue of Bright Galaxies. Springer-Verlag Berlin Heidelberg New York
- Ferrarese & Merritt (2000) Ferrarese L., Merritt D., 2000, The Astrophysical Journal, 539, L9
- Ganda et al. (2006) Ganda K., Falcón-Barroso J., Peletier R. F., Cappellari M., Emsellem E., McDermid R. M., de Zeeuw P. T., Carollo C. M., 2006, MNRAS, 367, 46
- Gebhardt et al. (2000) Gebhardt K., Bender R., Bower G., Dressler A., Faber S. M., Filippenko A. V., Green R., Grillmair C., Ho L. C., Kormendy J., Lauer T. R., Magorrian J., Pinkney J., Richstone D., Tremaine S., 2000, The Astrophysical Journal, 539, L13
- Georgiev et al. (2009) Georgiev I. Y., Hilker M., Puzia T. H., Goudfrooij P., Baumgardt H., 2009, MNRAS, 396, 1075
- Häring & Rix (2004) Häring N., Rix H.-W., 2004, The Astrophysical Journal, 604, L89
- Kamphuis & Sancisi (1993) Kamphuis J., Sancisi R., 1993, A&A, 273, L31+
- Kelz et al. (2006) Kelz A., Verheijen M. A. W., Roth M. M., Bauer S. M., Becker T., Paschke J., Popow E., Sánchez S. F., Laux U., 2006, PASP, 118, 129
- Lotz et al. (2004) Lotz J. M., Miller B. W., Ferguson H. C., 2004, ApJ, 613, 262
- Marconi & Hunt (2003) Marconi A., Hunt L. K., 2003, ApJ, 589, L21
- Matthews & Gallagher (2002) Matthews L. D., Gallagher III J. S., 2002, ApJS, 141, 429
- Matthews et al. (1999) Matthews L. D., Gallagher III J. S., Krist J. E., Watson A. M., Burrows C. J., Griffiths R. E., Hester J. J., Trauger J. T., Ballester G. E., 1999, AJ, 118, 208
- Milosavljević (2004) Milosavljević M., 2004, The Astrophysical Journal, 605, L13
- Mould et al. (2000) Mould J. R., Huchra J. P., Freedman W. L., Kennicutt Jr. R. C., Ferrarese L., Ford H. C., Gibson B. K., Graham J. A., Hughes S. M. G., Illingworth G. D., Kelson D. D., Macri L. M., Madore B. F., Sakai S., Sebo K. M., Silbermann N. A., Stetson P. B., 2000, ApJ, 529, 786
- Paturel et al. (2003) Paturel G., Petit C., Prugniel P., Theureau G., Rousseau J., Brouty M., Dubois P., Cambrésy L., 2003, A&A, 412, 45
- Peñarrubia et al. (2004) Peñarrubia J., Just A., Kroupa P., 2004, MNRAS, 349, 747
- Pflamm-Altenburg & Kroupa (2009) Pflamm-Altenburg J., Kroupa P., 2009, Monthly Notices of the Royal Astronomical Society, 397, 488
- Phillips et al. (1996) Phillips A. C., Illingworth G. D., MacKenty J. W., Franx M., 1996, AJ, 111, 1566
- Rossa et al. (2006) Rossa J., van der Marel R. P., Böker T., Gerssen J., Ho L. C., Rix H.-W., Shields J. C., Walcher C.-J., 2006, The Astronomical Journal, 132, 1074
- Roth et al. (2005) Roth M. M., Kelz A., Fechner T., Hahn T., Bauer S., Becker T., Böhm P., Christensen L., Dionies F., Paschke J., Popow E., Wolter D., Schmoll J., Laux U., Altmann W., 2005, PASP, 117, 620
- Sánchez (2004) Sánchez S. F., 2004, Astronomische Nachrichten, 325, 167
- Sánchez (2006) Sánchez S. F., 2006, Astronomische Nachrichten, 327, 850
- Satyapal et al. (2009) Satyapal S., Böker T., Mcalpine W., Gliozzi M., Abel N. P., Heckman T., 2009, ApJ, 704, 439
- Sellwood & Sánchez (2010) Sellwood J. A., Sánchez R. Z., 2010, MNRAS, 404, 1733
- Seth et al. (2008) Seth A. C., Blum R. D., Bastian N., Caldwell N., Debattista V. P., 2008, ApJ, 687, 997
- Seth et al. (2010) Seth A. C., Cappellari M., Neumayer N., Caldwell N., Bastian N., Olsen K., Blum R. D., Debattista V. P., McDermid R., Puzia T., Stephens A., 2010, ApJ, 714, 713
- Seth et al. (2006) Seth A. C., Dalcanton J. J., Hodge P. W., Debattista V. P., 2006, The Astronomical Journal, 132, 2539
- Spinnato et al. (2003) Spinnato P. F., Fellhauer M., Portegies Zwart S. F., 2003, MNRAS, 344, 22
- Swaters et al. (2009) Swaters R. A., Sancisi R., van Albada T. S., van der Hulst J. M., 2009, A&A, 493, 871
- Trachternach et al. (2008) Trachternach C., de Blok W. J. G., Walter F., Brinks E., Kennicutt R. C., 2008, AJ, 136, 2720
- Walcher et al. (2006) Walcher C. J., Böker T., Charlot S., Ho L. C., Rix H.-W., Rossa J., Shields J. C., van der Marel R. P., 2006, The Astrophysical Journal, 649, 692
- Walcher et al. (2005) Walcher C. J., van der Marel R. P., McLaughlin D., Rix H.-W., Böker T., Häring N., Ho L. C., Sarzi M., Shields J. C., 2005, The Astrophysical Journal, 618, 237
- Watson et al. (2010) Watson L. C., Schinnerer E., Martini P., Boeker T., Lisenfeld U., 2010, arXiv:1010.2497