Spitzer 24 m Survey for Dust Disks around Hot White Dwarfs
Abstract
Two types of dust disks around white dwarfs (WDs) have been reported: small dust disks around cool metal-rich WDs consisting of tidally disrupted asteroids, and a large dust disk around the hot central WD of the Helix planetary nebula (PN) possibly produced by collisions among Kuiper Belt-like objects. To search for more dust disks of the latter type, we have conducted a Spitzer MIPS 24 m survey of 71 hot WDs or pre-WDs, among which 35 are central stars of PNe (CSPNs). Nine of these evolved stars are detected and their 24 m flux densities are at least two orders of magnitude higher than their expected photospheric emission. Considering the bias against detection of distant objects, the 24 m detection rate for the sample is 15%. It is striking that seven, or 20%, of the WD and pre-WDs in known PNe exhibit 24 m excesses, while two, or 5–6%, of the WDs not in PNe show 24 m excesses and they have the lowest 24 m flux densities. We have obtained follow-up Spitzer IRS spectra for five objects. Four show clear continuum emission at 24 m, and one is overwhelmed by a bright neighboring star but still show a hint of continuum emission. In the cases of WD 0950+139 and CSPN K 1-22, a late-type companion is present, making it difficult to determine whether the excess 24 m emission is associated with the WD or its red companion. High-resolution images in the mid-IR are needed to establish unambiguously the stars responsible for the 24 m excesses.
1 Introduction
The Spitzer Space Telescope (Werner et al., 2004), with its superb sensitivity and resolution at infrared (IR) wavelengths, provides an excellent opportunity to study planetary debris disks around stars (Su et al., 2006; Trilling et al., 2008; Carpenter et al., 2009). For instance, a comprehensive Spitzer 24 m survey of main-sequence A-type stars has shown that up to 50% of young (30 Myr) stars have little or no 24 m excess emission from debris disks, large debris-disk excesses decrease significantly at ages of 150 Myr, and much of the dust detected may be generated episodically by collisions of large planetesimals (Rieke et al., 2005). The dust in these debris disks would have dissipated long before the stars evolve off the main sequence.
Dust can be replenished during late evolutionary stages. As a low- or intermediate-mass star loses a significant fraction of its initial mass to become a white dwarf (WD), its planetary system expands. Sub-planetary objects, such as asteroids and comets, can be injected to very small radii and be tidally pulverized by the WD, while orbital resonances with giant planets can raise the collision rates among sub-planetary objects and generate dust (Debes & Sigurdsson, 2002). This freshly produced dust can be detected through IR excesses and allows us to peer into the late evolution of planetary systems.
The first two WDs reported to possess dust disks were G29-38 and GD 362, both exhibiting near-IR excesses that were confirmed spectroscopically to be dust continuum emission (Zuckerman & Becklin, 1987; Becklin et al., 2005; Kilic et al., 2005; Reach et al., 2005). A subsequent Spitzer survey of 124 WDs at 4.5 and 8.0 m found one additional dust disk, around WD 2115560 (Mullally et al., 2007; von Hippel et al., 2007). As G29-38, GD 362, and WD 2115560 are WDs with photospheric absorption lines of heavy elements, searches for dust disks have been conducted for DAZ and DBZ WDs, and indeed many more dust disks were discovered. For example, a near-IR spectroscopic survey of 20 DAZ WDs found a dust disk around GD 56 (Kilic et al., 2006), the presence of a dust disk around the DAZ WD 1150153 was diagnosed by -band excess and confirmed spectroscopically (Kilic & Redfield, 2007), and Spitzer photometric observations of 9 DAZ/DBZ WDs revealed dust disks around GD 40, GD 133, and PG 1015+161 (Jura et al., 2007). One common characteristic of these dust disks around DAZ/DBZ WDs is that they are all small, with outer radii 0.01 AU. As the dust disks are completely within the Roche limits of the WDs and the dust mass is estimated to be only 1018 g, it is suggested that tidally disrupted asteroids produce the dust disks and that the accretion of this dust enriches refractory metals, such as Ca, Mg, Fe, and Ti, in the WD atmospheres (Jura, 2003; Jura et al., 2007; Zuckerman et al., 2007). To date, 20 dust disks around DAZ/DBZ WDs have been reported, all consistent with this suggested origin of tidal disruption of asteroids (Farihi et al., 2010). More dust disks of this type are being found from the Wide-Field Infrared Survey Explorer observations of WDs (e.g., Debes et al., 2011).
An entirely different kind of dust disk has been discovered around the central WD of the Helix planetary nebula (PN), WD 2226210 (Su et al., 2007). Spitzer observations of the Helix Nebula show a bright compact source coincident with the central WD in the 24 and 70 m bands, and follow-up Infrared Spectrograph (IRS; Houck et al., 2004) observations have verified that the mid-IR emission originates from a dust continuum. The spectral energy distribution (SED) of this IR-emitter indicates a blackbody temperature of 90-130 K, and its luminosity, 5-111031 ergs s-1, requires an emitting area of 3.8-38 AU2. These properties can only be explained by the presence of a dust cloud; furthermore, little extinction exists toward the WD, so the dust cloud must be flattened with a disk geometry. Adopting a stellar effective temperature of 110,000 K for WD 2226210 (Napiwotzki, 1999) and assuming astronomical silicates with a power-law size distribution and a maximum grain radius of 1000 m for the dust grains, models of the SED indicate that the dust disk extends between 35 and 150 AU from the WD and has a mass of 0.13 . Since this dust must have been generated recently and since the radial location of the dust disk corresponds to that of the Kuiper Belt in the Solar System, Su et al. (2007) suggest that the dust disk around WD 2226210 was produced by collisions of Kuiper Belt-like objects (KBOs) or the break-up of comets.
To simulate the dust disk of WD 2226210, the dynamic evolution of a debris disk around a 3 star has been modeled from the main sequence (corresponding to A0 V) to the WD stage, and it is found that collisions among KBOs may produce the amount of dust observed (Bonsor & Wyatt, 2010; Dong et al., 2010). If the dusk disk around the Helix central star is indeed produced by collisions of KBOs, similar dust disks should be found around other WDs and a survey would allow us to assess their frequency of occurrence and physical properties. These results can then be compared with models of debris disks evolution (Bonsor & Wyatt, 2010; Dong et al., 2010) for implications on their planetary systems.
To search for dust disks similar to that around the central WD of the Helix Nebula, we have conducted three surveys using Spitzer observations: (1) 24 m survey of hot WDs and pre-WDs (this paper), (2) archival survey of IR excesses of WDs (Chu et al., 2011; Riddle et al., 2011), and (3) archival survey of IR excesses of central stars of PNe (CSPNs; Bilikova et al., 2011a). The combined results from these three surveys will provide a comprehensive picture of post-main sequence dust production and dynamic evolution of debris disks. This paper reports the results of the Spitzer 24 m survey of hot WDs as well as follow-up spectroscopic and imaging observations for a subset of hot WDs with 24 m excesses. Section 2 describes the target selection and observations, Section 3 reports the results, and Section 4 discusses the implications. A summary is given in Section 5.
2 Observations and Data Reduction
The large dust disk around the central WD of the Helix Nebula is detectable at 24 m because WD 2226210 has a high temperature and thus high luminosity. Stellar luminosity is a steeper function of temperature than of radius, and WDs span a small range of radii; furthermore, stellar effective temperatures are more readily available in the literature than distances and luminosities. Therefore, we use stellar effective temperature as our main target selection criterion and selected targets from two sources for our 24 m survey. First, we use the web version of the McCook & Sion (1999) WD Catalog to search for WDs whose spectral classifications indicate temperatures near or higher than 100,000 K; 58 such hot WDs are found. Hot WDs are the youngest WDs and often surrounded by evolved PNe; 22 of the 58 WDs selected are in known PNe. To probe whether dust disks are present around pre-WDs, we have selected 14 hot CSPNs (Napiwotzki, 1999) whose effective temperatures are 100,000 K but whose surface gravity is not yet high enough to be classified as WDs. Although pre-WDs evolve along tracks of almost constant luminosities in the HR diagram, we do not select CSPNs with lower effective temperatures as they are usually surrounded by smaller and brighter PNe, making it difficult to obtain accurate photometric measurements of the CSPNs. These 58 WDs and 14 pre-WDs form the target list of our Spitzer 24 m survey for dust disks.
Among the 72 targets, “WD 0123842” was a misnomer from wrong coordinates, and has been removed from the web version of the McCook & Sion WD Catalog (E. Sion, personal communication); thus, this spurious object will not be discussed further in this paper. The 71 valid targets are listed in Table 1. The coordinates in columns 2-3 are measured from the Digitized Sky Survey 2 (DSS2), and in many cases represent an improved accuracy when compared with those given by McCook & Sion or SIMBAD. Unless noted, the effective temperatures () in column 4 are taken from Napiwotzki (1999) or converted from the spectral classification in column 5 taken from McCook & Sion’s WD catalog. The common name and PNG number of associated PNe are given in columns 6-7.
The Spitzer observations reported in this paper were obtained from three programs. The main program is our 24 m survey of the hot WDs or pre-WDs (Program 40953) using the Multiband Imaging Photometer for Spitzer (MIPS; Rieke et al., 2004). To assess the nature of hot WDs’ 24 m excesses, we have further obtained Spitzer IRS, Infrared Array Camera (IRAC; Fazio et al., 2004), and MIPS 70 m observations (Program 50629). As the MIPS 24 m survey was not completed before the proposal deadline for Spitzer Cycle 5, the last cryogenic cycle of the Spitzer mission, IRS and MIPS 70 m observations were obtained for only a subset of hot WDs with 24 m excesses: CSPN K 1-22, WD 0103+732 (CSPN EGB 1), WD 0127+581 (CSPN Sh 2-188), and WD 0439+466 (CSPN Sh 2-216). Among these four targets, archival IRAC observations are available for WD 0439+466; we have thus obtained new IRAC observations for only the other three. Finally, we have obtained a MIPS 70 m observation of KPD 0005+5106 (= WD 0005+511) through a Chandra X-ray Observatory observing program (GO8-9026). This MIPS observation was merged with our Spitzer Program 40953 for convenience.
2.1 MIPS Observations
2.1.1 MIPS 24 m Observations
In the MIPS 24 m survey of hot WDs, each of the 71 objects in Table 1 was imaged using the small-field photometry mode which obtained a sequence of 14 dithered exposures in a preset pattern (see the Spitzer Space Telescope Observer’s Manual for more details). The observations used an exposure time of 10 s and cycled through the pattern 3 times, yielding a total exposure time of 420 s in the central 3232 region. In a typical median background condition, the depth of the survey will reach a 1- point-source sensitivity of 33.6 Jy. The raw data were processed using the Data Analysis Tool (DAT; Gordon et al., 2005) for basic reduction (e.g., dark subtraction and flat fielding). All individual exposures were first corrected with a scan-mirror-dependent flat to correct for the dark spots due to particulate matter on the pick-off mirror. For targets that have no large-scale extended emission (from either the surrounding PNe or the background Galactic cirrus), a second flat field generated from the data itself was applied to correct the possible dark latency and scattered light gradient in order to enhance photometric sensitivity. Details of these processing procedures can be found in Engelbracht et al. (2007). The final mosaics were then constructed with a pixel size of 1245 (half the size of the physical pixel) for photometry measurements. The calibration factor 4.5410-2 MJy sr-1 (DN s-1)-1 was used to convert the instrumental unit to physical units (Engelbracht et al., 2007).
All final mosaics were astrometrically calibrated by comparisons with the Two Micron All Sky Survey (2MASS; Skrutskie et al., 2006) sources in the field to establish the World Coordinate System (WCS), the accuracy of which is generally better than 1″. We first performed source extraction using StarFinder (Diolaiti et al., 2000) with a smoothed theoretical point spread function (PSF) generated by the STinyTim program (Krist 2006). We consider the WD detected if the extracted source position is within 15 from the given WD position. In other words, this method ensures a point-source-like object is required to be coincident with the given WD position. For sources that are not detected, we estimate their “observed” point source flux by fixing the PSF at the given WD position on the PSF-subtracted (source-free) image and using the minimum technique. In some cases where the nebular emission is bright, this PSF flux is totally dominated by the background (e.g., CSPN IC 289, CSPN MeWe 1-3, and WD 1958+015 in NGC 6852). These PSF fluxes (non-color corrected) are listed in column 3 of Table 2.
We have estimated the 1- point source sensitivity of the observation using the pixel-to-pixel variation inside a radius of 44″ centered at the source position on the source-free image (i.e., the systematic background noise). The final photometry error includes (1) the systematic error of the observation, estimated from pixel-to-pixel variations; (2) 24 m detector repeatability, 1% of the measured flux; and (3) 24 m confusion noise, 15 Jy, a median value estimated from the extragalactic source counts (Dole et al., 2004). These error contributions are summed in quadrature and listed in column 4 of Table 2 as “uncertainty”. This “uncertainty” has no direct relationship to the detectability of the source. It simply reflects the photometric accuracy if a point source was coincident with the given WD position. For non-detections, we also list 3- upper limits in column 5 of Table 2, computed as the three times of the uncertainty plus the PSF flux. In most cases, these 3- upper limits are totally dominant by the surrounding bright nebular emission as remarked in column 8 in Table 2.
For detected sources, we have also carried out aperture photometry using a source aperture of 6225 radius, a sky annulus of radii 1992 – 2988, and an aperture correction of 1.7. These results are compared with those determined from the PSF-fitting method. When the two measurements for a source are discrepant, we examine the field for nearby objects or background structures that might compromise the photometry, and adopt the measurement that is less compromised. The aperture photometry result is adopted for WD 0439+466, and the PSF-fitting results are adopted for the other eight cases of detections. When IRS observations are available, we use the background-subtracted flux densities near 24 m to further constrain the MIPS 24 m photometric measurements.
2.1.2 MIPS 70 m Observations
Four targets were included in the MIPS 70 m observations as part of our Program 50629. The three original targets, CSPN K 1-22, WD 0103732, and WD 0439466, were observed in the photometry raster map mode with 31 maps in the array column and row direction and a step size of 1/8 array. This yields a uniformly covered area within a diameter of 32 centered at the target. Each map was repeated 4 times (cycles) with 10 s integration per frame, resulting in a total effective integration of 960 s. WD 0005+511 was a target from the Chandra program GO8-9026. Its 70 m observations were made in the default photometry mode, with 10 s integration per frame and three cycles, and the total integration time was 240 s.
The basic reduction (dark subtraction, illumination correction) of the 70 m data was processed using DAT, similar to that of the 24 m data. The known transient behavior in the 70 m array was removed by masking out the sources in the field of view and time filtering the data (Gordon et al., 2007). For the objects in PNe with extended nebulosity seen at 70 m, the size of the masked area was adjusted to cover most of the nebulosity accordingly. The final mosaics were combined using the WCS with a subpixel size of 493. Figure 1 shows the 70 m images alongside the 24 m images of K 1-22, WD 0103+732, and WD 0439+466.
The 70 m image of WD 0103+732 shows bright extended emission with a central peak at the expected WD position. The diffuse emission at 70 m, appearing more extended than that in the 24 m band, is most likely dominated by bright emission lines such as the [O III] 88 m line. To minimize the nebular contamination, we performed aperture photometry with a very small (16″) aperture and sky annulus of 18″–39″. We have also used PSF fitting to estimate the source brightness. Both methods give a point source flux of 55 mJy. The pixel-to-pixel variations in the data suggest 1- point source sensitivity of 8.4 mJy.
WD 0439+466 is coincident with a very faint 70 m source. The source is superposed on diffuse emission, similar to the case of WD 0103+732. Using the same approach as for WD 0103+732, we estimate the source to have a 70 m flux density of 9.08.4 mJy.
Unlike the above two WDs, CSPN K 1-22 has no obvious source coincident with the WD. The data were very noisy, probably due to many foreground and background sources (evident at 24 m as well). The estimated 1- point source sensitivity is 4 mJy. WD 0005+511 is not detected at 70 m, either; its 1- sensitivity is 5.4 mJy.
2.2 IRAC observations
IRAC observations of three targets, CSPN K 1-22, WD 0103732, and WD 0127581 were obtained at 3.6, 4.5, 5.8 and 8.0 m in our Program 50629. These observations all used a 30 s frame time and a cyclic dither pattern with medium offsets to obtain 5 frames for a total integration time of 150 s for each target. The basic calibrated data (BCD) frames from these observations were reduced using standard routines within the MOPEX package.
We have measured flux densities in each of the IRAC bands using the IRAF task phot to perform aperture photometry. These measurements used a 36 radius source aperture with a background estimated from the surrounding annulus of radii 36 to 84. An aperture correction based on the results tabulated in the IRAC Data Handbook (ver 3.0) was then applied to obtain the flux densities reported in Table 3.
Archival IRAC observations are available for WD 0439+466 (Program 30432; PI: Burleigh), WD 0726+133 (Program 30285; PI: Fazio), and the CSPN NGC 2438 (Program 68; PI: Fazio). These archival data were downloaded and reduced in the same manner as our own observations. Their flux densities are also reported in Table 3.
2.3 IRS Observations
We have also obtained follow-up IRS observations for CSPN K 1-22, WD 0103+732, WD 0127+581, and WD 0439+466 in our Program 50629. All sources were observed using the low-resolution modules SL1 (7.4–14.5 m), SL2 (5.2–7.7 m), LL1 (19.5–38.0 m), and LL2 (14.0–21.3 m). See Houck et al. (2004) for a more detailed description of the IRS and its capabilities. CSPN K 1-22 and WD 0103+732 were observed in the IRS staring mode after a peakup on a nearby source. WD 0127+581, the faintest target, was observed in mapping mode where the target was sequentially stepped along the slit to facilitate an improved background subtraction. The SL1 and SL2 observations of WD 0127+581 used 8 pointings spaced by 3″ while the LL1 and LL2 observations used 12 pointings spaced by 6″. The MIPS 24 m observations of WD 0439+466 showed diffuse emission around the WD, thus the IRS observations of WD 0439+466 were made in the mapping mode to obtain spectra of the WD and the diffuse emission by taking spectra from a series of dense slit positions centered on the WD and sequentially offset in the direction perpendicular to the slit. Specifically, the SL1 and SL2 maps were comprised of 9 pointings spaced by 36 while the LL1 and LL2 maps are comprised of 5 pointings spaced by 106. We summarize the modules, exposure times, and setups used in Table 4.
All spectra were reduced using the CUBISM software (Smith et al., 2007) with the latest pipeline processing of the data and the most recent calibration set (irs_2009_05_20-pb-pfc-trim-omeg-lhllbiasfork.cal). Each low-resolution module contains two subslits that are exposed at the same time, e.g., SL1 on-source and SL2 off-source, and vice versa. We examine the off-source frames, select the ones free of any source contamination, trim the maxima and minima, and use the average to produce a background frame. This 2D background frame is then subtracted from all on-source frames in the corresponding module to remove astrophysical background and to alleviate the bad pixels that contaminate the IRS data. After the 2D background subtraction, we flag the global and record-level bad pixels first using the default CUBISM parameters for automatic bad pixel detection, and then through manual inspection of each BCD record, as well as by backtracking the pixels contributing to a given cube pixel.
The spectra are extracted with aperture sizes large enough to enclose the 24 m source. See Table 5 for the aperture sizes used for the spectral extractions. For the LL orders, two local background spectra on either side of the source are extracted and averaged for a 1D subtraction of the local background. For the SL orders, a single background spectrum is used for the local 1D background subtraction.
Special notes for spectral reduction of individual objects are given below:
WD 0103+732. The frames used for the construction of
LL1 background contain a very faint point source. As the WD is bright
and the point source is practically removed in the min/max trimming and
averaging process, we choose to ignore this faint source so that we can
perform the 2D background subtraction to maximize the quality of the final
data cube.
In addition, the frames used for the construction of the LL2 background
show a small knot of H2 line emission at 17 m.
This H2 emission knot is near the center of one slit position, and at the
edge of the other slit position. We therefore use only the latter slit
position for background subtraction. The pixels of the on-source BCD
frames affected by over-subtraction of the emission knot are flagged as
record-level bad pixels, and not used for cube construction.
Furthermore, this H2 knot is far enough from the WD
position that both a target spectrum and a local background spectrum can
be extracted outside the position of the H2 emission knot in the slit.
The spectrum of WD 0103+732 is not detected in the SL2 observations.
WD 0127+581. This WD is faint, with = 0.34 mJy.
The orientation of the IRS slit, determined by the roll angle of the
spacecraft, was such that a very bright neighboring star was included
in the slit.
Consequently, the weak emission of WD 0127+581 was overwhelmed by the
elevated background from the neighboring star.
The spectrum of the WD is not unambiguously detected in the
background-subtracted frame; the signal-to-noise ratio is too low
for meaningful spectral extraction.
WD 0439+466. In its SL2 order, the BCD frames from the three
final mapping positions show an abrupt jump in brightness across the
center of each frame. Since these slit positions do not contain
the target WD, we do not use them for the SL2 cube construction or
the SL1 background construction.
3 Results
In our MIPS 24 m survey of hot WDs, nine of the 71 objects show 24 m point sources detected at the given WD positions. To assess the physical significance of these 24 m detections and the 3- upper limits (see Table 2), we have computed the expected photospheric emission at 24 m by extrapolating from the optical and near-IR measurements of each WD. We first searched the web version of the McCook and Sion WD catalog and the SIMBAD database for available photometric measurements in the bands and the Sloan Digital Sky Survey (SDSS) bands. For WDs that were discovered from the SDSS (Eisenstein et al., 2006), usually only photometric measurements were available. We also searched the 2MASS Point Source Catalog (Skrutskie et al., 2006) for near-IR counterparts to the WDs. The effective temperatures of our program WDs are so high that it is reasonable to approximate their photospheric emission with a blackbody in the Rayleigh-Jeans limit, i.e., the flux density . The amounts of extinction to most of these WDs are unknown, but will have smaller impact at longer wavelengths. We thus use the photometric measurement with the longest wavelength and without extinction correction to extrapolate the expected flux density at 23.7 m, the central wavelength of the MIPS 24 m band. The fiducial photometric measurement and the expected photospheric emission at 24 m are given in columns 6 and 7 of Table 2, respectively.
The expected photospheric emission from these hot WDs are all less than the nominal sensitivity of the 24 m observations, 0.034 mJy. It is not surprising that all nine detections are at least two orders of magnitude higher than the expected photospheric emission, and thus represent IR excesses. In the cases of non-detections, the 3- upper limits are several to several tens times higher than the expected photospheric emission. These non-detections do not exclude the existence of low-level IR excesses, but no useful deductions can be made from these results; thus, the non-detections will not be discussed further in this paper. We have combined all available photometric measurements of the nine WDs and pre-WDs with 24 m excesses to produce the SEDs plotted in Figure 2. Below we describe individually the nine hot WDs and pre-WDs with 24 m excesses. Detailed modeling of the SEDs and IRS spectra will be reported by Bilikova et al. (2011b, in preparation).
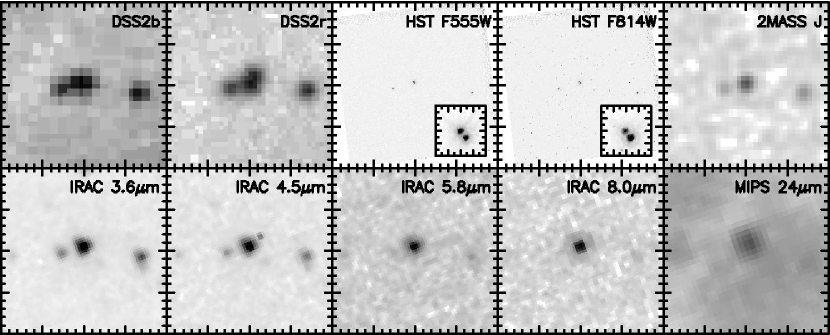
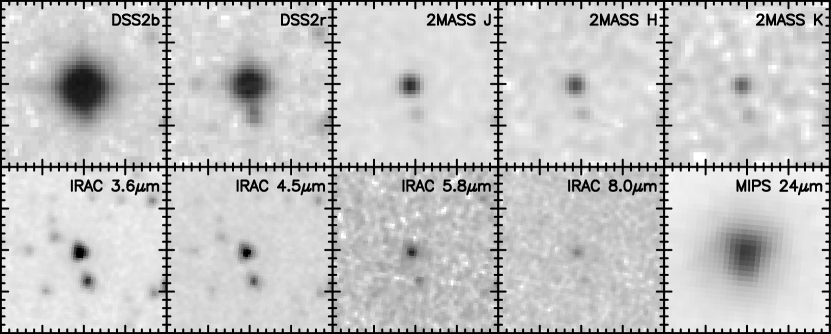
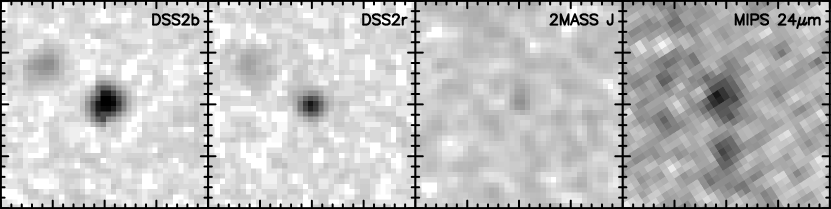
3.1 CSPN K 1-22
Multi-wavelength optical and IR images of CSPN K 1-22 are displayed in Figure 3. The DSS2 Red image shows a source at 2″ north of the CSPN, but no counterpart of this source is seen in any of the other optical or IR images. It is not clear whether this red source is spurious or transient. The HST images show two sources separated by 035 at the center of K 1-22; the blue northeast component is the CSPN and the red southwest component is a cool companion (Ciardullo et al., 1999). The IR images show a source coincident with this close pair of stars, but cannot resolve them.
In the SED plot in Figure 2, the flux densities of CSPN K 1-22 and its close companion are individually plotted in the HST F555W and F814W bands, while the flux densities in the 2MASS and Spitzer IRAC and MIPS bands are for the two stars combined. An extinction of (Ciardullo et al., 1999) has been corrected from the observed flux densities. The atmospheric emission of the WD has been modeled as a blackbody; for the companion, we adopt the Kurucz atmospheric model for a K2 V star, the spectral type implied by the HST photometry. These stellar emission models are plotted in thick solid curves in Figure 2. The IRAC and MIPS flux densities are all higher than the expected atmospheric emission from these two stars. The IR excesses in the near-IR and in the mid-IR cannot be described by a single blackbody; however, two blackbody emitters at temperatures of 700 and 150 K appear to match the IR excesses in the IRAC and MIPS 24 m bands. The combined SED of the WD, its companion, and the two blackbody emitters is plotted as a thin solid line in Figure 2.
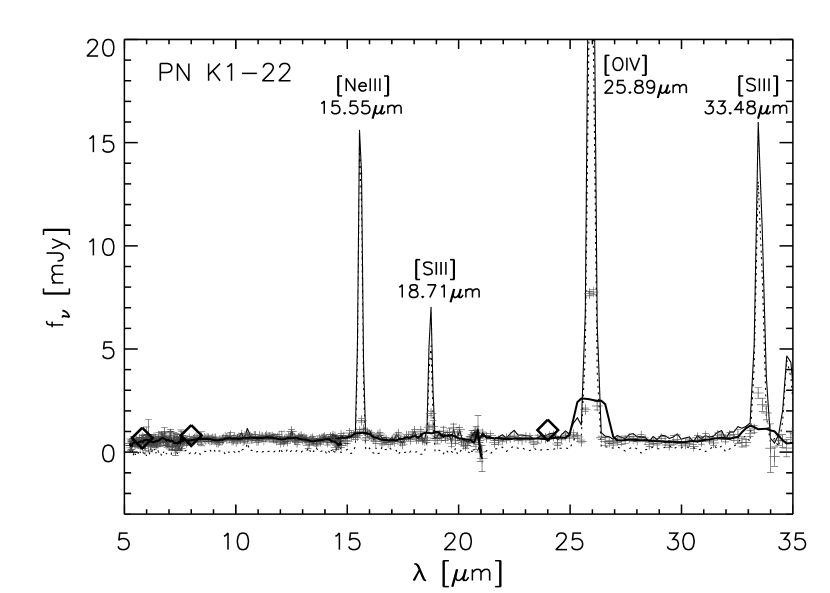
The IRS spectra extracted from CSPN K 1-22 and adjacent background regions all show [Ne III] 15.55 m, [S III] 18.71 m, [O IV] 25.89 m, and [S III] 33.48 m line emission (see Figure 4). The background-subtracted IRS spectrum of CSPN K 1-22 shows a weak continuum component and residual line emission, especially prominent in the [O IV] line.
To determine the nature of the residual line emission, we compare the spatial distributions of the continuum and line emission. Figure 5 shows the surface brightness profiles along the slit for the 24 m continuum, [O IV] 25.89 m line, and [S III] 18.71 m line, as extracted from the IRS data cube. It is evident that the continuum originates from a point source, the CSPN, while the line emission from the PN is extended. The [S III] line has a lower excitation potential (i.e., ionization potential of S+, 23.3 eV) and shows an extended, nearly flat surface brightness profile; while the [O IV] 25.89 m line has a higher excitation potential (i.e., ionization potential of O+2, 54.9 eV) and shows a narrower, centrally peaked surface brightness profile. These different spatial distributions are consistent with the expectation from the ionization stratification in a PN.
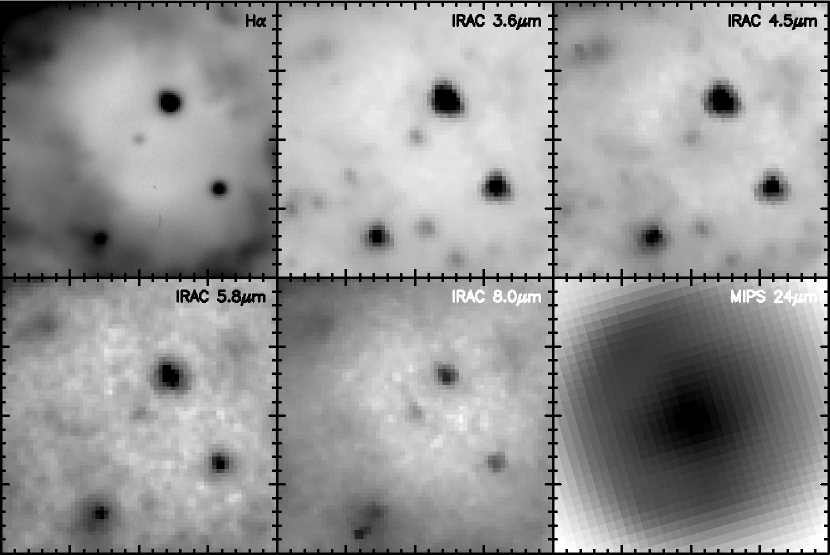
The MIPS 24 m image of K 1-22 (Figure 1) shows that the CSPN is superposed on diffuse emission (Chu et al., 2009). The IRS spectra show that this diffuse emission is dominated by the [O IV] 25.89 m line. The centrally peaked morphology of the diffuse [O IV] emission makes it difficult to subtract the background accurately. As the background spectrum is the average of those extracted from the two regions at 20′′ from the central source, it can be seen from the [O IV] surface brightness profile in Figure 5 that the excess emission at the center is 35% of the background emission. The residual [O IV] emission in the background-subtracted spectrum in Figure 4 is indeed about 1/3 as strong as the emission from the background regions. Therefore, the apparent [O IV] emission in the background-subtracted spectrum of CSPN K 1-22 is most likely a residual from imperfect background subtraction.
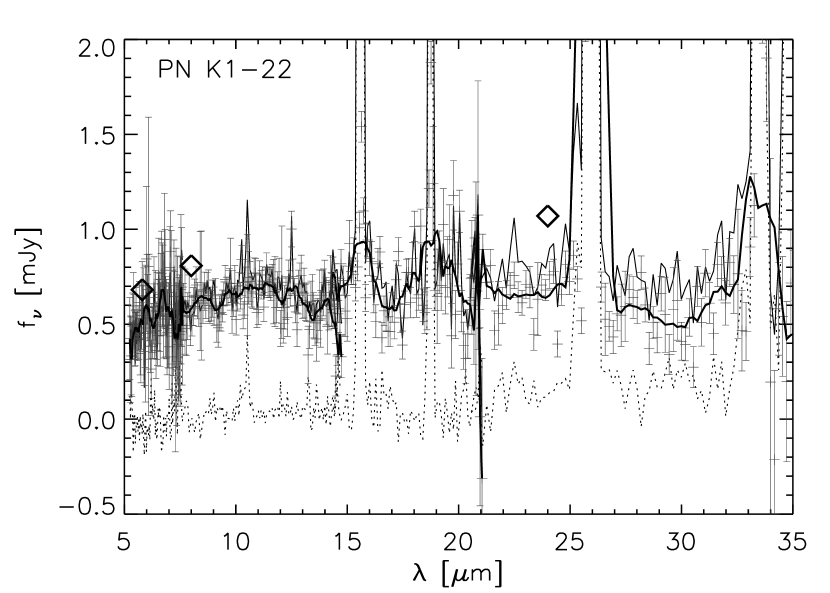
Figure 4 shows that the MIPS 24 m band photometric measurement ( 1 mJy) of the CSPN, plotted as an open diamond, appears higher than the continuum flux density of the background-subtracted spectrum (0.75 mJy). This discrepancy is likely caused by the contamination of [O IV] line in the MIPS 24 m band. The photometric measurements in the IRAC 5.8 and 8.0 m bands, plotted as open diamonds in Figure 4, are also higher than the continuum flux densities; however, these discrepancies are less than 25% and are reasonable for the S/N of the spectrum at these wavelengths.
The background-subtracted IRS spectrum of CSPN K 1-22 shows continuum emission well above the expected photospheric emission of the CSPN and its red companion (0.011 mJy), and thus represents an IR excess due to dust continuum. Nevertheless, it is not known whether the excess IR emission is associated with the CSPN or its red companion. High-resolution images in the mid-IR wavelengths are needed to resolve CSPN K 1-22 and its companion.
3.2 CSPN NGC 2438
CSPN NGC 2438 shows bright 24 m emission more than four orders of magnitude higher than the expected photospheric emission. The MIPS observation of NGC 2438 was made after the Spitzer Cycle 5 proposal deadline; thus NGC 2438 was not an IRS target in our Program 50629. However, Bilikova et al. (2009) had found IR excesses of CSPN NGC 2438 through the analysis of archival IRAC observations (see IRAC images in Figure 6), and included NGC 2438 in another Spitzer program to study IR excesses of CSPNs (Program 50793; PI: Bilikova). The IRS observations used only the short wavelength modules and therefore only extend to 15 m. The background-subtracted IRS spectrum of the CSPN NGC 2438 exhibits continuum emission (Bilikova et al. 2011b, in preparation).
The SED of CSPN NGC 2438 (Figure 2) shows that the 24 m excess is much greater than the IR excesses in the IRAC bands. The IR excesses in the IRAC bands and the MIPS 24 m band cannot originate from a single-temperature emitter; instead, they can be roughly described by two emitters at 1200 K and 150 K, respectively. Unfortunately, 2MASS did not detect the CSPN NGC 2438 in the and bands to allow a more precise modeling of the SED to determine the temperature of the hotter emitter and whether it originates from a low-mass stellar companion or from a dust disk.
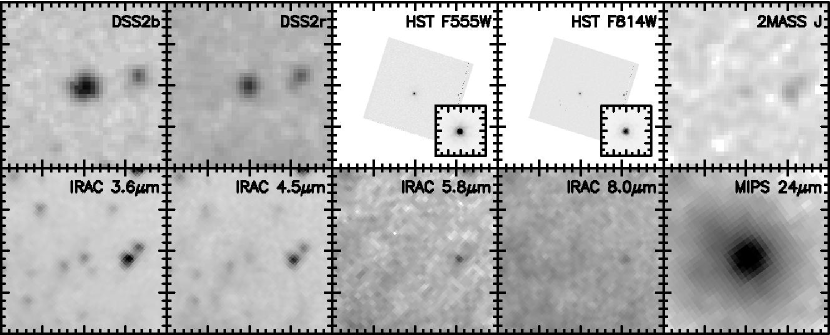
3.3 WD 0103+732 (CSPN EGB 1)
WD 0103+732 is the central star of the PN EGB 1. HST images do not show any companion stars (Ciardullo et al., 1999). See Figure 7 for optical, 2MASS , IRAC, and MIPS 24 m images of WD 0103+732. The SED of WD 0103+732 (Figure 2) shows optical and near-IR flux densities following a blackbody curve closely, although the WD is not detected in the 2MASS and bands, where 2- upper limits are plotted. The flux density in the IRAC 8.0 m band starts to rise above the photospheric emission level, and in the MIPS 24 m band the flux density is more than three orders of magnitude higher than expected from photospheric emission.
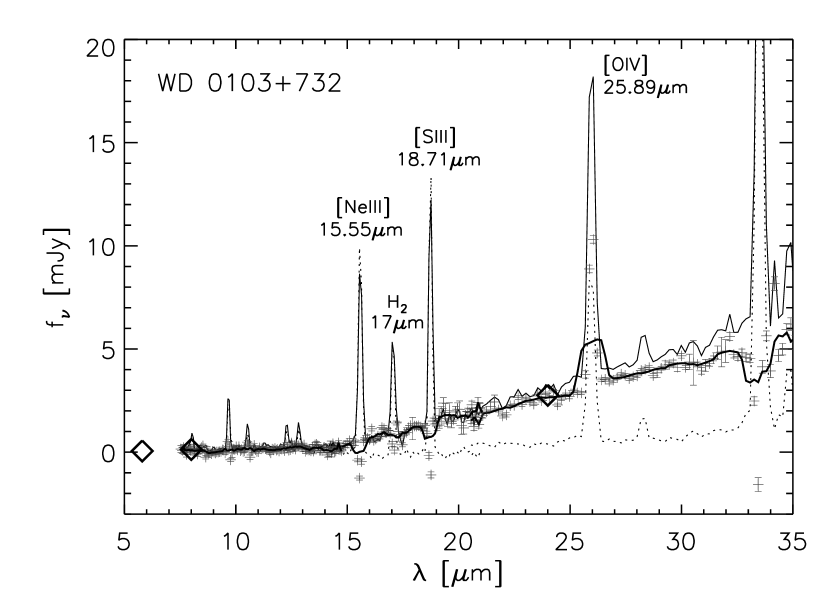
The MIPS 24 m image (Figure 1) shows that the point source of WD 0103+732 is superposed on diffuse emission (Chu et al., 2009). The IRS spectrum of the background (see Figure 8) shows that the diffuse emission is dominated by line emission with a weak but appreciable continuum at wavelengths 20 m, and that the major contributor to the MIPS 24 m emission is the [O IV] 25.89 m line. The background-subtracted spectrum of WD 0103+732 (Figure 8) is dominated by continuum emission. The apparent deficit at the [Ne III] and [S III] lines and excess at the [O IV] line are caused by imperfect background subtraction. Figure 9 shows the surface brightness profiles of the 24 m continuum, [O IV] and [S III] lines extracted from the IRS data cube. The nebular emission near WD 0103+732 also shows ionization/excitation stratification, as the [O IV] emission profile is narrower and more strongly peaked toward the center than [S III], resulting in an under-subtraction of background in the [O IV] line and over-subtractions in the [S III] and [Ne III] lines. Interestingly, the background shows an emission feature at 17 m, which could be associated with transitions of H2 or polycyclic aromatic hydrocarbons (PAH). As the emission feature is narrow and the PAH 11.2 m feature is not present, we identify this 17 m feature as the H2 (0, 0) S(1) line emission. This H2 emission is associated with a much more extended background and does not vary significantly over the regions of spectral extractions, no residual H2 17 m line emission is present in the background-subtracted spectrum of WD 0103+732.
Despite the morphological differences between the PNe EGB1 and the Helix Nebula, the SED and IRS spectrum of WD 0103+732 are very similar to those of WD 2226210 (Su et al., 2007). Both show IR excess starting in the IRAC 8 m band and peaking near the MIPS 70 m band. Because of the bright nebulosity and lower angular resolution of the MIPS 70 m camera, we consider the 70 m flux density of WD 0103+732, 55 mJy, an upper limit. As the effective temperature of WD 0103+732, 150,000 K, is higher than that of WD 2226210, 110,000 K, the physical properties of their dust disks are different (Bilikova et al. 2011b, in preparation). Note that the light curve of WD 0103+732 shows sinusoidal variations in the bands, but the nature of these variations is uncertain (Hillwig et al. 2011, in preparation).
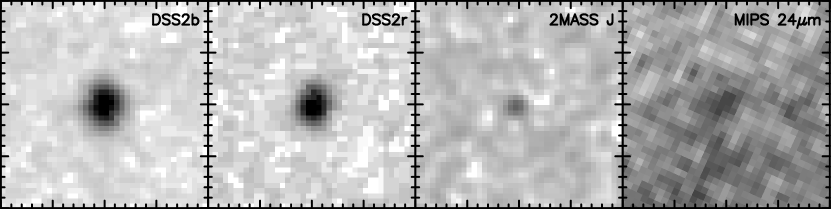
3.4 WD 0109+111
This WD is not surrounded by any known PN. It is not in a crowded region. The optical and 2MASS sources are coincident within 1″; the 24 m source is faint, but also coincident with the optical source within 1-2″ (see Figure 10). MIPS 24 m images are usually infested with faint background galaxies. We identified 20 sources within a 3 area centered on WD 0109+111. If these sources are randomly distributed within this area, the probability to have one source landing within 2″ from WD 0109+111 is . Thus, it is unlikely that the 24 m source is a chance superposition of a background source.
The SED of WD 0109+111 (see Figure 2) shows that the optical and near-IR flux densities fall nicely along a blackbody curve, but the 24 m emission is more than 100 times higher than the expected photospheric emission. WD 0109+111 is the second faintest 24 m source among the nine detections. No IRS spectra are available for WD 0109+111.
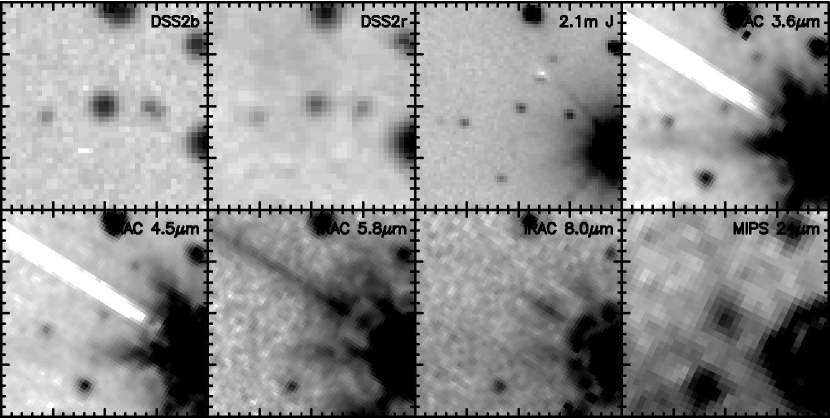
3.5 WD 0127+581 (CSPN Sh 2-188)
WD 0127+581 is surrounded by the PN Sh 2-188. This WD is not detected in the 2MASS bands. We have thus used the Kitt Peak National Observatory 2.1 m telescope with the FLAMINGOS detector and measured = 17.030.13 and = 16.180.13. We have also obtained IRAC observations of this object. See Figure 11 for these images of WD 0127+581. As WD 0127+581 is a faint source superposed on a bright background, the errors in photometric measurements are large. The WD is easily visible in the 3.6 and 4.5 m bands, but not convincingly detected in the 5.8 and 8.0 m bands. As explained in Section 2.3, the weak emission from WD 0127+581 is superposed on an elevated background from a bright neighboring star in the IRS observations. The high noise level prohibits the detection of the spectra of WD 0127+581, and hence no spectra are extracted.
The SED of WD 0127+581 (Figure 2) is complex. The near-IR excess in the and bands is indicative of a late-type companion, while the IR excesses in the IRAC bands and MIPS 24 m band require two emitters at different temperatures. Two blackbody emitters at temperatures of 900 K and 150 K are plotted in Figure 2 to illustrate one possibility.
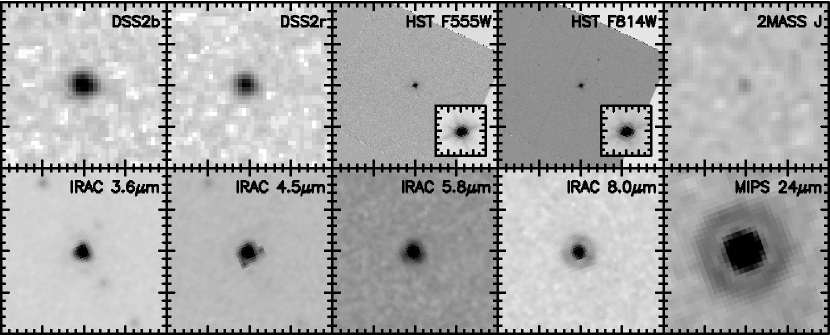
3.6 WD 0439+466 (CSPN Sh 2-216)
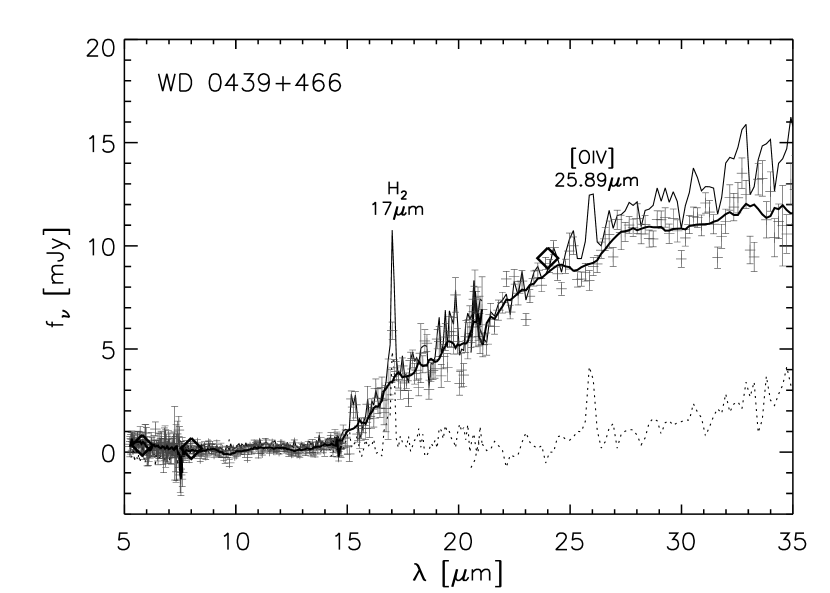
WD 0439+466 is the central star of the PN Sh 2-216 at a distance of 1296 pc (Harris et al., 2007). The WD is coincident with a point source surrounded by diffuse emission in the MIPS 24 m image (Chu et al., 2009). The SED of WD 0439+466 follows the photospheric blackbody curve throughout the optical, 2MASS, and IRAC bands, but shows a large deviation in the MIPS 24 m band. See Figure 12 for optical and IR images of WD 0439+466.
The IRS spectra of WD 0439+466 and its background are shown in Figure 13. The spectrum of the diffuse emission adjacent to WD 0439+466 shows the [O IV] 25.89 m and the H2 (0, 0) S(1) 17 m lines, in addition to a weak continuum that is appreciable at wavelengths greater than 25 m. The spectrum extracted at the position of WD 0439+466 also shows the [O IV] and H2 lines, but these emission features are effectively removed by the subtraction of the local nebular background. The background-subtracted spectrum of WD 0439+466 is totally dominated by continuum emission in the 15–35 m range; furthermore, its flux densities agree well with the photometric measurements in the IRAC 5.8 and 8.0 m and MIPS 24 m bands. The continuum-dominated nature of this spectrum is similar to that of the Helix central star. The detailed modeling of WD 0439+466’s SED and spectrum will be presented by Bilikova et al. (2011b, in preparation).
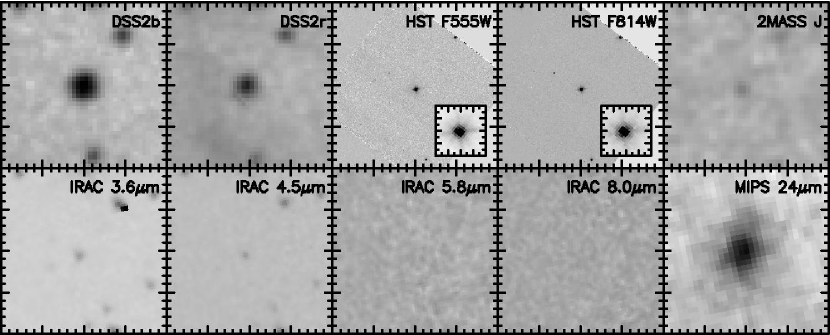
3.7 WD 0726+133 (CSPN Abell 21)
WD 0726+133 is the central star of the PN Abell 21, also known as YM 29. The WD appears as a point source superposed on diffuse emission in the MIPS 24 m image (Chu et al., 2009). See Figure 14 for optical and IR images of WD 0726+133. The flux densities of WD 0726+133 in the optical, 2MASS , and IRAC bands are all consistent with a blackbody approximation of the stellar photospheric emission. The flux density in the MIPS 24 m band is almost three orders of magnitude higher than the expected photospheric emission. Several 24 m sources are detected near WD 0726+133, and their optical counterparts are resolved into spiral galaxies in archival HST F555W and F814W images, but WD 0726+133 remains unresolved and shows no companions (Ciardullo et al., 1999). No IRS spectra are available for this WD.
3.8 WD 0950+139 (CSPN EGB 6)
WD 0950+139 is surrounded by the PN EGB 6. This WD previously gained attention because of its strong [O III] and [Ne III] emission lines (Liebert et al., 1989) and near-IR excesses (Fulbright & Liebert, 1993). This puzzle was partially solved by an [O III] image taken with the HST Faint Object Camera, which revealed an unresolved source 018 from the WD (Bond, 1994, 2009). Apparently, WD 0950+139 has a late-type companion and the line emission is associated with the companion. See Figure 15 for optical and IR images of WD 0950+139. Our MIPS 24 m observation of WD 0950+139 shows a bright unresolved source, and the 24 m flux density is four orders of magnitude higher than the photospheric emission expected from WD 0950+139 (Figure 2). The SED in the IRAC and MIPS 24 m bands cannot be accounted for by a single-temperature emitter; instead, it may be described by two emitters at temperatures of 500 and 150 K. A Spitzer IRS spectrum of WD 0950+139 was obtained through Guaranteed Time Observations, and the spectrum confirmed that the emission in the MIPS 24 m band is dominated by continuum (Su et al. 2011, in preparation).
3.9 WD 1342+443
This WD was discovered in the SDSS. It is below the detection limit of 2MASS. Figure 16 shows optical and IR images of WD 1342+443. The SED of WD 1342+443 in Figure 2 shows the SDSS photometric measurements falling along the blackbody model curve with the 24 m flux density more than 400 times higher than the expected photospheric emission. This WD has the faintest 24 m flux density among the nine hot WDs detected. No IRS spectra are available for WD 1342+443.
4 Discussion
4.1 Statistical Properties
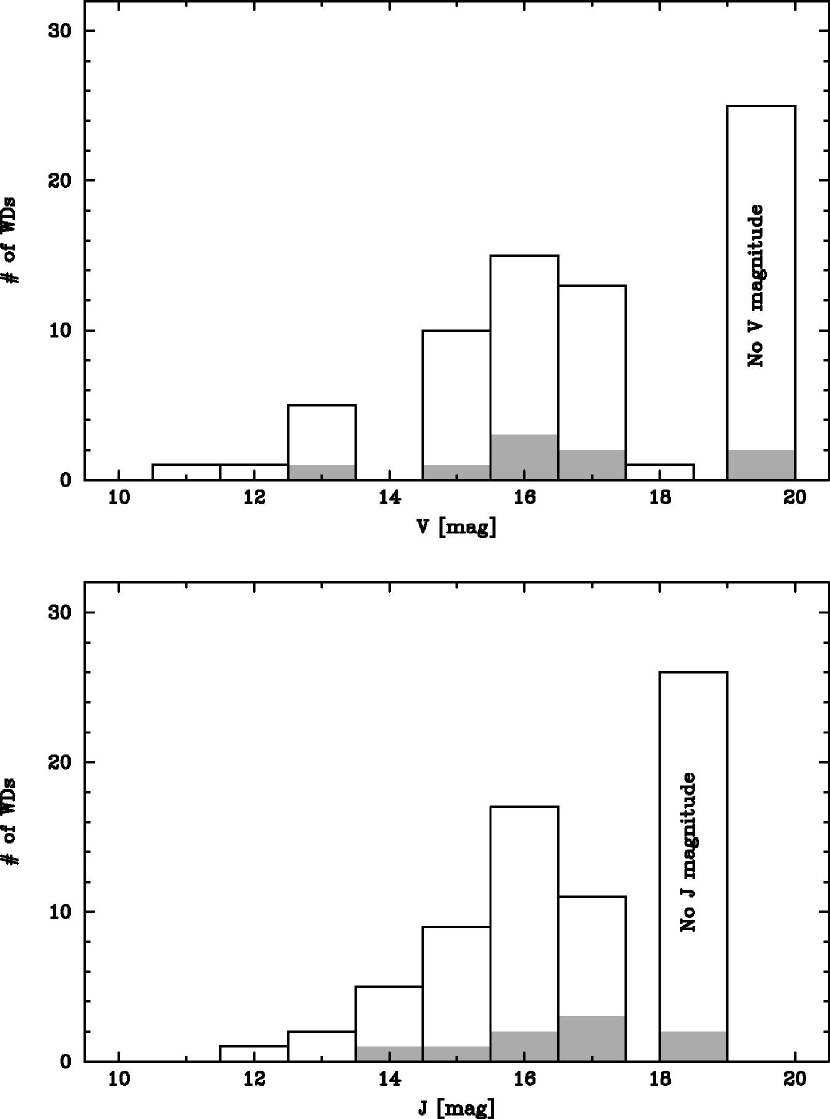
Among our sample of 71 hot WDs, nine show 24 m excesses, corresponding to almost 13%. Figure 17 shows the distribution of the sample in and . The number of detections in each magnitude bin is too small to provide meaningful statistics. If the sample is divided into a brighter group that has photometric measurements and a fainter group that has no photometric measurements, it can be seen that 24 m excesses are detected in 15-16% of the brighter hot WDs, and only 8% among the fainter hot WDs. As all of the WDs in our sample have high temperatures and a small range of radii, their brightnesses are indicative of distances, with the fainter ones being at larger distances. The different percentages of brighter and fainter WDs exhibiting 24 m excesses most likely reflect the fact that the limiting sensitivity of our MIPS 24 m survey precludes the detection of distant objects. The true percentage of hot WDs exhibiting 24 m excesses is likely greater than 15-16%.
For the nine hot WDs with 24 m excesses, their 24 m flux densities are plotted against their -band flux densities in Figure 18. No correlations are seen in this plot. This is expected, as the -band flux density is a rough indicator of distance and the 24 m excess should not be dependent on distance. Another reason for the lack of correlation is the diverse physical conditions of the 24 m emitters, as discussed later in Section 4.2.
Seven of the nine hot WDs with 24 m excesses are still surrounded by PNe: CSPN K 1-22, CSPN NGC 2438, WD 0103+732 in EGB 1, WD 0127+581 in Sh 2-188, WD 0439+466 in Sh 2-216, WD 0726+133 in Abell 21 (YM 29), and WD 0950+139 in EGB 6; while two are not in PNe: WD 0109+111 and WD 1342+443. There is a striking difference in the frequency of occurrence of 24 m excesses between the WDs and pre-WDs in PNe and those without PNe: 20% and 5–6%, respectively. The two WDs not in known PNe are also the faintest in 24 m among the nine. WDs without PNe are more evolved than those that are still surrounded by PNe. The smaller 24 m excesses of the WDs without PNe appear to indicate an evolutionary trend of diminishing excess; however, this trend is not obvious among the 24 m excesses of the WDs with PNe, if the nebular sizes (Chu et al., 2009) are indicative of their evolutionary status. Considering the diversity in the progenitors’ masses and evolutionary paths of these WDs, the current sample of hot WDs with 24 m excesses is too small to allow us to distinguish between an evolutionary effect and other effects.
4.2 Nature of the 24 m Excesses
The IR excesses of the CSPN Helix are detected in the 8, 24, and 70 m bands, but not at shorter wavelengths (Su et al., 2007). High spatial resolution HST observation has ruled out any resolved companion earlier than M5 (Ciardullo et al., 1999). Furthermore, the photometric accuracies in the IRAC bands (1- of 20, 24, 26 and 17 Jy at the 3.6, 4.5, 5.4, 8.0 m bands, respectively) can further constrain the mass of a possible companion. At an age of 1 Gyr, the 2MASS and IRAC photometry can also rule out, at the 3- level, any companion with mass greater than 20 Jupiter masses, i.e., early T dwarfs with 650 K. Three of the nine new detections of mid-IR excesses of hot WDs show similar SEDs: WD 0103+732 (CSPN EGB 1) shows excess emission at 8 and 24 m, while WD 0439+466 (CSPN Sh 2-216) and WD 0726+133 (CSPN Abell 21) show excess emission at only 24 m. Their lack of near-IR excesses does not support the presence of late-type companions.
Four of the hot WDs with 24 m excesses also exhibit excess emission in the IRAC bands: CSPN K 1-22, CSPN NGC 2438, WD 0127+581 (CSPN Sh 2-188), and WD 0950+139 (CSPN EGB 6). IRS observations indicate that this IR excess is continuum in nature, and crude fits to the SEDs suggest blackbody emitter temperatures of 500–1200 K. These temperatures are in the ranges for brown dwarfs, but the emitting areas, to cm2, are too large for brown dwarfs. It is most likely that these IR excesses in the IRAC bands originate from hot dust emission. The two cases with cooler emitter temperatures (500-700 K), CSPN K 1-22 and WD 0950+139, are known to have late-type companions (Ciardullo et al., 1999; Bond, 2009). The relationship between these companions and the hot dust components is uncertain. Future searches for companions of CSPN NGC 2438 and WD 0127+581 may help us understand the roles played by stellar companions in producing the dust component responsible for the IRAC excesses. Finally, two hot WDs with 24 m excesses, WD 0109+111 and WD 1342+443, have no IRAC observations to determine whether excess emission is present in the IRAC bands; their 2MASS measurements do show any excess emission. In summary, among the ten hot WDs and pre-WDs that show excess emission at 24 m, 40% also show near-IR excesses associated with an additional warmer emission component that might be related to the presence of a companion.
Whether a 24 m excess is accompanied by near-IR excess or not, the shape of the SED suggests that the 24 m emission originates from a component distinct from the WD’s photospheric emission or another near-IR emitter. The 24 m emission must originate from a source cooler than 300 K. Assuming that this source is heated solely by stellar radiation, we can determine the covering factor of the emitter from the luminosity ratio , where is the luminosity of the excess emitter and is the luminosity of the WD. We adopt the stellar effective temperature, assume a blackbody model, and use the distance and extinction corrected photometry to determine the stellar luminosity . (Useful physical parameters are listed in Table 6.) The luminosity of the excess emitter is calculated by assuming a 150 K blackbody model normalized at the observed 24 m flux density. In the case of WD 0103+732 and WD 2226210, blackbody temperatures are determined from model fits to the 8, 24, and 70 m flux densities. For the four WDs exhibiting excess emission in the IRAC bands, we add another blackbody component to fit these measurements. These IR emitter models, illustrated in Figure 2, are used to calculate their approximate luminosities. The ratios of the nine new cases and the Helix CSPN are listed in Table 6. The covering factors range from to .
A perfect absorbing body heated by a 100,000 K WD to 150 K would be at a distance of 10 AU, and 100 K at 20 AU. Even at a distance of 10 AU, a covering factor of corresponds to AU2, or , too large to be a star or a planet. The most likely origin of this mid-IR emitter is a dust disk, as proposed for the CSPN Helix Nebula (Su et al., 2007). The presence of near-IR excesses indicates the existence of a binary companion or a dust disk at higher temperatures, or both. Detailed modeling and high-resolution images are needed to decipher the true nature of the IR excesses. We defer the modeling of the SEDs and IRS spectra of hot WDs with 24 m excesses to another paper (Bilikova et al. 2011b, in preparation).
The connection among CSPNs, circumstellar dust disks, and binarity has been alluded to by various observations and theoretical models. For example, Keplerian circumstellar dust disks have been observed to be associated with binary post-AGB stars (de Ruyter et al., 2006). Furthermore, the close binary stellar evolution of CSPNs has been suggested to play a very important role in the formation and shaping of PNe (Soker, 1998; Nordhaus & Blackman, 2006; de Marco, 2009), although such binary companions are difficult to detect. Our detection of a warmer emitter (500–1200 K) in addition to the colder dust component (at 100–200 K) in four CSPNs, two of which have known companions, appear to further the connection. However, the dust disks responsible for 24 m excesses are much larger than the circumstellar disks ejected from common-envelope binaries (a few AU at most; Taam & Ricker, 2010), and have very different geometry from the Keplerian circumstellar dust disks around binary post-AGB stars, especially in the covering factor (). The Keplerian circumstellar dust disks around binary post-AGB stars typically have 0.2–0.5 (de Ruyter et al., 2006), several orders of magnitude higher than those responsible for 24 m excesses of hot WDs and pre-WDs. This large discrepancy in covering factors suggests that these dust disks have different origins, and the small covering factors are more consistent with debris disks observed in main sequence stars (Su et al., 2006; Trilling et al., 2008; Wyatt, 2008). It is thus likely that the origin of the 24 m excesses of hot WDs and pre-WDs is dynamically rejuvenated debris disks as suggested by Su et al. (2007).
5 Summary
The central WD of the Helix Nebula has been shown to exhibit excess emission in the Spitzer MIPS 24 and 70 m bands and it is suggested that this IR excess originates from a dust disk produced by collisions among KBOs (Su et al., 2007). Inspired by the WD in the Helix, we have conducted a MIPS 24 m survey of 71 hot WDs and pre-WDs and found excess 24 m emission for nine of them. We have further obtained Spitzer IRAC and IRS follow-up observations for a subset of these WDs with 24 m excesses.
The detection of 24 m excesses is limited by the sensitivity of the observations. Among the hot WDs with optical or near-IR photometric measurements, 15-16% are detected at 24 m with excesses. The true occurrence rate of 24 m excesses must be still higher. Thirty-five of the 71 WDs and pre-WDs in our survey sample are in known PNe; among these 20% show 24 m excesses, while among the 36 WDs without known PNe only 5–6% show 24 m excesses.
The 24 m excesses are accompanied by different levels of excesses in the and IRAC bands. The excess emission in the bands for CSPN K 1-22 and WD 0950+139 (CSPN EGB 6) originates from their known low-mass companions. Excess emission in the IRAC bands are present in CSPN K 1-22, CSPN NGC 2438, WD 0950+139, and WD 0127+581 (CSPN Sh 2-188); IRS spectra show continuum emission clearly in the three former objects and faintly in WD 0127+581, indicating the presence of a dust component at temperatures of 1000 K. Only WD 0103+732 shows 8, 24, and 70 m excesses similar to those in the SED of the Helix central WD. In two cases, WD 0439+466 and WD 0726+133, no IR excess is present in the IRAC bands; the IRS spectrum of WD 0439+466 shows that its 24 m band emission is dominated by dust continuum.
The emitters responsible for the 24 m excesses have large emitting surface areas that can be provided only by dust disks. Furthermore, the excess emission in these long wavelength bands indicates dust temperatures 300 K. The ratios of dust disks responsible for the 24 m excesses of hot WDs and pre-WDs are in the range of to , similar to those observed in debris disks around main sequence stars, but several orders of magnitude lower that those of Keplerian circumstellar dust disks around binary post-AGB stars. It is likely that these dust disks around hot WDs and pre-WDs are indeed rejuvenated debris disks as suggested by Su et al. (2007) for the Helix central star.
In two cases, CSPN K 1-22 and WD 0950+139 in EGB 6, late-type companions have been resolved by HST images, but Spitzer images could not resolve these CSPNs and their companions. It is thus uncertain whether the dust disks are associated with the CSPNs or their companion. High-resolution mid-IR images are needed to establish the associations unambiguously.
References
- Becklin et al. (2005) Becklin, E. E., Farihi, J., Jura, M., Song, I., Weinberger, A. J., & Zuckerman, B. 2005, ApJ, 632, L119
- Bilikova et al. (2011a) Bilikova, J., Chu, Y.-H., Gruendl, R., Su, K., & Rauch, T. 2011a, Asymmetric Planetary Nebulae 5 Conference
- Bilikova et al. (2009) Bilikova, J., Chu, Y.-H., Su, K., Gruendl, R., Rauch, T., De Marco, O., & Volk, K. 2009, Journal of Physics Conference Series, 172, 012055
- Bond (1994) Bond, H. E. 1994, Interacting Binary Stars, Asp. Conf. Series, 56, 179
- Bond (2009) Bond, H. E. 2009, Journal of Physics Conference Series, 172, 012029
- Bonsor & Wyatt (2010) Bonsor, A., & Wyatt, M. 2010, MNRAS, 409, 1631
- Carpenter et al. (2009) Carpenter, J. M., et al. 2009, ApJS, 181, 197
- Chu et al. (2009) Chu, Y.-H., et al. 2009, AJ, 138, 691
- Chu et al. (2011) Chu, Y.-H., Gruendl, R. A., Bilíková, J., Riddle, A., & Su, K. Y.-L. 2011, American Institute of Physics Conference Series, 1331, 230
- Ciardullo et al. (1999) Ciardullo, R., Bond, H. E., Sipior, M. S., Fullton, L. K., Zhang, C.-Y., & Schaefer, K. G. 1999, AJ, 118, 488
- de Marco (2009) de Marco, O. 2009, PASP, 121, 316
- de Ruyter et al. (2006) de Ruyter, S., van Winckel, H., Maas, T., Lloyd Evans, T., Waters, L. B. F. M., & Dejonghe, H. 2006, A&A, 448, 641
- Debes et al. (2011) Debes, J. H., et al. 2011, ApJ, in press (arXiv:1012.4859v1)
- Debes & Sigurdsson (2002) Debes, J. H., & Sigurdsson, S. 2002, ApJ, 572, 556
- Diolaiti et al. (2000) Diolaiti, E., Bendinelli, O., Bonaccini, D., Close, L., Currie, D., & Parmeggiani, G. 2000, A&AS, 147, 335
- Dole et al. (2004) Dole, H., et al. 2004, ApJS, 154, 93
- Dong et al. (2010) Dong, R., Wang, Y., Lin, D. N. C., & Liu, X.-W. 2010, ApJ, 715, 1036
- Dreizler & Werner (1996) Dreizler, S., & Werner, K. 1996, A&A, 314, 217
- Eisenstein et al. (2006) Eisenstein, D. J., et al. 2006, ApJS, 167, 40
- Engelbracht et al. (2007) Engelbracht, C. W., et al. 2007, PASP, 119, 994
- Farihi et al. (2010) Farihi, J., Jura, M., Lee, J.-E., & Zuckerman, B. 2010, ApJ, 714, 1386
- Fazio et al. (2004) Fazio, G. G., et al. 2004, ApJS, 154, 10
- Fulbright & Liebert (1993) Fulbright, M. S., & Liebert, J. 1993, ApJ, 410, 275
- Gordon et al. (2005) Gordon, K. D., et al. 2005, PASP, 117, 503
- Gordon et al. (2007) Gordon, K. D., et al. 2007, PASP, 119, 1019
- Harris et al. (2007) Harris, H. C., et al. 2007, AJ, 133, 631
- Homeier et al. (1998) Homeier, D., et al. 1998, A&A, 338, 563
- Houck et al. (2004) Houck, J. R., et al. 2004, ApJS, 154, 18
- Jura (2003) Jura, M. 2003, ApJ, 584, L91
- Jura et al. (2007) Jura, M., Farihi, J., & Zuckerman, B. 2007, ApJ, 663, 1285
- Kilic & Redfield (2007) Kilic, M., & Redfield, S. 2007, ApJ, 660, 641
- Kilic et al. (2005) Kilic, M., von Hippel, T., Leggett, S. K., & Winget, D. E. 2005, ApJ, 632, L115
- Kilic et al. (2006) Kilic, M., von Hippel, T., Leggett, S. K., & Winget, D. E. 2006, ApJ, 646, 474
-
Krist (2006)
Krist, J. E. 2006, Spitzer Tiny TIM User’s Guide Version 2.0
http://ssc.spitzer.caltech.edu/mips/psf.html - Kwitter & Jacoby (1989) Kwitter, K. B., & Jacoby, G. H. 1989, AJ, 98, 2159
- Liebert et al. (1989) Liebert, J., et al. 1989, ApJ, 346, 251
- Liebert et al. (2005) Liebert, J., Bergeron, P., & Holberg, J. B. 2005, VizieR Online Data Catalog, 215, 60047
- McCook & Sion (1999) McCook, G. P., & Sion, E. M. 1999, ApJS, 121, 1
- Mullally et al. (2007) Mullally, F., et al. 2007, ApJS, 171, 206
- Napiwotzki (1999) Napiwotzki, R. 1999, A&A, 350, 101
- Napiwotzki (2001) Napiwotzki, R. 2001, A&A, 367, 973
- Napiwotzki & Schönberner (1995) Napiwotzki, R., & Schönberner, D. 1995, A&A, 301, 545
- Nordhaus & Blackman (2006) Nordhaus, J., & Blackman, E. G. 2006, MNRAS, 370, 2004
- Phillips (2003) Phillips, J. P. 2003, MNRAS, 344, 501
- Phillips (2004) Phillips, J. P. 2004, MNRAS, 353, 589
- Rauch et al. (1999) Rauch, T., Köppen, J., Napiwotzki, R., & Werner, K. 1999, A&A, 347, 169
- Rauch et al. (1996) Rauch, T., Koeppen, J., & Werner, K. 1996, A&A, 310, 613
- Rauch et al. (2009) Rauch, T., Werner, K., Ziegler, M., Koesterke, L., Kruk, J. W., & Oliveira, C. M. 2009, American Institute of Physics Conference Series, 1135, 171
- Reach et al. (2005) Reach, W. T., et al. 2005, ApJ, 635, L161
- Riddle et al. (2011) Riddle, A., et al. 2011, to be submitted to AJ
- Rieke et al. (2004) Rieke, G. H., et al. 2004, ApJS, 154, 25
- Rieke et al. (2005) Rieke, G. H., et al. 2005, ApJ, 620, 1010
- Skrutskie et al. (2006) Skrutskie, M. F. et al. 2006, AJ, 131, 1163
- Smith et al. (2007) Smith, J. D. T., et al. 2007, PASP, 119, 1133
- Soker (1998) Soker, N. 1998, ApJ, 496, 833
- Su et al. (2006) Su, K. Y. L., et al. 2006, ApJ, 653, 675
- Su et al. (2007) Su, K. Y. L., et al. 2007, ApJ, 657, L41
- Taam & Ricker (2010) Taam, R. E., & Ricker, P. M. 2010, New A Rev., 54, 65
- Trilling et al. (2008) Trilling, D. E., et al. 2008, ApJ, 674, 1086
- Tylenda et al. (1992) Tylenda, R., Acker, A., Stenholm, B., & Koeppen, J. 1992, A&AS, 95, 337
- von Hippel et al. (2007) von Hippel, T., Kuchner, M. J., Kilic, M., Mullally, F., & Reach, W. T. 2007, ApJ, 662, 544
- Werner et al. (2004) Werner, M. W., et al. 2004, ApJS, 154, 1
- Werner et al. (1997) Werner, K., Bagschik, K., Rauch, T., & Napiwotzki, R. 1997, A&A, 327, 721
- Wesemael et al. (1985) Wesemael, F., Green, R. F., & Liebert, J. 1985, ApJS, 58, 379
- Wyatt (2008) Wyatt, M. C. 2008, ARA&A, 46, 339
- Zuckerman & Becklin (1987) Zuckerman, B., & Becklin, E. E. 1987, Nature, 330, 138
- Zuckerman et al. (2007) Zuckerman, B., Koester, D., Melis, C., Hansen, B. M., & Jura, M. 2007, ApJ, 671, 872
![[Uncaptioned image]](/html/1101.5137/assets/x2.png)
![[Uncaptioned image]](/html/1101.5137/assets/x3.png)
![[Uncaptioned image]](/html/1101.5137/assets/x4.png)
![[Uncaptioned image]](/html/1101.5137/assets/x5.png)
![[Uncaptioned image]](/html/1101.5137/assets/x6.png)
![[Uncaptioned image]](/html/1101.5137/assets/x7.png)


| StaraaFor hot pre-WDs in PNe, the PN names are given. | RA | Dec | WD | PN | PNG | |
|---|---|---|---|---|---|---|
| Name | (J2000) | (J2000) | (103 K) | Type | Name | Number |
| WD 0005+511 | 00 08 18.11 | +51 23 16.9 | 120 | DOQZ.4 | — | — |
| PG 0038+199 | 00 41 35.31 | +20 09 17.5 | 115 | DO | — | — |
| WD 0044121 | 00 47 03.31 | 11 52 18.9 | 150 | PG1159 | NGC 246 | 118.874.7 |
| WD 0103+732 | 01 07 07.74 | +73 33 25.2 | 150 | DA.34 | EGB 1 | 124.0+10.7 |
| WD 0108+100 | 01 11 06.59 | +10 21 38.2 | 84 | DOZ.6 | — | — |
| WD 0109+111 | 01 12 23.06 | +11 23 36.1 | 110 | DOZ.46 | — | — |
| WD 0121756 | 01 22 52.97 | 75 21 13.8 | 180 | PG1159 | — | — |
| WD 0123842 | 01 21 55.0 | 84 01 23.0 | — | PG1159 | — | — |
| WD 0127+581 | 01 30 33.22 | +58 24 50.7 | 102 | DAO.49 | Sh 2-188 | 128.004.1 |
| WD 0130196 | 01 32 39.31 | 19 21 40.4 | 100 | PG1159.5 | — | — |
| WD 0237+241 | 02 40 28.47 | +24 22 10.4 | 100 | DA0.5 | — | — |
| IC 289 | 03 10 19.36 | +61 19 00.5 | 100 | — | IC 289 | 138.8+02.8 |
| WD 0316+002 | 03 18 58.28 | +00 23 25.8 | 100 | DA0.5 | — | — |
| WD 0322+452 | 03 27 15.42 | +45 24 20.2 | 125 | DAO.40 | HDW 3 | 149.409.2 |
| NGC 1360 | 03 33 14.63 | 25 52 17.9 | 110 | — | NGC 1360 | 220.353.9 |
| WD 0439+466 | 04 43 21.20 | +46 42 06.4 | 83 | DA.61 | Sh 2-216 | 158.5+00.7 |
| WD 0444+049 | 04 47 04.51 | +04 58 41.7 | 100 | DQZO.5 | — | — |
| WD 0500156 | 05 03 07.51 | 15 36 22.5 | 100 | DAO.51 | Abell 7 | 215.530.8 |
| K 1-27 | 05 57 02.37 | 75 40 21.1 | 105 | — | K 1-27 | 286.829.5 |
| WD 0556+106 | 05 59 24.87 | +10 41 39.9 | 141 | DA.36 | WeDe 1 | 197.406.4 |
| WD 0615+556 | 06 19 33.95 | +55 36 43.7 | 94 | DAO.54 | PuWe 1 | 158.9+17.8 |
| WD 0615+655 | 06 20 30.11 | +65 34 21.3 | 100 | DA.51 | — | — |
| Abell 15 | 06 27 02.04 | 25 22 49.3 | 110 | — | Abell 15 | 233.516.3 |
| Abell 20 | 07 22 57.64 | +01 45 33.4 | 119 | — | Abell 20 | 214.9+07.8 |
| WD 0726+133 | 07 29 02.64 | +13 14 49.7 | 130bbHe II Zanstra temperature from Phillips (2003). | PG1159 | Abell 21 | 205.1+14.2 |
| NGC 2438 | 07 41 50.50 | 14 44 07.7 | 114 | — | NGC 2438 | 231.8+04.1 |
| WD 0753+535 | 07 57 51.69 | +53 25 17.5 | 125 | DQZO.4 | JnEr 1 | 164.8+31.1 |
| WD 0823+316 | 08 27 05.57 | +31 30 08.2 | 100 | DA0.5 | — | — |
| NGC 2610 | 08 33 23.37 | 16 08 57.6 | 100 | — | NGC 2610 | 239.6+13.9 |
| WD 0915+201 | 09 18 33.11 | +19 53 08.2 | 100 | DA0.5 | — | — |
| WD 0939+262 | 09 42 50.65 | +26 01 00.0 | 100 | DA0.5 | — | — |
| WD 0948+534 | 09 51 25.98 | +53 09 31.0 | 126 | DA.46 | — | — |
| LSS 1362 | 09 52 44.50 | 46 16 47.1 | 100 | — | HeDr 1 | 273.6+06.1 |
| WD 0950+139 | 09 52 58.94 | +13 44 34.9 | 110 | DA.46 | EGB 6 | 221.5+46.3 |
| WD 1003441 | 10 05 45.79 | 44 21 33.4 | 120 | PG1159 | Lo 4 | 274.3+09.1 |
| WD 1034+001 | 10 37 03.81 | 00 08 19.6 | 100 | DOZ.5 | — | — |
| WD 1111+552 | 11 14 47.72 | +55 01 08.3 | 94 | DAO.54 | NGC 3587 | 148.4+57.0 |
| K 1-22 | 11 26 43.78 | 34 22 11.5 | 141 | — | K 1-22 | 283.6+25.3 |
| WD 1144+004 | 11 46 35.21 | +00 12 33.1 | 150 | DO.34 | — | — |
| LoTr 4 | 11 52 29.22 | 42 17 38.6 | 120 | — | LoTr 4 | 291.4+19.2 |
| BlDz 1 | 11 53 06.71 | 50 50 57.1 | 128 | — | BlDz 1 | 293.6+10.9 |
| BE UMa | 11 57 44.84 | +48 56 17.9 | 105 | — | BE UMa | 144.8+65.8 |
| WD 1159034 | 12 01 45.97 | 03 45 41.3 | 140 | DQZO.4 | — | — |
| WD 1253+378 | 12 55 14.77 | +37 32 29.7 | 100 | DA.5 | — | — |
| MeWe 1-3 | 13 28 04.90 | 54 41 58.4 | 100 | — | MeWe 1-3 | 308.2+07.7 |
| WD 1342+443 | 13 44 26.87 | +44 08 33.3 | 79 | DA.7 | — | — |
| WD 1424+534 | 14 25 55.40 | +53 15 25.2 | 110 | PG1159.46 | — | — |
| WD 1501+664 | 15 02 09.94 | +66 12 19.6 | 170 | DZQ.3 | — | — |
| WD 1517+740 | 15 16 46.23 | +73 52 07.0 | 110 | DO.5 | — | — |
| WD 1520+525 | 15 21 46.56 | +52 22 03.6 | 150 | PG1159.3 | JavdSt 1 | 085.4+52.3 |
| WD 1522+662 | 15 22 56.70 | +66 04 41.5 | 140 | DO | — | — |
| WD 1532+033 | 15 35 09.85 | +03 11 16.0 | 100 | DA.5 | — | — |
| WD 1547+015 | 15 49 44.98 | +01 25 54.6 | 100 | DA.5 | — | — |
| WD 1622+323 | 16 24 49.05 | +32 17 02.0 | 78 | DA.65 | — | — |
| WD 1625+280 | 16 27 33.73 | +27 54 33.6 | 117 | DAO.43 | Abell 39 | 047.0+42.4 |
| WD 1707+427 | 17 08 47.75 | +42 41 00.4 | 100 | DOZ.5 | — | — |
| WD 1729+583 | 17 29 50.37 | +58 18 09.0 | 84 | DA0.6 | — | — |
| WD 1738+669 | 17 38 02.60 | +66 53 47.7 | 95 | DA.53 | — | — |
| WD 1749+717 | 17 49 04.50 | +71 45 08.9 | 100 | DAO.5 | — | — |
| WD 1751+106 | 17 53 32.27 | +10 37 23.7 | 117 | PG1159 | Abell 43 | 036.0+17.6 |
| HaTr 7 | 17 54 09.30 | 60 49 57.1 | 100 | — | HaTr 7 | 332.516.9 |
| WD 1827+778 | 18 25 08.72 | +77 55 37.1 | 76 | DA.68 | — | — |
| WD 1830+721 | 18 30 04.90 | +72 11 34.5 | 100 | DO.5 | — | — |
| WD 1851088 | 18 54 37.18 | 08 49 38.8 | 90 | DAO.56 | IC 1295 | 025.404.7 |
| WD 1917+461 | 19 19 10.21 | +46 14 51.2 | 88 | DAO.57 | Abell 61 | 077.6+14.7 |
| WD 1958+015 | 20 00 39.25 | +01 43 40.6 | — | PG1159 | NGC 6852 | 042.514.5 |
| WD 2114+239 | 21 16 52.34 | +24 08 50.9 | 108 | DAO.47 | Abell 74 | 072.717.1 |
| WD 2115+339 | 21 17 08.30 | +34 12 27.3 | 170 | PG1159.3 | MWP 1 | 080.310.4 |
| WD 2209+825 | 22 08 25.54 | +82 44 55.3 | 100 | DO | — | — |
| WD 2246+066 | 22 49 25.29 | +06 56 45.8 | 100 | DA.51 | — | — |
| WD 2324+397 | 23 27 15.97 | +40 01 23.4 | 126 | DO.4 | — | — |
| WD 2333+301 | 23 35 53.33 | +30 28 06.2 | 170 | DOZ.3 | Jn 1 | 104.229.6 |
| Star Name | MIPS AOR | PSF flux | Uncertainty | Upper Limit | Photometry | Photospheric | Remarks |
|---|---|---|---|---|---|---|---|
| (mJy) | 1- (mJy) | 3- (mJy) | (mag) | (mJy) | |||
| WD 0005+511 | 23366144 | 0.289 | 0.157 | 0.761 | = 14.19 | 0.01164 | |
| PG 0038+199 | 23366400 | 0.014 | 0.050 | 0.163 | = 15.37 | 0.00374 | |
| WD 0044121 | 23366656 | -2.677 | 9.641 | 26.247 | = 12.87 | 0.03925 | very bright nebular emission |
| WD 0103+732 | 23366912 | 2.760 | 0.141 | = 16.35 | 0.00058 | superposed on diffuse emission | |
| WD 0108+100 | 23367168 | 0.058 | 0.057 | 0.230 | = 16.33 | 0.00130 | a point source at 12″ away |
| WD 0109+111 | 23367424 | 0.269 | 0.055 | = 16.05 | 0.00200 | ||
| WD 0121756 | 23367680 | 0.002 | 0.038 | 0.116 | = 16.16 | 0.00181 | |
| WD 0127+581 | 23368192 | 0.338 | 0.142 | = 17.44 | 0.00021 | superposed on diffuse emission | |
| WD 0130196 | 23368448 | 0.055 | 0.049 | 0.201 | = 14.00 | 0.01386 | |
| WD 0237+241 | 23368704 | 0.073 | 0.067 | 0.274 | = 16.28 | 0.00137 | a point source at 95 away |
| CSPN IC 289 | 23368960 | 1210.9 | 18.2 | 1265.6 | = 15.14 | 0.00485 | very bright diffuse emission |
| WD 0316+002 | 23369216 | -0.026 | 0.056 | 0.142 | = 19.66 | 0.00007 | |
| WD 0322+452 | 23369472 | 0.059 | 0.062 | 0.245 | = 17.20 | 0.00026 | |
| CSPN NGC 1360 | 23369728 | -0.605 | 1.752 | 4.651 | = 12.37 | 0.06221 | bright nebular emission |
| WD 0439+466 | 23369984 | 9.200 | 0.157aaAperture photometry flux. | = 13.66 | 0.01896 | superposed on diffuse emission | |
| WD 0444+049 | 23370240 | -0.003 | 0.064 | 0.187 | two sources at 10–11″ away | ||
| WD 0500156 | 23370496 | 0.013 | 0.047 | 0.156 | = 16.16 | 0.00181 | |
| CSPN K 1-27 | 23370752 | 11.603 | 0.372 | 12.721 | = 16.40 | 0.00122 | bright nebular emission |
| WD 0556+106 | 23371008 | 0.051 | 0.071 | 0.264 | = 17.40 | 0.00022 | a point source at 125 away |
| WD 0615+556 | 23371264 | 0.110 | 0.049 | 0.256 | = 15.90 | 0.00194 | two sources at 3–4″ away |
| WD 0615+655 | 23371520 | 0.028 | 0.042 | 0.153 | = 15.70 | 0.00105 | |
| CSPN Abell 15 | 23371776 | 14.221 | 0.342 | 15.248 | = 15.72 | 0.00103 | very bright nebular emission |
| CSPN Abell 20 | 23372032 | 0.021 | 2.645 | 7.956 | = 16.56 | 0.00048 | very bright nebular emission |
| WD 0726+133 | 23372288 | 0.916 | 0.114 | = 16.58 | 0.00104 | superposed on diffuse emission | |
| CSPN NGC 2438 | 23372544 | 12.410 | 13.659 | = 17.02 | 0.00069 | superposed on diffuse emission | |
| WD 0753+535 | 23372800 | 0.197 | 0.159 | 0.675 | = 16.58 | 0.00104 | very bright nebular emission |
| WD 0823+316 | 23373056 | -0.073 | 0.055 | 0.092 | = 15.73 | 0.00282 | |
| CSPN NGC 2610 | 23373312 | 127.5 | 7.2 | 149.0 | = 16.29 | 0.00160 | very bright nebular emission |
| WD 0915+201 | 23373568 | 0.039 | 0.057 | 0.210 | = 16.64 | 0.00044 | |
| WD 0939+262 | 23373824 | -0.008 | 0.053 | 0.151 | = 15.57 | 0.00311 | |
| WD 0948+534 | 23374080 | 0.060 | 0.043 | 0.189 | = 16.15 | 0.00183 | |
| CSPN LSS 1362 | 23374336 | -2.934 | 4.032 | 9.164 | = 12.81 | 0.04148 | very bright nebular emission |
| WD 0950+139 | 23374592 | 11.740 | 0.066 | = 16.10 | 0.00200 | ||
| WD 1003441 | 23374848 | 8.821 | 3.688 | 19.887 | = 16.60 | 0.00046 | very bright nebular emission |
| WD 1034+001 | 23375104 | 0.964 | 0.133 | 1.364 | = 14.37 | 0.00986 | bright nebular emission |
| WD 1111+552 | 23375360 | 2.190 | 1.320 | 6.149 | = 16.71 | 0.00092 | bright nebular emission |
| CSPN K 1-22 | 23375616 | 1.070 | 0.143 | = 14.27 | 0.01081 | superposed on diffuse emission | |
| WD 1144+004 | 23375872 | -0.044 | 0.067 | 0.158 | = 16.13 | 0.00186 | |
| CSPN LoTr 4 | 23376128 | 32.298 | 0.359 | 33.375 | = 16.50bbFrom Rauch et al. (1996). | 0.00050 | very bright nebular emission |
| CSPN BlDz 1 | 23376384 | 3.746 | 1.109 | 7.073 | = 18.40ccFrom Rauch et al. (1999). | 0.00009 | bright nebular emission |
| CSPN BE UMa | 23376640 | 0.031 | 0.045 | 0.165 | = 13.63 | 0.01949 | |
| WD 1159034 | 23376896 | 0.044 | 0.058 | 0.218 | = 15.73 | 0.00282 | |
| WD 1253+378 | 23377152 | 0.034 | 0.042 | 0.159 | = 15.45 | 0.00365 | |
| CSPN MeWe 1-3 | 23377408 | 77.376 | 0.794 | 79.759 | very bright nebular emission | ||
| WD 1342+443 | 23377664 | 0.218 | 0.041 | = 17.56 | 0.00049 | ||
| WD 1424+534 | 23377920 | 0.141 | 0.044 | 0.273 | = 16.97 | 0.00084 | a point source 9″ away |
| WD 1501+664 | 23378176 | 0.011 | 0.038 | 0.125 | = 15.90 | 0.00087 | a point source 2″ away |
| WD 1517+740 | 23378432 | 0.005 | 0.038 | 0.118 | = 15.90 | 0.00069 | |
| WD 1520+525 | 23378688 | 0.232 | 0.042 | 0.358 | = 16.38 | 0.00125 | in diffuse 24 um emission |
| WD 1522+662 | 23378944 | 0.016 | 0.036 | 0.125 | = 16.40 | 0.00043 | |
| WD 1532+033 | 23379200 | 0.029 | 0.050 | 0.179 | = 16.42 | 0.00142 | |
| WD 1547+015 | 23379456 | -0.034 | 0.047 | 0.107 | = 16.43 | 0.00119 | |
| WD 1622+323 | 23379712 | 0.039 | 0.038 | 0.152 | = 13.77 | 0.01713 | |
| WD 1625+280 | 23379968 | 0.093 | 0.153 | 0.553 | = 16.13 | 0.00157 | superposed on diffuse emission |
| WD 1707+427 | 23380224 | -0.069 | 0.038 | 0.046 | = 16.70 | 0.00042 | |
| WD 1729+583 | 23380480 | -0.025 | 0.038 | 0.090 | = 19.76 | 0.00007 | |
| WD 1738+669 | 23380736 | 0.021 | 0.036 | 0.129 | = 15.45 | 0.00365 | a point source 125 away |
| WD 1749+717 | 23380992 | 0.004 | 0.039 | 0.123 | = 16.78 | 0.00086 | |
| WD 1751+106 | 23381248 | -1.840 | 2.641 | 6.084 | = 15.33 | 0.00407 | bright nebular emission |
| CSPN HaTr 7 | 23381504 | 0.194 | 0.294 | 1.075 | = 15.75 | 0.00277 | bright nebular emission |
| WD 1827+778 | 23381760 | 0.022 | 0.037 | 0.133 | = 16.64 | 0.00098 | a point source 125 away |
| WD 1830+721 | 23382016 | -0.006 | 0.040 | 0.113 | = 17.00 | 0.00025 | a point source 7″ away |
| WD 1851088 | 23382272 | 5.071 | 5.496 | 21.557 | = 16.90ddFrom Napiwotzki & Schönberner (1995). | 0.00035 | very bright nebular emission |
| WD 1917+461 | 23382528 | 0.049 | 0.090 | 0.318 | = 17.39 | 0.00022 | bright nebular emission |
| WD 1958+015 | 23382784 | 136.0 | 1.5 | 140.4 | = 17.90 | 0.00014 | very bright nebular emission |
| WD 2114+239 | 23383040 | -0.073 | 0.061 | 0.109 | = 17.05 | 0.00030 | |
| WD 2115+339 | 23383296 | -0.120 | 0.341 | 0.903 | = 14.18 | 0.01174 | bright nebular emission |
| WD 2209+825 | 23383552 | -0.010 | 0.040 | 0.110 | = 16.58 | 0.00104 | |
| WD 2246+066 | 23383808 | 0.067 | 0.052 | 0.222 | = 16.80eeFrom Homeier et al. (1998). | 0.00030 | |
| WD 2324+397 | 23384064 | 0.003 | 0.075 | 0.227 | = 15.40 | 0.00382 | near a patch of diffuse emission |
| WD 2333+301 | 23384320 | 0.363 | 0.154 | 0.824 | = 16.70 | 0.00093 | complex emission, no point source |
| WD Name | (Jy) | (Jy) | (Jy) | (Jy) | (Jy) | (Jy) |
|---|---|---|---|---|---|---|
| CSPN K 1-22 | 82942 | 70636 | 68138 | 80842 | 1,070143 | 12,000 |
| CSPN NGC 2438 | 10340 | 9157 | 8258 | 11795 | 12,41013,700aaThe photometric uncertainty is dominated by the bright nebular emission. | … |
| WD 0103+732 | 8815 | 7119 | 5820 | 13235 | 2,760141 | 55,000 |
| WD 0109+111 | … | … | … | … | 26955 | … |
| WD 0127+581 | 7647 | 5626 | 185161 | 9245 | 338142 | … |
| WD 0439+466 | 86244 | 51426 | 33622 | 18014 | 9,200157 | 9,200 8,400 |
| WD 0726+133 | 37.72.5 | 22.82.0 | 19.8 | 17.0 | 916114 | … |
| WD 0950+139 | 97715bbSu et al. 2011, in preparation. | 117615bbSu et al. 2011, in preparation. | 177336bbSu et al. 2011, in preparation. | 377237bbSu et al. 2011, in preparation. | 11,74066 | … |
| WD 1342+443 | … | … | … | … | 21841 | … |
| Date | IRS | SL1 | SL2 | LL1 | LL2 | |
|---|---|---|---|---|---|---|
| Star Name | Observed | Mode | 5.2–8.7 m | 7.4–14.5 m | 14.0–21.3 m | 19.5–38.0 m |
| CSPN K1-22 | 2009 Feb 26 | staring | 760 s | 760 s | 8120 s | 8120 s |
| WD 0103+732 | 2008 Sep 13 | staring | 860 s | 860 s | 4120 s | 8120 s |
| WD 0127+581 | 2008 Oct 09 | mappingaaExposure times given are for each pointing in the map. | 260 s | 260 s | 2120 s | 2120 s |
| WD 0439+466 | 2008 Sep 7 | mappingaaExposure times given are for each pointing in the map. | 860 s | 1660 s | 4120 s | 4120 s |
| WD | LL1 & LL2 | SL1 & SL2 | LL1 & LL2 | SL1 & SL2 |
|---|---|---|---|---|
| Name | Aperture (arcsec2) | Aperture (arcsec2) | Offset (arcsec) | Offset (arcsec) |
| CSPN K1-22 | 156 | 35 | 20 | 9.3 |
| WD 0103+732 | 155 | 41 | 20 | 13.0 |
| WD 0439+466 | 413 | 96 | 25.4 | 16.7 |
| WD | Spec | Distance | SED | ||||||
|---|---|---|---|---|---|---|---|---|---|
| Name | Type | (K) | (pc) | () | (K) | TypeaaEGB 6-like SEDs show excesses in the IRAC bands as well as the MIPS 24 m band. Helix-like SEDs show no excess emission at wavelengths shorter than 8 m. | ReferencesbbReferences for stellar temperature, extinction, and distance: (1) Rauch et al. (1999), (2) Ciardullo et al. (1999), (3) Phillips (2004), (4) Napiwotzki (2001), (5) Tylenda et al. (1992), (6) Dreizler & Werner (1996), (7) Werner et al. (1997), (8) Wesemael et al. (1985), (9) Kwitter & Jacoby (1989), (10) Rauch et al. (2009), (11) Harris et al. (2007), (12) Phillips (2003), (13) Liebert et al. (2005), (14) Napiwotzki (1999). | ||
| CSPN K 1-22 | CSPN | 141,000 | 0.076 | 1,330 | 3.3 | 700+150 | 1.1 | EGB 6-like | 1, 2 |
| CSPN NGC 2438 | CSPN | 114,000 | 0.25 | 1,200 | 4.1 | 1200+150 | 4.7 | EGB 6-like | 1, 3 |
| WD 0103+732 (CSPN EGB 1) | DA.34 | 150,000 | 0.58 | 650 | 3.7 | 190 | 1.4 | Helix-like | 4, 5 |
| WD 0109+111 | DOZ.46 | 110,000 | 0.065 | 280 | 2.3 | 150 | 4.9 | Helix-like | 6, 7, 8 |
| WD 0127+581 (CSPN Sh 2-188) | DAO.49 | 102,000 | 0.27 | 600 | 1.7 | 900+150 | 6.6 | EGB 6-like | 4, 9 |
| WD 0439+466 (CSPN Sh 2-216) | DA.61 | 83,000 | 0.065 | 129 | 2.4 | 150 | 2.4 | Helix-like | 10, 11 |
| WD 0726+133 (CSPN Abell 21) | PG1159 | 130,000 | 0.13 | 541 | 2.0 | 150 | 1.6 | Helix-like | 2, 11, 12 |
| WD 0950+139 (CSPN EGB 6) | DA.46 | 110,000 | 0.21 | 645 | 3.0 | 500+150 | 4.7 | EGB 6-like | 5, 13 |
| WD 1342+443 | DA.7 | 79,000 | — | 437 | 1.4 | 150 | 5.1 | Helix-like | 13 |
| WD 2226210 (CSPN Helix) | DAO.49 | 110,000 | 0.03 | 210 | 2.6 | 120 | 2.5 | Helix-like | 11, 14 |