Blue not brown: UKIDSS T dwarfs with suppressed -band flux
Abstract
We have used blue near-infrared colours to select a group of 12 spectroscopically-confirmed UKIDSS T dwarfs later than T4. From amongst these we identify the first two kinematic halo T-dwarf candidates. Blue near-infrared colours have been attributed to collisionally-induced hydrogen absorption, which is enhanced by either high surface gravity or low metallicity. Proper motions are measured and distances estimated, allowing the determination of tangential velocities. and components are estimated for our objects by assuming . From this, ULAS J0926+0835 is found to have km s-1 and km s-1 and ULAS J1319+1209 is found to have km s-1 and km s-1. These values are consistent with potential halo membership. However, these are not the bluest objects in our selection. The bluest is ULAS J1233+1219, with , and surprisingly this object is found to have young disc-like and . Our sample also contains Hip 73786B, companion to the metal-poor K5 dwarf Hip 73786. Hip 73786 is a metal-poor star, with and is located at a distance of 19 pc. space velocity components are calculated for Hip 73786A and B, finding that km s-1, km s-1 and km s-1. From the properties of the primary, Hip 73786B is found to be at least Gyr old. As a metal poor object, Hip 73786B represents an important addition to the sample of known T dwarf benchmarks.
keywords:
surveys - stars: low-mass, brown dwarfs1 Introduction
The first definitive detection of a T dwarf, Gliese 229B, occurred only as recently as 1995 (Nakajima et al. 1995). Many more have been found in sky surveys such as the Sloan Digital Sky Survey (SDSS; Abazajian et al. 2003), the Two-Micron All-Sky Survey (2MASS; Cutri et al. 2003), the Canada-France Hawaii Telescope’s Brown Dwarf Survey (CFBDS; Delorme et al. 2008) and the UKIRT Infrared Deep Sky Survey (UKIDSS; Warren et al. 2007). Subdwarfs have been known for longer, e.g. Kuiper (1939). These are very metal-poor stars (Gizis 1997 suggests as a typical value for subdwarfs). Subdwarfs also have fainter absolute magnitudes than solar-abundance stars with the same colour (Gizis 1997).
Along with globular clusters and tidal streams from captured dwarf galaxies, the Milky Way’s stellar halo also contains many subdwarfs. Subdwarfs represent the remnant members of earlier generations of star formation, when the interstellar medium had experienced less enrichment by supernovae and red giants. Reid (1998) estimates an age of 11 to 13 Gyr for the halo. The substellar extension to the subdwarf luminosity sequence could provide an important test of theories of brown dwarf formation in this environment. Obtaining accurate constraints on the substellar luminosity function is an important step toward clearer understanding of the physics underlying brown dwarf and star formation, and in particular the role played by metallicity. Unlike the disc stars, however, the substellar-mass extension of the halo subdwarfs is not well sampled.
Such objects also provide a unique environment in which to test our understanding of the physics of metal-poor atmospheres. Although the properties of low-metallicity atmospheres have been modelled at a variety of temperatures (e.g., Saumon et al. 1994; Lenzuni et al. 1991), there are currently few objects with well-established, subsolar metallicites against which the models may be tested.
L subdwarfs are known to exist, two examples of such objects being 2MASS J05325346+8246465 (Burgasser et al. 2003) and ULAS J135058.86+081506.8 (Lodieu et al. 2010). Brown dwarfs cool as they age, evolving through the L and into the T spectral classes (Burrows et al. 2001) and given the substantial ages of halo stars, there has been ample time for objects that were originally halo L dwarfs to evolve into the T class. Significantly, the L subdwarfs described above are known to posses halo kinematics.
Several T dwarfs have been suggested as metal-poor. Amongst these objects are J12373919+6526148 (Vrba et al. 2004) with (Liebert & Burgasser 2007), 2MASS J11145133-2618235 (Tinney et al. 2005) with (Burgasser et al. 2006), 2MASS J09393548-2448279 (Tinney et al. 2005) with (Leggett et al. 2007) and also Epsilon Indi Ba and Bb with (Santos et al. 2004). In addition to these low-metallicity objects, there are several other T dwarfs which have been considered as subdwarf candidates. These are 2MASS J0937+2931 (Burgasser et al. 2002), SDSS J1416+1348B (see Burningham et al. 2010; Scholz 2010b) and CFBS J1500-1824, discovered by Delorme et al. and reported in Burgasser et al. (2009). SDSS J1416+1348B, CFBS J1500-1824 and 2MASS J0937+2931 all show heavily-depressed -bands, due to enhanced collisionally-induced hydrogen absorption (hereafter, CIA H2; see Linsky 1969). In addition, 2MASS J0937+2931 and SDSS J1416+1348B have unusual, broadened -bands (respectively Burgasser et al. 2006; Burgasser et al. 2010a). 2MASS J0937+2931 shows little evidence of potassium absorption in its -band (McLean et al. 2007). CFBS J1500-1824 also does not show the 1.25m potassium doublet, an absence that would be consistent with low metallicity.
However, none of these T dwarfs show unambigously halo-like kinematics. Vrba et al. (2004) found 2MASS J0937+2931’s tangential velocity to be young disc-like, 47 km s-1. Bowler et al. (2010) report velocity components for the SDSS J1416+1348AB system such that = , which are young disc values. The kinematics of CFBDS J1500-1824 were described as implying an 80 percent probability that it is part of the old disc, with a 10 percent probability of halo membership.
2 Identifying candidates
The volume probed for T dwarfs by the UKIRT Infrared Deep Sky Survey (UKIDSS; Lawrence et al. 2007) Large Area Survey (LAS) is much larger than previously available, making feasible the identification of the T subdwarf population. Many T dwarfs have now been published as part of an ongoing program to spectroscopically confirm many T dwarfs in the UKIDSS LAS, as reported in Burningham et al. (2010) and references therein, and it is from this group that we have selected the targets investigated in this paper.
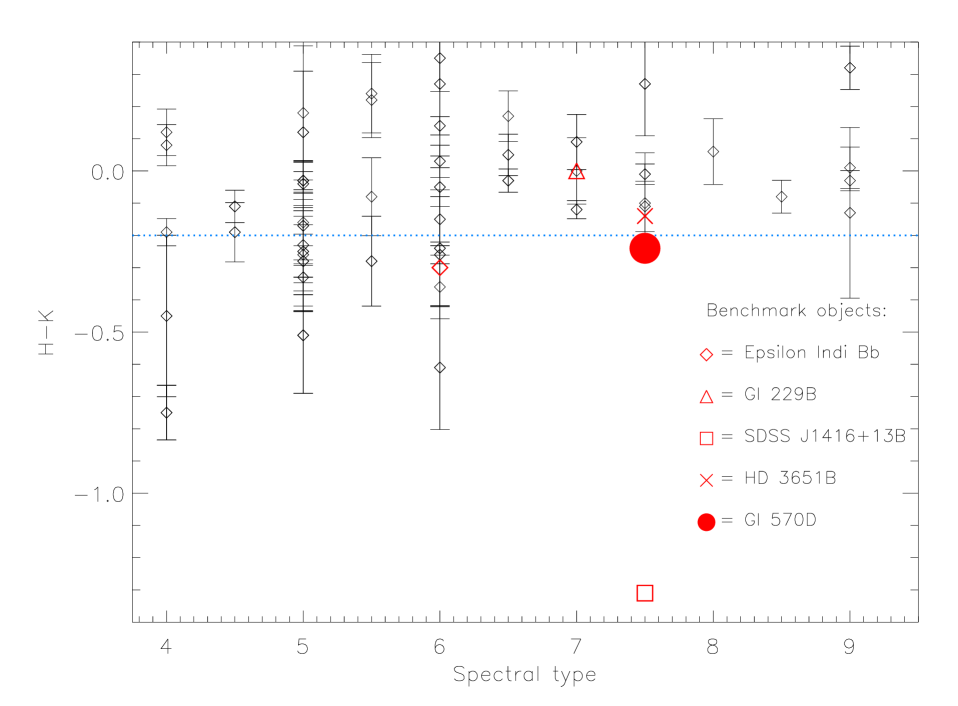
The UKIDSS sample of T dwarfs were themselves selected through a set of colour cuts, requiring and . Then, after cross-matching with SDSS, an object would be required either to have or to be undetected in in . Potential metal-poor T dwarfs were identified from amongst these spectroscopically-confirmed objects using a vs. spectral type plot (shown in Figure 1). The UKIDSS sample is most complete for targets later than a spectral type of T4, so a type later than T4 was required along with the cut.
The cut is intended to select blue outliers relative to the population, as the -band is expected to be the most strongly-affected by CIA H2 absorption, and this colour selection should thus prefer a set of objects showing suppressed -band flux. Comparisons to T dwarfs from binary systems, whose primary stars’ provide fiducial constraints on metallicity, support our criteria. HD 3651B, with an (Santos et al. 2004) also lies outside of our selection area. Gliese 570D, with an essentially solar metallicity of (Feltzing & Gustafsson 1998), lies on the boundary, whereas the metal-poor T6 Epsilon Indi Bb, with (Santos et al. 2004), lies within the selection area.
We also note that -band flux is sensitive to surface gravity as well as metallicity. The opacity of CIA H2 absorption varies with the square of the local gas number density (Saumon et al. 1994). For a given , higher-gravity T dwarfs will have higher gas pressures and thus tend to have larger H2 opacity. As such they will be fainter in the -band, leading to bluer colours than comparable lower-gravity objects. This surface gravity-related CIA H2 absorption will be strongest at late-T objects (see Burgasser et al. 2002; Knapp et al. 2004). In practice, for many objects blue colours may well be due to a combination of gravity and metallicity (Knapp et al. 2004). This degeneracy means that caution must be exercised before any attempt is made to infer a T dwarf’s metallicity solely on the basis of its near-infrared colours. For instance, Liu et al. (2007) show that for a K object, increasing from 5.0 to 5.5 dex changes the flux ratio by 0.25, while reducing metallicity from to -0.5 changes the ratio by 0.45. Halo objects, however, may well have far lower values (see Gizis 1997), so for these objects depression of the band flux may come to be dominated by metallicity effects. The model trend suggests that the bulk of colour variation may be due to metallicity for halo objects. Although surface gravity will certainly play a role, the bulk of radius evolution is expected to occur by ages of 1 Gyr for brown dwarfs (Burrows et al. 2001). This implies a maximum surface gravity for brown dwarfs. Saumon & Marley (2008) find this to be log in the case of a K and 0.068M⊙ brown dwarf. This futher suggests that the largest source in variation of and -band colours in halo T dwarfs is likely to be from metallicity.
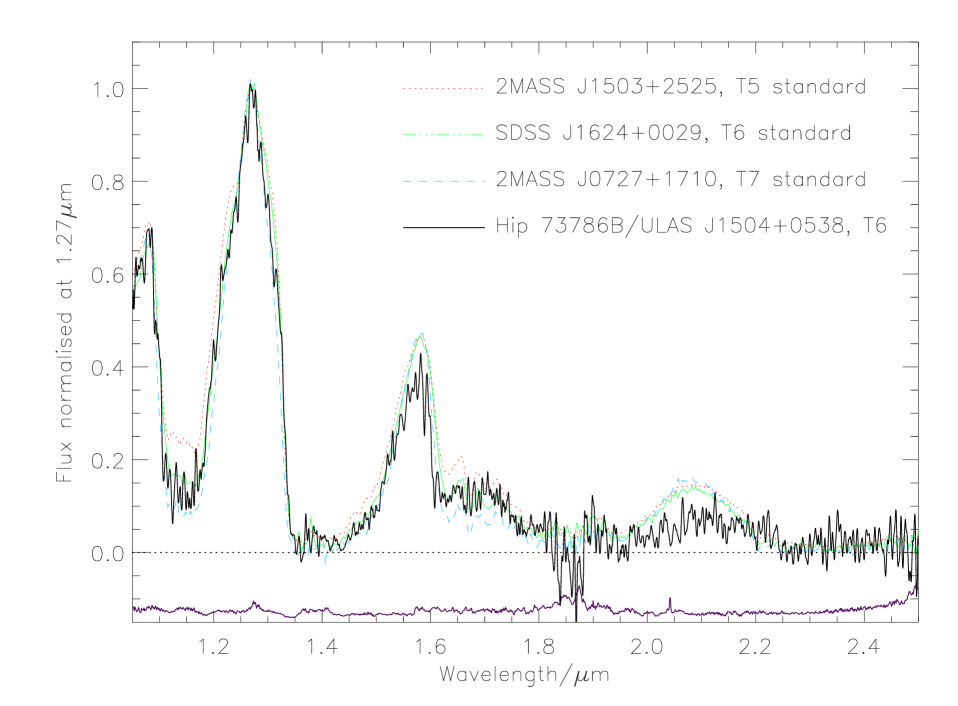
In addition to the previously-published DR4 LAS T dwarfs a more recently-identified object from DR5, ULAS J1504+0538, was also included in our selection. Since our spectroscopic confirmation of ULAS J1504+0538 (see Section 4), it has been identified by Scholz (2010a) as a common proper motion binary companion to Hip 73786. As such, from here on we will refer to this object as Hip 73786B. Our colour-type selection yielded a total of twelve candidates. The sample is shown in Figure 1, with plotted in relation to spectral type. The candidates lie below the dashed line. As can be seen, most of our candidates cluster at spectral types T5.5, with none later than T6.
| Object | R.A. | Dec | Discovery | mag | Source | ||||
|---|---|---|---|---|---|---|---|---|---|
| ULAS J0842+0936 | 08 42 11.68 | 09 36 11.78 | 3 | 18.38 | 1.2 | -0.46 | -0.2 | -0.7 | 4 |
| ULAS J0926+0835 | 09 26 05.47 | 08 35 17.00 | 3 | 18.57 | 1.3 | -0.12 | -0.5 | -0.6 | 4 |
| ULAS J0958-0039 | 09 58 29.86 | -00 39 32.0 | 1 | 18.95 | 0.9 | -0.5 | -0.3 | -0.5 | 1 |
| ULAS J1012+1021 | 10 12 43.54 | 10 21 01.70 | 3 | 16.87 | 1.13 | -0.34 | -0.33 | -0.68 | 4 |
| ULAS J1018+0725 | 10 18 21.78 | 07 25 47.10 | 2 | 17.71 | 1.19 | -0.16 | -0.3 | -0.41 | 2 |
| ULAS J1233+1219 | 12 33 27.45 | 12 19 52.20 | 3 | 17.87 | 1.35 | -0.41 | -0.75 | -1.16 | 4 |
| ULAS J1303+0016 | 13 03 03.54 | 00 16 27.70 | 1 | 19.02 | 1.2 | -0.47 | -0.6 | -1.1 | 1 |
| ULAS J1319+1209 | 13 19 43.77 | 12 09 00.20 | 3 | 18.90 | 1.49 | 0.0 | -0.5 | -0.5 | 4 |
| ULAS J1320+1029 | 13 20 48.12 | 10 29 10.60 | 3 | 17.82 | 1.15 | -0.07 | -0.3 | -0.4 | 4 |
| ULAS J1501+0822 | 15 01 35.33 | 08 22 15.20 | 1 | 18.32 | 1.4 | 0.02 | -0.23 | -0.21 | 1 |
| Hip 73786B | 15 04 57.66 | 05 38 00.80 | - | 16.59 | 1.05 | -0.46 | -0.4 | -0.82 | 3 |
| ULAS J2320+1448 | 23 20 35.28 | 14 48 29.80 | - | 16.79 | 1.35 | -0.35 | -0.26 | -0.61 | 4 |
3 Near-infrared photometry
The near infrared photometry for our selected objects is summarised in Table 1, the bulk of the which has been published in Burningham et al. (2010) and references therein, where exposure times and observing conditions may also be found. All photometry is presented on the Mauna Kea Observatories (MKO) system (Tokunaga et al. 2002). The full co-ordinates of all objects are show in Table 1, along with references to their discovery papers.
Our photometry for Hip 73786B is derived from our spectroscopy. Hip 73786B was observed using the Wide Field CAMera (WFCAM; Casali et al. 2007) on UKIRT, on 12 July 2009(UT), with a seeing of 1.2 arcseconds. The object was imaged in and using a 3-point jitter-pattern with 2x2 microstepping. Each individual exposure was 10 seconds. The object was observed in and with two sets of 5-point jitter patterns at an individual exposure of 10 seconds, with 2x2 microstepping. This led to a total exposure in each band of 400 seconds. The data were processed using the WFCAM pipeline by the Cambridge Astronomical Surveys Unit (Irwin et al. 2004), and archived at the WFCAM Science Archive (Hambly et al. 2008).
4 Spectroscopy
4.1 New spectra
Hip 73786B and ULAS J2320+1448 represent previously-unpublished spectra. The sources for previously published spectroscopy are summarised in Table 1.
ULAS J2320+1448 was observed on the Near InfraRed Imager and Spectrometer (NIRI; see Hodapp et al. 2003) on the Gemini-North telescope to obtain deeper , and band spectra on 22 August 2008, 12 October 2008 and 14 October 2008 (UT) respectively. These data were reduced using standard NIRI IRAF packages. The images were flat fielded, masked for bad pixels and median stacked. A dispersion solution was fitted using the arc spectra. The method used was in common with that used in Burningham et al. (2010).The target was observed at an airmass of 1.01, with an integration time of 750s. The resulting spectrum has an average resolution of .
To gain a higher signal-to-noise ratio, the short -band discovery spectrum was combined with the new deep -band spectrum, using a weighted average. The , and -band spectra were then scaled by photometry to place them on a common flux scale before combining them to produce a flux-calibrated spectrum.
Hip 73786B was observed on the InfraRed Camera and Spectrograph (IRCS; Kobayashi et al. 2000) on the Subaru telescope on Mauna Kea to obtain R and spectra on the nights of 7th May 2009 and 30th December 2009 respectively. The data were sky subtracted using generic IRAF tools, and median stacked. An arc frame was used to fit a dispersion solution. The spectra were then extracted and cosmic rays and bad pixels were removed using a sigma-clipping algorithm.
Telluric correction was achieved by dividing each extracted target spectrum by that of an F4V star, which was observed just after the target and at a similar airmass. Prior to division, hydrogen lines were removed from the standard star spectrum by interpolating the stellar continuum. Relative flux calibration was then achieved by multiplying through by a blackbody spectrum of the appropriate . The and spectra were then joined using the overlap region between 1.43m and 1.63m in the -band to place the spectra on a common flux scale. The overlap region covers a wide range and includes the -band peak. As a test of the merger, spectrophotometric colours were computed from the merged spectrum, and these were found to be entirely in agreement with the photometry.
4.2 Spectral types
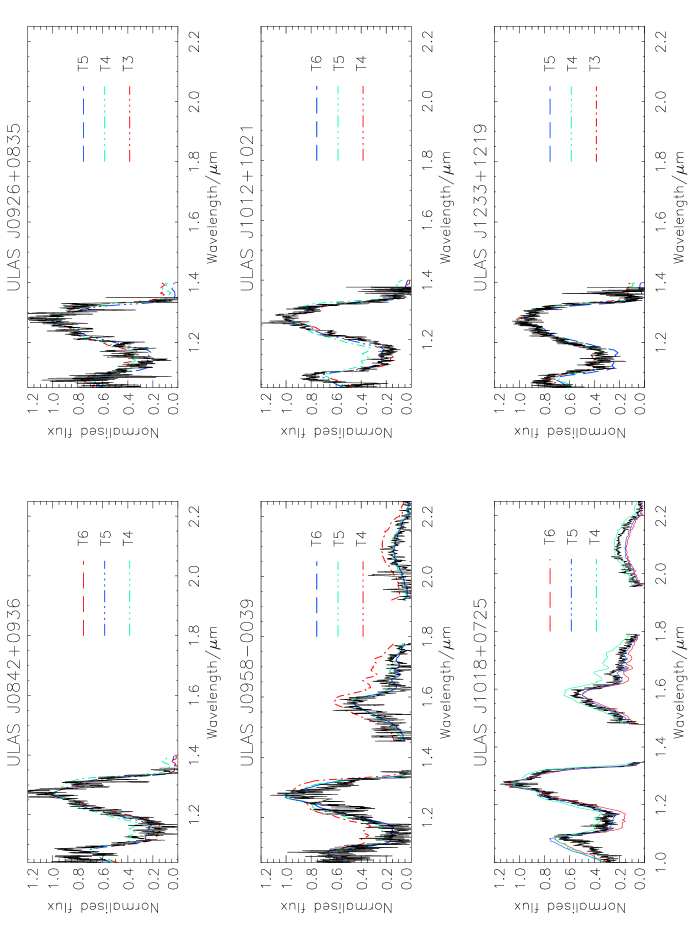
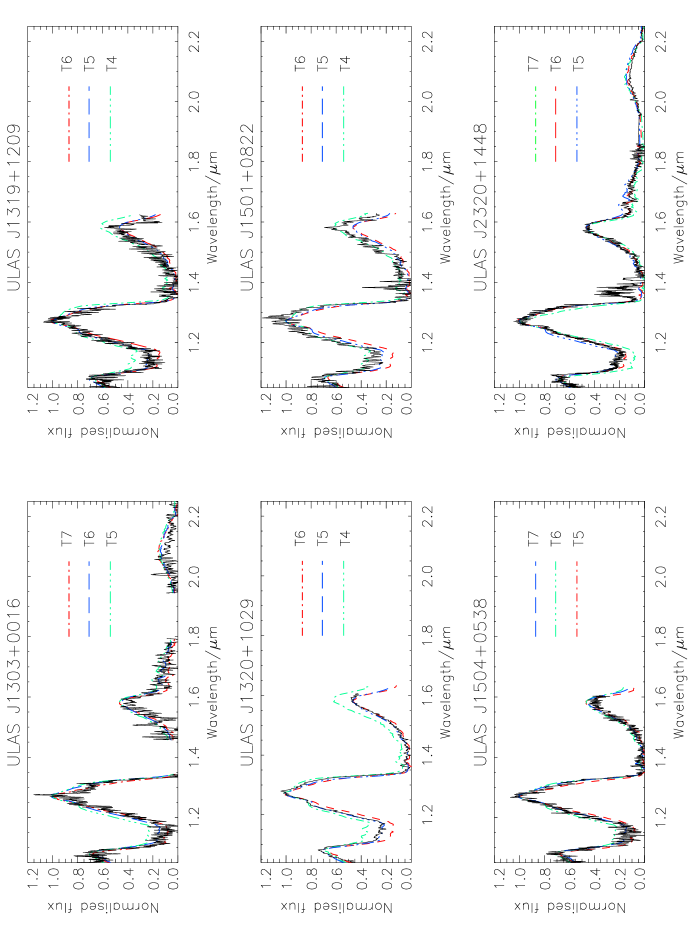
Objects were typed using their indices and comparisons to template spectra, following the general procedures set out in Burgasser et al. (2006). In brief, these indices target absorption bands of H2O and CH4 in the -, - and -bands, which have been found to correlate with near-infrared spectral type. The template spectra used here are those indicated in Burgasser et al. (2006) and references therein. Typing was conducted through a two-stage process. First, an index-based type was arrived at, using the and (where available) the -band indices, by taking the median of these values. Then, independently, a type was arrived at by plotting the object spectrum against an appropriate range of standard spectra, and visually inspecting the plot to see which the object matches most closely. Figure 5 and Figure 6 show the closest-matching template spectra for each object. A type is derived from the index values by taking their median. This is then averaged with the template spectrum type; the advantage of this process is that it accounts for both broad spectral structure and also for index-based measurements.
Only the indices in the - and -bands have been used for the purpose of typing the T dwarfs in this study, as unusual -band spectroscopic morphology is one of the defining characteristics by which they were selected, potentially invalidating the use of this spectral region as a means of obtaining spectral types consistent with those for normal T dwarfs. In addition, we do not have -band spectra for all objects. Therefore it was felt acceptable to neglect the -bands for spectral-typing purposes. However the index values are shown in Table 2 for reference. This table also summarises the bands used in our typing and the template spectra that were selected. Spectra for all candidates are plotted in figures Figure 5 and Figure 6.
In cases where spectroscopy is available over the full region, the uncertainties in our types are subtypes. However, for some objects we only have -band data or -data. Also, our comparison template spectra allow us to type an object to subtype accuracy, not . Therefore we have rounded our accuracies to subtype, although index types themselves are generally more accurate.
| Object | Median | Template | Adopted | |||||
|---|---|---|---|---|---|---|---|---|
| type | spectrum | type | ||||||
| ULAS J0842+0936 | 0.17 (T5/T6) | 0.35 (T5/T6) | T5.5 | T6 | T6 | |||
| ULAS J0926+0835 | 0.32 (T4/T5) | 0.53 (T3/T4) | T4 | T4 | T4 | |||
| ULAS J0958-0039 | 0.16 (T6) | 0.34 (T6) | 0.39 (T4) | 0.41 (T5) | 0.14 (T6) | T6 | T6 | T6p |
| ULAS J1012+1021 | 0.202 (T5) | 0.366 (T5) | T5 | T6 | T5.5 | |||
| ULAS J1018+0725 | 0.36 (T4) | 0.44 (T5) | 0.38 (T4) | 0.45 (T5) | 0.15 (T6) | T5 | T5 | T5 |
| ULAS J1233+1219 | 0.365 (T4) | 0.528 (T3) | T3.5 | T4 | T4 | |||
| ULAS J1303+0016 | 0.11 (T7) | 0.32 (T6) | 0.34 (T5) | 0.37 (T5) | 0.03 (T7) | T6 | T6 | T6p |
| ULAS J1319+1209 | 0.233 (T5) | 0.322 (T6) | 0.45 (T3/T4) | T5 | T5 | T5 | ||
| ULAS J1320+1029 | 0.247 (T5) | 0.479 (T4) | 0.318 (T6) | T5 | T5 | T5 | ||
| ULAS J1501+0822 | 0.29 (T5) | 0.43 (T5) | 0.41 (T5) | T5 | T4 | T4.5 | ||
| Hip 73786B | 0.127 (T6/T7) | 0.383 (T5) | 0.307 (T6) | 0.355 (T5/T6) | 0.45 (T3) | T5.5 | T6 | T6p |
| ULAS J2320+1448 | 0.206 (T5) | 0.396 (T5) | 0.303 (T6) | 0.292 (T6) | 0.172 (T6) | T6 | T6 | T6 |
4.3 Notes on unusual objects
Some objects show a large scatter in their indices, sometimes varying by as much as three subtypes between indices. This can be seen in Table 2, where the type inferred from each index is shown in parentheses after the value.
Objects with -early peculiarity (Burningham et al. 2010) have a index at least 2 subtypes earlier than the index. Amongst our objects, ULAS J0958-0039 displays this behaviour, with an assigned type of T6 and a type of T4 and a type of T6. ULAS J1303+0016 also shows this behaviour. There is an additional borderline case, ULAS J1319+1209, which has a type of T5 and a type of T3/T4.
It is possible that the cause for these peculiarities may lie in the physics of low-metallicity or high surface gravity atmospheres. However we do not see this behaviour consistently across our sample, and anyway without derived metallicities or surface gravities for our objects it is not currently possible to evaluate this idea. Binarity has been ruled out as possible cause, however (Burningham et al. 2010).
Lastly, ULAS J1018+0725 shows some differences both from the standards and from the rest of the sample. Its -band peak is narrower relative to the standards and there is less flux bluewards of 1.1m. Also, its -band peak actually appears enhanced relative to the standards. These may in fact be evidence of high metallicity and/or low gravity, as suggested in Lodieu et al. (2007). Its , which is not particularly blue relative to the rest of the sample. Given the error on its colours, it may be a higher-metallicity object that has scattered into our colour-selection area.
5 Distance estimates
The distances of the candidates were estimated using the relationships between spectral types and absolute magnitudes from Marocco et al. (2010). The -band was used for distance estimates, as it is considered least affected by gravity or metallicity. The results are summarised in Table 4. The relationship used is not based on metal-poor T dwarfs. Metallicity effects may change the absolute magnitudes of T dwarfs in the -band. However, we continue to use the Marocco et al. (2010) relationships, making the working assumption that they are applicable. Errors on the distances were estimated using the uncertainties in spectral type, the uncertainties in -band magnitude and the scatter in the relation.
| Name | UKIDSS date | Epoch diff | Follow-up | nref | T dwarf SNR | X,Y RMS | , | S1, S2 |
|---|---|---|---|---|---|---|---|---|
| (yr) | source | (pixels) | (mas yr-1) | (pixels) | ||||
| ULAS J0842+0936 | 2007/02/16 | 0.90603 | UFTI | 11 | 9.0, 33.3 | 0.111, 0.306 | -176, +36 | 5.1, 8.3 |
| ULAS J0926+0835 | 2007/01/22 | 1.02155 | EMMI | 17 | 6.6, 13.7 | 0.107, 0.156 | -472, -438 | 7.7, 8.4 |
| ULAS J0958-0016 | 2005/12/30 | 2.08705 | EMMI | 15 | 7.2, 17.9 | 0.148, 0.174 | +43, +31 | 4.1, 5.0 |
| ULAS J1012+1021 | 2007/12/02 | 0.61579 | WFCAM | 23 | 32.3, 43.5 | 0.085, 0.093 | -234, -631 | 4.4, 5.3 |
| ULAS J1018+0725 | 2005/12/28 | 1.05775 | UKIDSS | 26 | 18.2, 18.5 | 0.104, 0.120 | +181, +60 | 3.2, 3.2 |
| ULAS J1233+1219 | 2007/03/05 | 0.74209 | EMMI | 25 | 11.9, 22.2 | 0.105, 0.134 | +198, +168 | 3.0, 6.7 |
| ULAS J1303+0016 | 2005/06/12 | 4.01232 | UKIDSS | 23 | 4.9, 3.5 | 0.130, 0.106 | -18, -220 | 3.1, 4.2 |
| ULAS J1319+1209 | 2007/04/16 | 0.79740 | EMMI | 23 | 8.5, 12.9 | 0.089, 0.139 | -525, +111 | 5.2, 8.0 |
| ULAS J1320+1029 | 2007/02/25 | 1.17975 | EFOSC2 | 21 | 16.1, 8.3 | 0.151, 0.151 | +9, -60 | 5.2, 11.8 |
| ULAS J1501+0822 | 2006/07/23 | 0.61084 | LIRIS | 12 | 8.0, 12.5 | 0.310, 0.237 | -136, -113 | 8.5, 4.2 |
| Hip 73786B | 2008/04/17 | 1.23460 | WFCAM | 45 | 27.8, 20.4 | 0.095, 0.093 | -661, -510 | 4.8, 7.5 |
| ULAS J2320+1448 | 2008/06/27 | 7.83025 | SDSS | 14 | 18.9, 11.3 | 0.093, 0.104 | +399, +122 | 4.7, 2.2 |
6 Proper motions
The photometric follow-up observations that were carried out provided a second epoch of imaging data for each object. We used Image Reduction and Analysis Facility (IRAF; see Tody 1986) task GEOMAP to derive spatial transformations into the UKIDSS LAS -band image for each object, based on the positions of reference stars identified in the follow-up and UKIDSS images. We used the IRAF package GEOMAP for the co-ordinate transformation. The fitting geometry used was general, with a polynomial function of order 3 in x and y. In every case the follow-up image was used as the reference image for the co-ordinate transform. Followup images were obtained from a variety of instruments, including the UKIRT Fast-Track Imager (UFTI; see Roche et al. 2003), the Long-slit Intermediate Resolution Infrared Spectrograph (LIRIS; see Manchado et al. 2003), the Wide Field Infrared Camera For UKIRT (WFCAM; see Casali et al. 2007), the ESO Multi-Mode Instrument (EMMI; see Dekker et al. 1986) and the ESO Faint Object Spectrograph and Camera (EFOSC2; see Buzzoni et al. 1984).
We then transformed the pixel coordinates of the targets in the follow-up images into the LAS image, using GEOXYTRAN, and calculated their change in position (relative to the reference stars) between the two epochs.
The uncertainties associated with our proper motion measurement primarily come from the spatial transformations, and the accuracy with which we have been able to measure the position of the targets (by centroiding) in the image data. Then the instrument pixel scale was used in each case to convert the results into arcseconds. The UKIDSS -band pixel scale is 0.2 arcseconds per pixel. The dates of the observations were then used to calculate a proper motion. These results are summarised in Table 3.
Errors on proper motions were calculated by summing in quadrature the centroiding uncertainty and the RMS about the fit of the co-ordinate transform and the epoch difference. The uncertainty in the centroiding was estimated by obtaining the scatter of the centroids for a large number of simulated stellar images constructed using the observed signal-to-noise and seeing for each target observation. Centroiding uncertainties were calculated through simulated data with a Guassian PSF and with appropriate Poisson noise added. The availability and quality of the measured proper motions of the T dwarfs is affected by various factors including the time between epochs, the number of usable reference stars in the images and the S/N of both the T dwarf and the reference stars. The centroiding uncertainties (in pixels) varied between a minimum of 0.04 pixels for ULAS J1233+1219 and a maxmum of 2.38 pixels for ULAS J1320+1029. The mean value was 0.54 pixels.
ULAS J2320+1448 was measured with the method of Zhang et al. (2009), with its UKIDSS and SDSS images (SDSS; see York et al. 2000). Due to the much longer baseline, this has resulted in a lower error for this object’s proper motion compared to the rest of the sample.
| Name | Distance | Vtan | |||||
|---|---|---|---|---|---|---|---|
| (pc) | (km s-1) | (km s-1) | (km s-1) | (deg) | (deg) | (km s-1) | |
| ULAS J0842+0936 | 50 | 43 | 38 | -1 | 216.89 | 28.94 | 51 |
| ULAS J0926+0835 | 70 | 213 | 62 | -140 | 223.84 | 38.16 | 122 |
| ULAS J0958-0039 | 65 | 16 | 3 | -3 | 239.49 | 40.02 | 32 |
| ULAS J1012+1021 | 28 | 89 | -1 | -87 | 229.37 | 49.09 | 52 |
| ULAS J1018+0725 | 44 | 39 | -16 | 5 | 234.27 | 48.75 | 43 |
| ULAS J1233+1219 | 50 | 62 | -11 | 45 | 286.16 | 74.61 | 81 |
| ULAS J1303+0016 | 67 | 70 | -20 | -68 | 309.34 | 63.00 | 39 |
| ULAS J1319+1209 | 75 | 192 | 183 | -92 | 328.20 | 73.62 | 192 |
| ULAS J1320+1029 | 46 | 13 | 0 | -21 | 326.89 | 71.98 | 19 |
| ULAS J1501+0822 | 60 | 51 | 12 | -61 | 7.70 | 53.97 | 41 |
| Hip 73786B | 22 | 87 | -48 | -75 | 4.90 | 51.66 | 62 |
| ULAS J2320+1448 | 24 | 48 | 55 | -20 | 92.45 | -42.62 | 57 |
7 Kinematics
We have estimated tangential velocities for our targets using the proper motion and distance estimates, listed in Table 4. Errors in tangential velocity and and were estimated using a Monte Carlo script, accounting for errors in proper motion and in the distance estimates. The Monte Carlo used 10000 loop iterations per object.
Two objects were found to have greater than 100 km s-1, suggestive of halo kinematics: ULAS J0926+0835 with km s-1 and ULAS J1319+1209 with km s-1.
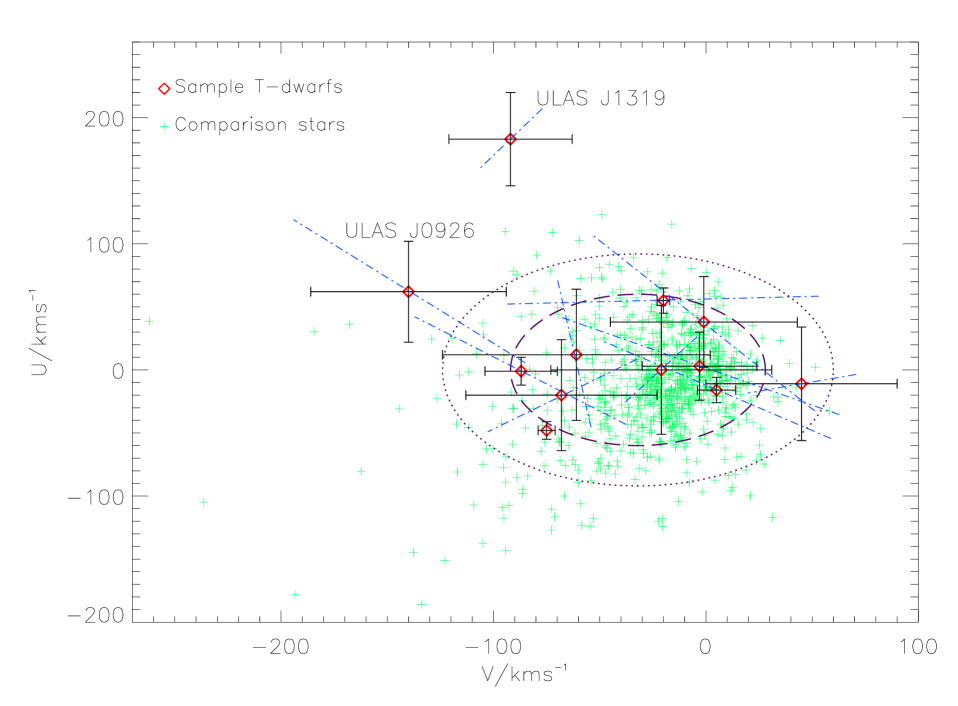
As the LAS is oriented out of the galactic plane, some insight can be gained into our targets’ and space velocity components. For targets at high galactic latitudes, the radial velocity will consist mostly of motion, with small and components. Therefore, in such cases it is possible to assess and to some extent without having a radial velocity. So, for all objects, proper motions, distance and co-ordinates were transformed into components. This was done assuming for all objects except Hip 73786B, where the values for Hip 73786A were used. The results are summarised in Table 4. The results are also displayed in Figure 2. The scheme we have used is a left-handed one, such that is positive toward the galactic anti-centre and positive in the direction of galactic rotation. To account for the possible effects of radial velocity, we have also calculated and for each object for the possibilities of and km s-1. This is shown in Figure 2 by the blue dot-dashed lines running through each object.
Four objects (ULAS J1233+1219, ULAS J1303+0016, ULAS J1319+1209 and ULAS J1320+1029) have degrees, and their and values are the best constrained in our study. Of these, ULAS J1233+1219 displays kinematics most likely to be young disc values, although its , error bars do extend beyond the outer disc ellipsoid. Unless its is outside the km s-1 indicated in Figure 2, these kinematics seem to argue against it being a halo object. If, it is not a halo object, then its blue near-infrared colours come as a surprise; ULAS J1233+1219 has the bluest in the entire sample (). This suggests a strongly-depressed -band and is notable in light of its apparently disc-like tangential velocity (although no -band spectrum has yet been obtained for this object). This situation is reminiscent of the only T dwarf known to be bluer in , SDSS J1416+1348B (see Burningham et al. 2010; Scholz 2010b), with . THe SDSS J1416+13AB system has velocities consistent with the young disc.
Reid et al. (2001) set the criterion that objects that satisfy
| (1) |
km s-1
are outside of the velocity region encompassing young and old-disc stars as described by Chiba & Beers (2000) and Reid et al. (2001). ULAS J0926+0835 and ULAS J1319+1209 satisfy this condition (see Table 4), further highlighting their likely halo membership.
Two objects stand out on Figure 2 as halo candidates. ULAS J1319+1209 has and (, km s-1) that place it somewhat outside the 2 disc ellipsoid. Also, due to its high galactic latitude, there is little contribution to these from radial velocity. ULAS J0926+0835 has a more poorly-constrained and , but may also be halo-like, with , km s-1. The km s-1 line for ULAS J0926+0835 intersects the disk rings, unlike ULAS J1319+1209. This means that ULAS J1319+1209 is the stronger halo candidate. The weaknesses associated with ULAS J0926+0835’s candidature also highlights the need for radial velocities for these objects.
Of the remaining objects, the and components seem most likely to be within the young-disc range, including ULAS J1018+0725 (which supports its interpretation as a metal-rich object that has scattered into the sample). However, with the exception of Hip 73786B, the possibility of large radial velocity components for these objects prevents us from ruling them out as halo candidates.
It is interesting to note that our strongest halo candidates do not appear to be the bluest objects in the sample. In , six other objects show a bluer colour but have more modest and apparently disc-like and . At any given spectral type, the combined effect of greater age (and thus higher gravity) and lower metallicity should result in bluer colours for substellar halo members than for the members of the younger disc population. Surprisingly, for both of our kinematic halo candidates several objects of similar spectral type are seen to be 2 bluer in . However, better photometry would be required to confirm this trend for our halo candidates.
8 Hip 73786A and B
| Property | Value |
| R.A. (J2000.0) | 15:04:53.5267 |
| Dec. (J2000.0) | +05:38:17.150 |
| Distance (pc) | 19.2 |
| Spectral type | K5b |
| Teff/K | 4450 |
| log | 4.80 |
| -0.30 | |
| /mag | 11.16 |
| /mag | 9.85d |
| /mag | 9.0 |
| /mag | 8.2 |
| /mag | 7.26 |
| /mag | 6.66 |
| /mag | 6.47 |
| /mas yr-1 | -606.8 |
| /mas yr-1 | -507.6 |
| /km s-1 | -68 |
| /km s-1 | -48 |
| /km s-1 | -75 |
| /km s-1 | -44 |
| a: Perryman et al. (1997) | |
| b: Cenarro et al. (2007) | |
| c: Weis (1993) | |
| d: Evans (1967) | |
| e: Monet et al. (2003) | |
| f: Cutri et al. (2003) - 2MASS point-source catalogue | |
| g: Barbier-Brossat & Figon (2000) | |
Scholz (2010a) identified Hip 73786B as a common proper motion companion to Hip 73786, a K5 dwarf at a distance of 19.2pc (Perryman et al. 1997). Our search for blue T dwarfs and kinematic analysis also independently identified this pair, and for completeness we describe our analysis below.
We find mas yr-1 and mas yr-1 for Hip 73786B. These values are consistent with both Scholz (2010a) and with Hip 73786. Thus we concur that the two objects share common motion.
We consider the possibility that the two components of Hip 73786B and Hip 73786A are simply randomly aligned on the sky with the same proper motions. To control for this, we use the method of Day-Jones et al. (2008). This was begun by taking objects with proper motions (10 mas yr-1) from SuperCOSMOS in a square degree of sky surrounding Hip 73786B. In this region of sky 29,249 objects had proper motions. We then placed these onto a colour-magnitude diagram ( vs ) and selected only those with a consistent magnitude to be at a common distance with Hip 73786B. Thirty-nine objects had colours and magnitudes consistent with being at the same distance as our T dwarf. We then placed these objects on a vector point diagram and compared their proper motion to that of Hip 73786B. None of the thirty-nine objects had proper motions consistent to within 2 of our T dwarf, suggesting that the likely contamination of objects with the same distance and proper motion to Hip 73786B is 1/39.
We next calculated the associated volume of space in which we could observe contaminant objects. Allowing for the possibility of unresolved binarity we can estimate a liberal range of plausible distances to the T dwarf as 18-31 pc. Considering the separation of 63.8″, we estimate that the pair of objects share a volume of pc3. As Hip 73786 is a K5 star, we consider the number density of K type stars, which is 0.0384 pc-3 (McCuskey 1983). Therefore we would expect to observe K-type stars within this volume. Overall then, the chance of a spurious common proper motion main sequence companion to Hip 73786B is 10-4. Indeed, we would expect such spurious companions amongst the entire, 200 strong, sample of published T dwarfs. We thus consider that Hip 73786B and Hip 73786A are a genuinely associated system of common origin, confirming the analysis of Scholz (2010a)
The two objects’ apparent separation is . At a distance of 19.2 pc this corresponds to a projected separation of AU. Considering also the probabilities discussed above, we assume that the two objects share a common origin, being either a binary or a co-moving pair. We also posit the working assumption that common formation history implies a common composition between Hip 73786A and Hip 73786B, allowing for tighter constraints on the T dwarf’s physical characteristics.
Hip 73786 is known to have a metallicity of (Cenarro et al. 2007), clearly identifying it as a metal-poor star. Although this metallicity remains within the young-disc range of to (Nissen 1999), nonetheless this would suggest that Hip 73786B represents a new metal-poor T dwarf benchmark.
As Hip 73786A has a radial velocity = -68 km s-1 (Barbier-Brossat & Figon 2000), space motion components were calculated. We find that km s-1, and .
Hip 73786A shows some evidence of chromospheric activity. Gray et al. (2003) list a value of for the primary. Mamajek & Hillenbrand (2008) gives a relationship between and stellar age. Using this and the value from Gray et al. (2003), we find an age of 2.0 Gyr for Hip 73786A. However, several factors can affect . Henry et al. (1996) list binarity as one such factor, and there is a suggestion in Luyten (1979) that Hip 73786A may itself be a close binary, although no other references exist to support this. Also, with regard to our Sun, the value of varies depending on the point in the solar cycle at which it is measured. The Sun can vary between an estimated extreme of -5.10 during solar minimum to a peak of -4.75 during solar maximum (Henry et al. 1996). These fluctuations correspond to an age in the range of 2.2 to 8.0 Gyr, as opposed to the actual value of 5 Gyr. With only one available measurement, it is unknown whether or not Hip 73786A presents a similar activity cycle. If it does, then the example of the Sun shows that the age of the Hip 73786 system may be different from the estimated value.
Another possible source of uncertainty here is that Jenkins et al. (2008) find an offset of 0.1 dex between their analysis of typical FGK dwarfs and those of Gray et al. Jenkins et al. also show this offset is present in cross-matched samples of FGK stars between Gray et al. and Henry et al. Since this appears to be a systematic offset we can apply this correction to the value of Hip 73786A found by Gray et al. Using this correction would suggest a for Hip 73786A, which in turn feeds through to an age estimate of Gyr, slighter lower than the adopted age if we accept the Gray et al. value at face value.
Holmberg et al. (2009) find a mean for stars older than 4.0 Gyr. The age-velocity relation they find would also suggest an age 8 Gyr for the Hip 73786 system. These factors may suggest an older age than the one we derive through chromospheric activity. However, both of these relations are subject to a large amount of scatter and kinematic relations are best applied to populations, not individual objects. The metallicity could also be consistent with an age below 4.0 Gyr, which limits the usefulness of this property for age detemination Therefore we suggest that the Hip 73786 system has a minimum age constraint of 1.6 Gyr, but we are currently unable to estimate an upper limit.
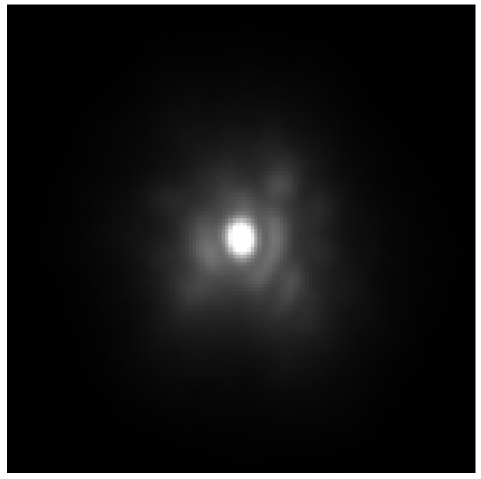
As a control for the possibility of binarity, high-resolution imaging was undertaken for Hip 73786A. Observations were carried out with FastCam, the ’Lucky Imaging’ facility (Oscoz et al. 2008) installed as a common-user instrument on the Carlos Sánchez Telescope in the Teide Observatory, Tenerife, Canary Islands. FastCam is equipped with a low read-out noise L3CCD Andor 512512 camera with a pixel scale of 42.2 milli-arcsec (mas), yielding a field-of-view of approximately 21.6 by 21.6 arcsec.
HIP 73786 was observed on 24 July 2010 in the -band filter under a natural seeing of 1.0 arcsec, clear conditions, and full moon. The total exposure time was divided up into 1000 images of 50ms repeated five times. The achieved resolution is of the order of 0.2 arcsec, corresponding to a projected physical separation of less than 4 AU, assuming a distance of 19 pc for the target (Perryman et al. 1997). The data reduction of the raw images was done with the automatic pipeline distributed by the FastCam team and developed by the Universidad Polytécnica de Cartagena111Details on FastCam at http //www.iac.es/proyecto/fastcam/. This reduction involves bias and flat-field correction and the best 15% exposures were selected to achieve a near to diffraction-limited image. From this analysis we find no companion at the observed resolution around HIP 73786 down to 4-5 mag at a separation of 1 arcsec from the target.
9 Summary
We present data for twelve UKIDSS T dwarfs, including 11 from DR4 and one object from DR5. We use follow-up data to compute proper motions and tangential velocities, and find a range of values, ULAS J0926+0835 and ULAS J1319+1209 with km s-1, which may be indicative of halo kinematics. Confirmation or definitive rejection of these objects will need measurements of and calculation of full space motions.
Spectra are presented for all candidates. Spectral typing is undertaken on all of them using the scheme of Burgasser et al. (2006). A subtype variance is noted on the indices of some of our objects.
Hip 73786B from UKIDSS DR5 is confirmed to be associated with the K5 dwarf Hip 73786A, and we find it to be a T6p dwarf. Hip 73786B is found to be at least Gyr old, constrained by chromospheric activity in the primary. As Hip 73786A is known to be of low metallicity, this system represents and important addition to the sample of T dwarf benchmark systems. We note that one object (ULAS J1018+0725) appears to be a metal-rich or low-gravity, disc dwarf that has scattered into our sample. Of the rest, we find two objects with strong kinematic evidence of halo membership (ULAS J0926+0835 and ULAS J1319+1209). Most interestingly we note that our bluest objects are not the best halo candidates, although the current velocity and colour uncertainties means this observation is only suggestive and must be verified with more precise proper motion and radial velocity measurements.
10 Acknowledgements
This work has benefited from data from the UKIRT Infrared Deep Sky Survey (http://surveys.roe.ac.uk/wsa/pre/index.html).
This research has benefited from the SpeX Prism Spectral Libraries, maintained by Adam Burgasser at http://www.browndwarfs.org/spexprism
This research has made use of the SIMBAD database, operated at CDS, Strasbourg, France.
Funding for the SDSS and SDSS-II has been provided by the Alfred P. Sloan Foundation, the Participating Institutions, the National Science Foundation, the U.S. Department of Energy, the National Aeronautics and Space Administration, the Japanese Monbukagakusho, the Max Planck Society, and the Higher Education Funding Council for England. The SDSS Web Site is http://www.sdss.org/.
The SDSS is managed by the Astrophysical Research Consortium for the Participating Institutions. The Participating Institutions are the American Museum of Natural History, Astrophysical Institute Potsdam, University of Basel, University of Cambridge, Case Western Reserve University, University of Chicago, Drexel University, Fermilab, the Institute for Advanced Study, the Japan Participation Group, Johns Hopkins University, the Joint Institute for Nuclear Astrophysics, the Kavli Institute for Particle Astrophysics and Cosmology, the Korean Scientist Group, the Chinese Academy of Sciences (LAMOST), Los Alamos National Laboratory, the Max-Planck-Institute for Astronomy (MPIA), the Max-Planck-Institute for Astrophysics (MPA), New Mexico State University, Ohio State University, University of Pittsburgh, University of Portsmouth, Princeton University, the United States Naval Observatory, and the University of Washington.
This work has partly been based on observations obtained at the Gemini Observatory, which is operated by the Association of Universities for Research in Astronomy, Inc., under a cooperative agreement with the NSF on behalf of the Gemini partnership: the National Science Foundation (United States), the Science and Technology Facilities Council (United Kingdom), the National Research Council (Canada), CONICYT (Chile), the Australian Research Council (Australia), Ministério da Ciência e Tecnologia (Brazil) and Ministerio de Ciencia, Tecnología e Innovación Productiva (Argentina).
This work has partly been based in part on data collected at Subaru Telescope, which is operated by the National Astronomical Observatory of Japan.
David Murray is supported by a Science and Technology Facilities Council studentship.
Dr. A.C. Day-Jones is funded by a Fondecyt fellowship.
Dr. Nicholas Lodieu acknowledges funding from the Spanish Ministry of Science and Innovation through the Ramón y Cajal fellowship number 08-303-01-02.
References
- Abazajian et al. (2003) Abazajian K., Adelman-McCarthy J. K., Agüeros M. A., Allam S. S., Anderson S. F., et al. 2003, AJ, 126, 2081
- Barbier-Brossat & Figon (2000) Barbier-Brossat M., Figon P., 2000, A&AS, 142, 217
- Bowler et al. (2010) Bowler B. P., Liu M. C., Dupuy T. J., 2010, ApJ, 710, 45
- Burgasser et al. (2006) Burgasser A. J., Burrows A., Kirkpatrick J. D., 2006, ApJ, 639, 1095
- Burgasser et al. (2002) Burgasser A. J., Kirkpatrick J. D., Brown M. E., Reid I. N., Burrows A., Liebert J., et al 2002, ApJ, 564, 421
- Burgasser et al. (2003) Burgasser A. J., Kirkpatrick J. D., Burrows A., Liebert J., Reid I. N., Gizis J. E., McGovern M. R., et al 2003, ApJ, 592, 1186
- Burgasser et al. (2009) Burgasser A. J., Lépine S., Lodieu N., Scholz R., Delorme P., Jao W., et al. 2009, in E. Stempels ed., American Institute of Physics Conference Series Vol. 1094 of American Institute of Physics Conference Series, Ultracool Subdwarfs: The Halo Population Down to the Substellar Limit. pp 242–249
- Burgasser et al. (2010a) Burgasser A. J., Looper D., Rayner J. T., 2010a, AJ, 139, 2448
- Burgasser et al. (2010b) Burgasser A. J., Looper D., Rayner J. T., 2010b, AJ, 139, 2448
- Burgasser et al. (2004) Burgasser A. J., McElwain M. W., Kirkpatrick J. D., Cruz K. L., Tinney C. G., Reid I. N., 2004, AJ, 127, 2856
- Burningham et al. (2010) Burningham B., Leggett S. K., Lucas P. W., Pinfield D. J., Smart R. L., Day-Jones A. C., Jones H. R. A., et al. 2010, MNRAS, pp 1952–1961
- Burningham et al. (2010) Burningham B., Pinfield D. J., Lucas P. W., Leggett S. K., Deacon N. R., Tamura M., Tinney C. G., et al. 2010, MNRAS, 406, 1885
- Burrows et al. (2001) Burrows A., Hubbard W. B., Lunine J. I., Liebert J., 2001, Reviews of Modern Physics, 73, 719
- Buzzoni et al. (1984) Buzzoni B., Delabre B., Dekker H., Dodorico S., Enard D., Focardi P., Gustafsson B., Nees W., Paureau J., Reiss R., 1984, The Messenger, 38, 9
- Casali et al. (2007) Casali M., Adamson A., Alves de Oliveira C., Almaini O., Burch K., Chuter T., Elliot J., et al 2007, A&A, 467, 777
- Cenarro et al. (2007) Cenarro A. J., Peletier R. F., Sánchez-Blázquez P., Selam S. O., Toloba E., Cardiel N., Falcón-Barroso J., et al 2007, MNRAS, 374, 664
- Chiba & Beers (2000) Chiba M., Beers T. C., 2000, AJ, 119, 2843
- Cutri et al. (2003) Cutri R. M., Skrutskie M. F., van Dyk S., Beichman C. A., Carpenter J. M., Chester T., Cambresy L., et al. 2003, 2MASS All Sky Catalog of point sources.
- Day-Jones et al. (2008) Day-Jones A. C., Pinfield D. J., Napiwotzki R., Burningham B., Jenkins J. S., Jones H. R. A., Folkes S. L., et al. 2008, MNRAS, 388, 838
- Dekker et al. (1986) Dekker H., Delabre B., Dodorico S., 1986, in D. L. Crawford ed., Society of Photo-Optical Instrumentation Engineers (SPIE) Conference Series Vol. 627 of Society of Photo-Optical Instrumentation Engineers (SPIE) Conference Series, ESO’s Multimode Instrument for the Nasmyth focus of the 3.5 M New Technology Telescope. pp 339–348
- Delorme et al. (2008) Delorme P., Willott C. J., Forveille T., Delfosse X., Reylé C., Bertin E., Albert L., et al. 2008, A&A, 484, 469
- Evans (1967) Evans D. S., 1967, in A. H. Batten & J. F. Heard ed., Determination of Radial Velocities and their Applications Vol. 30 of IAU Symposium, The Revision of the General Catalogue of Radial Velocities. pp 57–+
- Feltzing & Gustafsson (1998) Feltzing S., Gustafsson B., 1998, A&AS, 129, 237
- Gizis (1997) Gizis J. E., 1997, AJ, 113, 806
- Gray et al. (2003) Gray R. O., Corbally C. J., Garrison R. F., McFadden M. T., Robinson P. E., 2003, AJ, 126, 2048
- Hambly et al. (2008) Hambly N. C., Collins R. S., Cross N. J. G., Mann R. G., Read M. A., Sutorius E. T. W., Bond I., et al 2008, MNRAS, 384, 637
- Henry et al. (1996) Henry T. J., Soderblom D. R., Donahue R. A., Baliunas S. L., 1996, AJ, 111, 439
- Hodapp et al. (2003) Hodapp K. W., Jensen J. B., Irwin E. M., Yamada H., Chung R., Fletcher K., Robertson L., et al 2003, PASP, 115, 1388
- Holmberg et al. (2009) Holmberg J., Nordström B., Andersen J., 2009, A&A, 501, 941
- Irwin et al. (2004) Irwin M. J., Lewis J., Hodgkin S., Bunclark P., Evans D., McMahon R., Emerson J. P., et al. 2004, in P. J. Quinn & A. Bridger ed., Society of Photo-Optical Instrumentation Engineers (SPIE) Conference Series Vol. 5493 of Society of Photo-Optical Instrumentation Engineers (SPIE) Conference Series, VISTA data flow system: pipeline processing for WFCAM and VISTA. pp 411–422
- Jenkins et al. (2008) Jenkins J. S., Jones H. R. A., Pavlenko Y., Pinfield D. J., Barnes J. R., Lyubchik Y., 2008, A&A, 485, 571
- Knapp et al. (2004) Knapp G. R., Leggett S. K., Fan X., Marley M. S., Geballe T. R., Golimowski D. A., Finkbeiner D., et al. 2004, AJ, 127, 3553
- Kobayashi et al. (2000) Kobayashi N., Tokunaga A. T., Terada H., Goto M., Weber M., Potter R., Onaka P. M., et al 2000, in M. Iye & A. F. Moorwood ed., Society of Photo-Optical Instrumentation Engineers (SPIE) Conference Series Vol. 4008 of Society of Photo-Optical Instrumentation Engineers (SPIE) Conference Series, IRCS: infrared camera and spectrograph for the Subaru Telescope. pp 1056–1066
- Kuiper (1939) Kuiper G. P., 1939, ApJ, 89, 548
- Lawrence et al. (2007) Lawrence A., Warren S. J., Almaini O., Edge A. C., Hambly N. C., Jameson R. F., Lucas P., et al. 2007, MNRAS, 379, 1599
- Leggett et al. (2007) Leggett S. K., Marley M. S., Freedman R., Saumon D., Liu M. C., Geballe T. R., et al 2007, ApJ, 667, 537
- Lenzuni et al. (1991) Lenzuni P., Chernoff D. F., Salpeter E. E., 1991, ApJS, 76, 759
- Liebert & Burgasser (2007) Liebert J., Burgasser A. J., 2007, ApJ, 655, 522
- Linsky (1969) Linsky J. L., 1969, ApJ, 156, 989
- Liu et al. (2007) Liu M. C., Leggett S. K., Chiu K., 2007, ApJ, 660, 1507
- Lodieu et al. (2007) Lodieu N., Pinfield D. J., Leggett S. K., Jameson R. F., Mortlock D. J., Warren S. J., et al. 2007, MNRAS, 379, 1423
- Lodieu et al. (2010) Lodieu N., Zapatero Osorio M. R., Martín E. L., Solano E., Aberasturi M., 2010, ApJ, 708, L107
- Luyten (1979) Luyten W. J., 1979, LHS Catalogue. Second edition.
- Mamajek & Hillenbrand (2008) Mamajek E. E., Hillenbrand L. A., 2008, ApJ, 687, 1264
- Manchado et al. (2003) Manchado A., Manchado A., Barreto M., Acosta-Pulido J., Prada F., Domínguez-Tagle C., Correa S., et al 2003, in J. M. Rodriguez Espinoza, F. Garzon Lopez, & V. Melo Martin ed., Revista Mexicana de Astronomia y Astrofisica Conference Series Vol. 16 of Revista Mexicana de Astronomia y Astrofisica Conference Series, LIRIS (Long-slit Intermediate Resolution Infrared Spectrograph) Project status. pp 43–45
- Marocco et al. (2010) Marocco F., Smart R. L., Jones H. R. A., Burningham B., Lattanzi M. G., Leggett S. K., Lucas P. W., et al 2010, A&A, 524, A38+
- McCuskey (1983) McCuskey S. W., 1983, AJ, 88, 1175
- McLean et al. (2007) McLean I. S., Prato L., McGovern M. R., Burgasser A. J., Kirkpatrick J. D., Rice E. L., Kim S. S., 2007, ApJ, 658, 1217
- Monet et al. (2003) Monet D. G., Levine S. E., Canzian B., Ables H. D., Bird A. R., Dahn C. C., Guetter H. H., et al. 2003, AJ, 125, 984
- Nakajima et al. (1995) Nakajima T., Oppenheimer B. R., Kulkarni S. R., Golimowski D. A., Matthews K., Durrance S. T., 1995, Nature, 378, 463
- Nissen (1999) Nissen P. E., 1999, Ap&SS, 267, 119
- Oscoz et al. (2008) Oscoz A., Rebolo R., López R., Pérez-Garrido A., Pérez J. A., Hildebrandt S., Rodríguez L. F., et al. 2008, in Society of Photo-Optical Instrumentation Engineers (SPIE) Conference Series Vol. 7014 of Society of Photo-Optical Instrumentation Engineers (SPIE) Conference Series, FastCam: a new lucky imaging instrument for medium-sized telescopes
- Perryman et al. (1997) Perryman M. A. C., Lindegren L., Kovalevsky J., Hoeg E., Bastian U., Bernacca P. L., Crézé M., et al 1997, A&A, 323, L49
- Pinfield et al. (2008) Pinfield D. J., Burningham B., Tamura M., Leggett S. K., Lodieu N., Lucas P. W., Mortlock D. J., et al. 2008, MNRAS, 390, 304
- Reid et al. (2001) Reid I. N., Sahu K. C., Hawley S. L., 2001, ApJ, 559, 942
- Reid (1998) Reid N., 1998, AJ, 115, 204
- Roche et al. (2003) Roche P. F., Lucas P. W., Mackay C. D., Ettedgui-Atad E., Hastings P. R., Bridger A., Rees N. P., et al 2003, in M. Iye & A. F. M. Moorwood ed., Society of Photo-Optical Instrumentation Engineers (SPIE) Conference Series Vol. 4841 of Society of Photo-Optical Instrumentation Engineers (SPIE) Conference Series, UFTI: the 0.8 - 2.5 m fast track imager for the UK infrared telescope. pp 901–912
- Santos et al. (2004) Santos N. C., Israelian G., Mayor M., 2004, A&A, 415, 1153
- Saumon et al. (1994) Saumon D., Bergeron P., Lunine J. I., Hubbard W. B., Burrows A., 1994, ApJ, 424, 333
- Saumon & Marley (2008) Saumon D., Marley M. S., 2008, ApJ, 689, 1327
- Schmidt et al. (2010) Schmidt S. J., West A. A., Burgasser A. J., Bochanski J. J., Hawley S. L., 2010, AJ, 139, 1045
- Scholz (2010a) Scholz R., 2010a, A&A, 515, A92+
- Scholz (2010b) Scholz R., 2010b, A&A, 510, L8+
- Soubiran et al. (2008) Soubiran C., Bienaymé O., Mishenina T. V., Kovtyukh V. V., 2008, A&A, 480, 91
- Tinney et al. (2005) Tinney C. G., Burgasser A. J., Kirkpatrick J. D., McElwain M. W., 2005, AJ, 130, 2326
- Tody (1986) Tody D., 1986, in D. L. Crawford ed., Society of Photo-Optical Instrumentation Engineers (SPIE) Conference Series Vol. 627 of Society of Photo-Optical Instrumentation Engineers (SPIE) Conference Series, The IRAF Data Reduction and Analysis System. pp 733–+
- Tokunaga et al. (2002) Tokunaga A. T., Simons D. A., Vacca W. D., 2002, PASP, 114, 180
- Vrba et al. (2004) Vrba F. J., Henden A. A., Luginbuhl C. B., Guetter H. H., Munn J. A., Canzian B., Burgasser A. J., et al. 2004, AJ, 127, 2948
- Warren et al. (2007) Warren S. J., Hambly N. C., Dye S., Almaini O., Cross N. J. G., Edge A. C., et al 2007, MNRAS, 375, 213
- Weis (1993) Weis E. W., 1993, AJ, 105, 1962
- York et al. (2000) York D. G., Adelman J., Anderson Jr. J. E., Anderson S. F., Annis J., Bahcall N. A., et al. 2000, AJ, 120, 1579
- Zhang et al. (2009) Zhang Z. H., Pokorny R. S., Jones H. R. A., Pinfield D. J., Chen P. S., Han Z., Chen D., et al. 2009, A&A, 497, 619