Comparing Spectral Models for ULXs with NGC 4517 ULX1
Abstract
We present the previously unanalysed high quality XMM-Newton spectrum of an ultraluminous X-ray source candidate in NGC 4517. As with other high quality ULX spectra, a downturn in the spectrum is observed at 6 . Both of the recent disc reflection and Comptonisation interpretations of this feature are applied, in order to present a direct comparison, and are found to provide statistically equivalent representations of the current data. We find that the reflection model requires the accretion disc to have a highly super-solar iron abundance, while the Comptonisation model requires low temperature Comptonising electrons, and for the corona to be optically thick. These physical requirements are discussed in detail, and physically motivated scenarios are highlighted in which each model can be considered a viable explanation for the observed emission. By extending our consideration of these two interpretations to high energies, we demonstrate that observations of ULXs at energies should be extremely useful when attempting to distinguish between them. With current instrumentation, it is only viable to perform these observations for M 82 X-1, but future high angular resolution hard X-ray imaging spectrometers, such as the Hard X-ray Imaging System due to fly on Astro-H, should go a long way to resolving this issue.
keywords:
X-rays: binaries – black hole physics1 Introduction
Ultraluminous X-ray Sources (ULXs), discovered with the Einstein observatory in the 1980s (Fabbiano 1989), are extra-nuclear point sources observed to be more luminous in X-rays than the Eddington luminosity for a stellar mass (10) black hole, i.e. erg s-1, a combination which has led to extended debate over the nature of these sources. The extremity of the observed luminosities implies that these sources are most likely to be accreting black holes of some kind.
There are currently three main theories to explain the apparent X-ray luminosities of ULXs. The first is that these sources are systems similar in nature to the less luminous X-ray binaries (XRBs) frequently observed, but in which the mass of the black hole is greater than the stellar-mass black holes that XRBs are expected to harbour. However, they must also be less massive than the supermassive black holes associated with active galactic nuclei (; SMBH), as dynamical friction dictates that such objects would sink to the centres of their respective galaxies well within a Hubble Time (Miller & Colbert 2004). In this case, ULXs are interpreted as intermediate mass black holes with (IMBH; Colbert & Mushotzky 1999). The second is that ULXs are actually the same systems as regular XRBs, but observed in a different accretion state in which the black hole is able to radiate at super-Eddington rates (for a recent review of the standard accretion states observed in XRBs see Remillard & McClintock 2006), and a number of methods have been proposed by which this might be possible (see e.g. Poutanen et al. 2007, Finke & Böttcher 2007).
The third again involves stellar-mass XRBs, but in this case the observed emission is not isotropic (King et al. 2001). ULXs may be such sources with which we have a favourable orientation, and as such artificially high luminosities are calculated for these sources based on the assumption of isotropic emission. Violation of the Eddington limit may be avoided by assuming a suitably high level of anisotropy. Such anisotropy could be due to geometrically thick accretion discs subtending a larger solid angle, funnelling the X-rays produced in the inner regions. Such ‘slim’ discs may also allow a compact object to radiate at super-Eddington rates (Abramowicz et al. 1980), so super-Eddington and anisotropic emission may be intrinsically linked. Alternatively anisotropic emission could manifest itself in the form of pencil-beam relativistic jets similar to those seen in other accreting sources (Reynolds et al. 1997). However, a number of ULXs have been observed to be embedded within (roughly) spherically symmetric photoionised emission nebulae inconsistent with narrow beaming (e.g. Pakull & Mirioni 2003, Kaaret et al. 2004, Berghea et al. 2010). This suggests highly anisotropic emission by itself seems unlikely to be able to explain ULXs as a class, although it cannot be ruled out in individual sources. For a more detailed review on the possible nature of ULXs see Roberts (2007).
Observationally it has been difficult to distinguish between the IMBH and stellar mass interpretations. ULXs are extragalactic sources hence detailed information on optical counterparts is still relatively rare, although this is being addressed, and orbital periods/parameters of the assumed binary system are even rarer still; attempts at dynamical measurements of the black hole mass are only now becoming possible for a small number of sources with the use of world leading observational facilities. Current examples of these attempts are limited to periodicity claims in M 82 X-1 (Kaaret & Feng 2007), NGC 1313 X-2 (Liu et al. 2009) and NGC 5408 X-1 (Strohmayer 2009), although in the latter case Foster et al. (2010) suggest the periodicity might be superorbital, related to jet precession. Much recent work has been focused on successfully modelling the X-ray spectral and timing properties of ULXs, as both the inner temperature of the accretion disc and characteristic timescales are mass dependent, proportional to and respectively (Makishima et al. 2000, Vaughan et al. 2003). Early results pointed towards an IMBH interpretation with modelled disc temperatures being cooler and characteristic timescales being longer than XRBs (see e.g. Miller et al. 2004; Strohmayer et al. 2007). However, a systematic study of the highest quality ULX X-ray spectra by Stobbart et al. (2006) showed the majority displayed a break/turnover at high energies (). Such breaks are not commonly seen in the spectra of XRBs.
Gladstone et al. (2009) argue that this turnover could be due to Comptonisation from an optically thick corona, which would shroud the inner regions of the accretion disc and artificially lower the inner temperatures obtained from simple spectral modelling. Under this assumption, the ‘true’ inner disc temperatures recovered are akin to those observed in XRBs. Most ULXs would then represent a new, high Eddington fraction accretion state for these stellar-mass black holes. An alternative explanation is proposed by Caballero-García & Fabian (2010) who note that in many cases the turnover occurs between 5-7. They demonstrate it could be due to a combination of the iron K emission line and absorption edge (6.4 and 7.1 respectively) in a relativistically blurred reflection spectrum from the inner accretion disc of a spinning black hole. Here ‘reflection’ refers to the backscattering and fluorescence of X-rays (George & Fabian 1991). In this case the excess soft emission often assumed to come directly from the accretion disc is also due to blurred reflection, so the disc is not actually observed, hence the inner temperature cannot be measured and the mass must be estimated by some other method. This explanation for the soft emission is conceptually similar to that proposed by Gonçalves & Soria (2006). Other explanations have also been proposed, often based on emission from the aforementioned slim discs in which advection of radiation from the inner disc reduces the observed luminosity from this region (Abramowicz et al. 1988), although these have not been as successful in reproducing the observed spectra (see e.g. attempts in Gladstone et al. 2009).
It is important to determine the origins of this curvature, as it is one of the properties of ULXs that distinguishes them from their less luminous XRB cousins. Here we present an XMM-Newton observation of a new ULX candidate located in NGC 4517 (hereafter NGC 4517 ULX1), which was brought to light during work on a new catalogue of ULX candidates in nearby galaxies (Walton et al. 2011, submitted). Both reflection and Comptonisation interpretations are applied during the spectral analysis and the models directly compared. The paper is structured as follows: section 2 details the data reduction, section 3 describes the spectral analysis, section 4 discusses and compares the two models, focusing on how they may be distinguished, and finally section 5 presents our conclusions.
2 Observations and Data Reduction
2.1 Host Galaxy
NGC 4517 (also known as NGC 4437) is an Sc type spiral galaxy located at RA = , Dec = ∘ with a distance of 18 (assuming km s-1 Mpc-1, , ; the redshift of NGC 4517 is )111The basic information for NGC 4517 presented here has been obtained from the NASA Extragalactic Database (NED); http://nedwww.ipac.caltech.edu/, and has an apparent edge-on orientation. Although it has received relatively little observational attention, its orientation has lead to NGC 4517 being a popular galaxy to include in studies of Globular Clusters (e.g. Goudfrooij et al. 2003 and Chandar et al. 2004), potentially important environments for the formation of IMBHs (see Noyola et al. 2008, and references therein) and hence possibly ULXs. Based on the diagnostic system of Kewley et al. (2006), Seth et al. (2008) find nuclear emission line ratios consistent with star formation being a significant source of energy within NGC 4517. Star forming regions are also important environments for ULX formation (Swartz et al. 2009). However, they also find evidence of AGN activity, and do not go as far as to provide a quantitative estimate for the star formation rate.
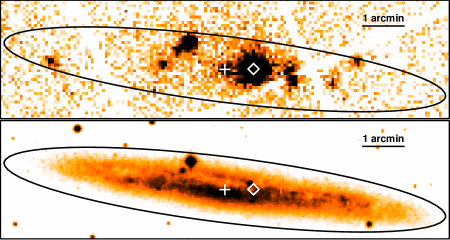
The only targeted X-ray observation of NGC 4517 was taken in December 2004 when it was observed with XMM-Newton (Jansen et al. 2001) for 114 , during which a number of X-ray point sources were detected within its isophote, as defined in the RC3 galaxy catalogue (de Vaucouleurs et al. 1991), including a point source at RA = , Dec = ∘, co-incident with the expected location of the galaxy nucleus. However, the brightest of these sources, with an observed (absorbed) X-ray luminosity of erg s-1 (assuming isotropic emission and that the association with NGC 4517 is correct), is NGC 4517 ULX1 (IAU ID: 2XMM J123242.7+000654), offset from the nucleus by 43 (see Fig. 1), with position RA = , Dec = ∘. It is this source that is the subject of this work. In contrast, the X-ray detection coincident with the galactic centre is observed to have a luminosity of only erg s-1. The X-ray detections of the ULX candidate and the nuclear source have position errors of 1.1” and 1.8” respectively (99 per cent confidence level), as quoted in the 2XMM Serendipitous Survey (Watson et al. 2009), while the NED position for the centre of NGC 4517 should be accurate to within 3.8”, so we may be confident NGC 4517 ULX1 is not associated with the nucleus of its host galaxy.
2.2 Data Reduction

The data reduction was carried out with the Science Analysis System (SAS v8.0.1) largely according to the standard prescription provided in the online guide222http://xmm.esac.esa.int/. The observation data files were processed using EPCHAIN and EMCHAIN to produce calibrated event lists for the EPIC-pn (Strüder et al. 2001) and EPIC-MOS (Turner et al. 2001) CCDs respectively. Lightcurves and spectra were produced for the 0.3–10.0 energy range selecting only single and double events (single to quadruple events) for EPIC-pn (EPIC-MOS) using XMMSELECT, and periods of high background were treated according to the method outlined by Piconcelli et al. (2004) with the signal-to-noise ratio maximised for the full considered energy band. A circular region of radius 29”/6.7 pix. centred on NGC 4517 ULX1 was defined in order to include as many source counts as possible without contamination from the nearby nuclear source or including CCD chip edges. The observation was targeted at the galaxy position, so NGC 4517 ULX1 was offset from the nominal pointing by 45” for all detectors. A second, larger circular region of radius 99”/22.7 pix. was chosen in an area of the same CCD free of other sources to sample the background. We also extracted the spectrum of the source coincident with the nucleus, using a circular region of radius 16”/3.7 pix. so as not to overlap the region adopted for the ULX. The redistribution matrices and auxiliary response files were generated with RMFGEN and ARFGEN. Lightcurves were corrected for the background count rate using EPICLCCORR333Note that EPICLCCORR only accounts for the instrumental good time interval (GTI) generated during the production of the events file, it does not account for additional GTI files based on e.g. periods of high background, as used here.. After performing the data reduction separately for each of the MOS CCDs, the spectra were combined using the FTOOL444http://heasarc.nasa.gov/ftools/ftools_menu.html ADDSPEC to improve the statistics at the highest and lowest energies. ADDSPEC combines spectra in a response weighted manner, to account for any differences there may be in e.g. the extraction regions etc., and also automatically combines the instrumental responses and background spectra associated with the source spectra. Finally, spectra were re-binned using GRPPHA to have a minimum of 25 counts in each energy bin, so that the probability distribution of counts within each bin can be considered Gaussian, and hence the use of the statistic is appropriate when performing spectral fits.
This procedure yielded good quality spectra for NGC 4517 ULX1, comparable with some of the best ULX spectra currently obtained. In total, 15500 counts were recorded with the EPIC cameras, with 8500 of these recorded by EPIC-pn, so the data meet the quality criterion adopted by both Gladstone et al. (2009) and Stobbart et al. (2006). The total good observation times contributing to the reduced spectra are 70 ks for EPIC-pn and 85 ks for each EPIC-MOS CCD. The EPIC-pn lightcurve obtained for the first 80 ks of the observation (of which 70 ks has a low enough background count to be considered good time and contribute to the spectrum) is shown in Fig. 2, during which the source remains fairly constant. After this time, the observation is dominated by very strong background flaring events. We attempt to calculate the fractional excess variability (Edelson et al. 2002), but find that the lightcurve is completely dominated by statistical fluctuations and does not display any observable intrinsic variability, similar to a number of other ULXs highlighted in Heil et al. (2009).
| Model | ||||
|---|---|---|---|---|
| () | ||||
| POWERLAW | - | - | 1.4(268) | |
| BROKEN | 1.1(266) | |||
| POWERLAW |
3 Spectral Analysis
Here we present our spectral analysis of NGC 4517 ULX1. Throughout this work, spectral modelling is performed with XSPEC v12.5.1n (Arnaud 1996), and parameters are obtained by modelling the EPIC-pn and combined EPIC-MOS spectra simultaneously. All parameters are tied between the two spectra with the exception of a constant multiplicative component, required to be 1.0 for EPIC-pn but allowed to vary for EPIC-MOS to account for possible cross-calibration uncertainties. In all cases presented in the following sections this parameter is within 5 per cent of unity. All quoted uncertainties are the 90 per cent confidence limits for a single parameter of interest, unless stated otherwise. The Galactic absorption column in the direction of NGC 4517 is atom cm-2 (Kalberla et al. 2005).
3.1 High Energy Turnover
As previously stated, high energy curvature is frequently seen in the best quality X-ray spectra of ULXs (Gladstone et al. 2009; Stobbart et al. 2006). Given that the data presented here is of similar quality, it is natural perhaps to expect that such a turnover should also be observed in NGC 4517 ULX1. Accordingly, we investigated the high energy data to determine whether a turnover was present by comparing single and broken powerlaw models to the 2-10 spectra, following a similar prescription to Stobbart et al. (2006). However, inspection of the full 0.3–10.0 data for NGC 4517 ULX1 suggests there is a significant amount of neutral material obscuring the source, with a column density of atom cm-2 (far in excess of the Galactic column). This is most likely due to the edge-on orientation of the host galaxy, and unfortunately will add to the difficulty in reliably determining the presence and origins of any excess emission at soft energies, and hence to the difficulty in distinguishing between spectral models with the current data. Modelling the (admittedly very poor) spectrum of the source associated with the nucleus with a simple absorbed powerlaw also implies significant absorption, with a column density of atom cm-2.

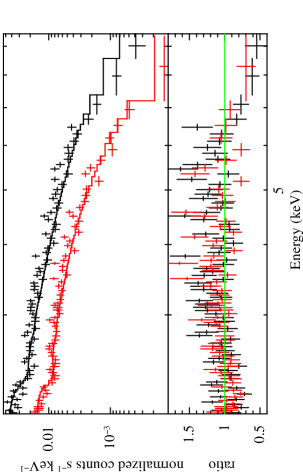
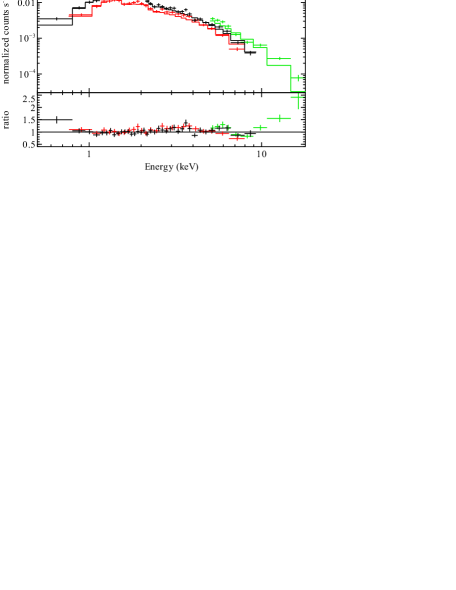
While Stobbart et al. (2006) compare unabsorbed models, the column required here will have some effect on the spectrum above 2 , so we include absorption with a column density atom cm-2 in our comparison. We find that the broken powerlaw model is significantly preferred, providing an improvement of = 77 for 2 additional degrees of freedom (d.o.f.), the probability of chance improvement given by an F-test is negligible, at . The comparison is shown in Table 1 and Fig. 3, in which it is clear there are fewer counts observed at high energies than predicted with the single powerlaw model. This implies that the high energy spectrum of NGC 4517 ULX1 does indeed display curvature, similar to that seen in other high quality ULX data. In addition, the break energy of 5.5 obtained is similar to that commonly seen in the other high quality ULX spectra, where the break energy is often close to 6 .
Having demonstrated the presence of intrinsic high energy curvature, in the following sections we apply the physically motivated disc reflection and Comptonisation interpretations proposed to explain this feature. We do not preclude that other interpretations for this source are possible, but we limit ourselves to these two as a demonstrative process in order to investigate how they may be distinguished in general.
3.2 Disc Reflection Interpretation
We begin by considering the reflection model presented in Caballero-García & Fabian (2010), in which the observed turnover is due to the combined presence of a relativistically blurred iron emission line and absorption edge. These features arise from X-ray reflection within the inner regions of the accretion disc after irradiation of this material by the intrinsic powerlaw continuum. This model makes use of the REFLIONX grid (Ross & Fabian 2005), a self consistent reflection model which intrinsically includes iron K-shell absorption and emission. Its key parameters are the iron abundance of the reflecting medium (relative to the solar iron abundance), , the photon index of the assumed ionising powerlaw continuum, , and the ionisation parameter of the surface of the reflecting medium, , where is the incident luminosity able to ionise hydrogen, is the number density of hydrogen and is the distance from the ionising source. REFLIONX does not include the abundances of any elements other than iron as free parameters, the model is instead calculated assuming their solar values as given in Morrison & McCammon (1983). The relativistic blurring is applied using the convolution model KDBLUR which accounts for the extreme gravitational blurring expected in the innermost regions around a Kerr black hole using calculations performed by Laor (1991). Here the key parameters are the inner and outer radii of the accretion disc, and respectively, its inclination with respect to the observer, , and its emissivity index, , which describes the assumed powerlaw emissivity profile of the disc, of form . Higher values of imply preferential illumination of the inner regions of the disc, and hence a more compact, centrally located corona (we caution the reader that although there are differences in the Compton scattering medium between the reflection and Comptonisation interpretations, in terms of the physical condition and possibly also the origin of the matter, as will be discussed later, we refer to it as the corona in both cases).
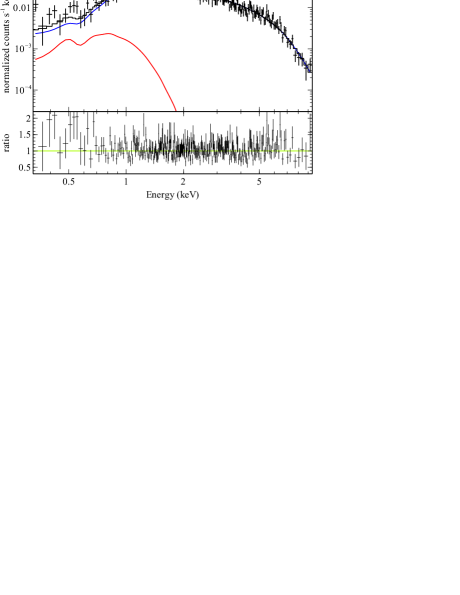
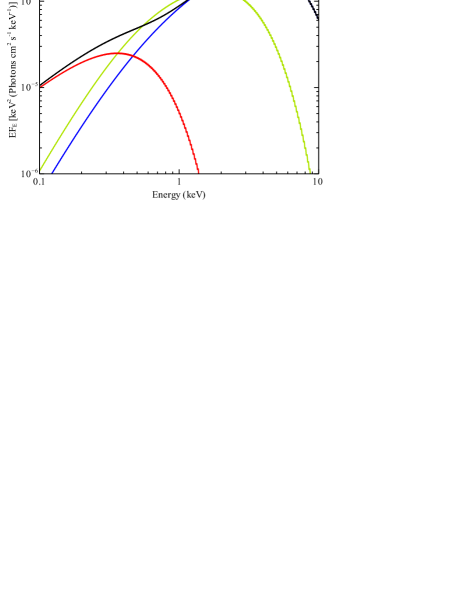
Initially we applied the model following the same method as Caballero-García & Fabian (2010) including both Galactic and intrinsic neutral absorption using PHABS and ZPHABS respectively. A reasonable fit with = 1.2(468) is obtained with similar parameters to those presented in the initial paper, i.e. significant blurring of the reflected emission, with the accretion disc extending to the last stable orbit of a maximally rotating black hole. The disc is required to have a highly super-solar iron abundance, and the ionising continuum is extremely steep in this case. However, the turnover was still not adequately modelled. To resolve this, we make a minor modification to the model (without changing the physical components included) and replace KDBLUR with KDBLUR2, improving the fit to = 1.1(466) (of 40 for 2 extra d.o.f.). KDBLUR2 applies the relativistic effects due to strong gravity in the same way as KDBLUR, but allows the emissivity profile of the disc to have a broken powerlaw form, breaking at . The parameters obtained with this modification are given in Table 2, and the relative contributions of the components are shown in Fig. 4. We still find the emissivity profile to be strongly centrally peaked. During the application of the reflection model, the outer radius of the disc was set to 400 , the maximum allowed by the KDBLUR and KDBLUR2 models, as it is very poorly constrained due to the centrally peaked emissivity index. The only constraint obtained if this parameter is allowed to vary is that the outer radius of the disc must be greater than 10 .
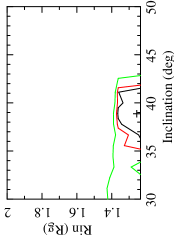
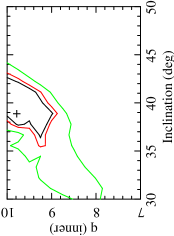
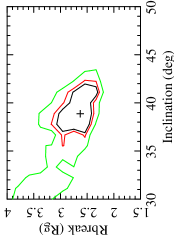
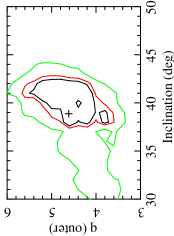
The disc reflection interpretation constructed is a complex, multi-parameter model. We therefore investigated the confidence contours for various combinations of parameters to search for parameter degeneracies, focussing on those of the KDBLUR2 component. Degeneracies in the blurring parameters have been found to be a significant issue in a number of cases during the application of reflection models to other sources (see e.g. Nardini et al. 2010). Fig. 5 shows the confidence contours of the disc inclination paired with each of the remaining KDBLUR2 parameters (excluding , which was not free to vary). It is clear from these panels that strong parameter degeneracies are not an issue for the reflection interpretation of this particular source, even at the 95 per cent confidence level for two parameters of interest.
| Component | Parameter | Value | ||
| PHABS | \tmark[a] | * | ||
| ZPHABS | \tmark[a] | |||
| * | ||||
| POWERLAW | ||||
| KDBLUR2 | \tmark[b] | |||
| \tmark[b] | * | |||
| \tmark[b] | ||||
| REFLIONX | \tmark[c] | |||
| \tmark[d] | ||||
| 1.1(466) | ||||
| \tmark[e] |
a Column densities are given in atom cm-2
b Radii are given in units of gravitational radii, =
c Ionisation parameter, given in erg cm s-1
d iron abundance, quoted relative to the solar value
e The absorption corrected 0.3–10.0 luminosity in erg s-1
3.3 Comptonisation Interpretation
The second model applied is that of Gladstone et al. (2009), which proposes a new accretion state for X-ray binaries, dubbed the ‘Ultraluminous State’. In this scenario, the turnover is due to Comptonisation of disc photons by an optically thick corona. To model this, we make use of the DKBBFTH code (Done & Kubota 2006), which accounts for the energetic coupling between the disc and the corona using the model of Svensson & Zdziarski (1994), i.e. it assumes the corona extends homogeneously (constant temperature and optical depth) over the disc out to some transition radius, . The corona takes some fraction, , of the gravitational energy available within , with the remaining fraction powering the inner disc emission. As a simplifying assumption the model also takes to be constant with radius. Other authors have proposed alternative scenarios in which may vary with radius (e.g. Janiuk et al. 2000), but as shown in Done & Kubota (2006), keeping constant is an adequate approximation for even the best quality XRB data, and so will be sufficient for our needs. The key parameters of DKBBFTH are the temperature of the Comptonising electrons, , the spectral index of the corona, , the transition radius (or the outer radius of the corona), and the inner temperature of the accretion disc, . Note that this temperature is what would be observed if the corona and its effects on the disc were completely removed. The fraction of the power in the corona is calculated self consistently via iteration from the coronal spectral parameters. The inner radius of the disc, , may be calculated from the normalisation of the model if the distance to the source and the inclination of the (inner) disc are known, in the same manner as for the DISKBB model, and the optical depth, , can be calculated from and (assuming a slab geometry).
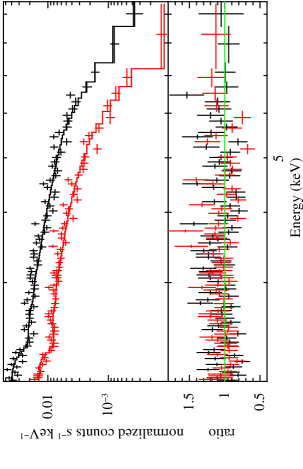
We applied this model to the data, allowing for both Galactic and intrinsic neutral absorption in the same way as for the reflection interpretation, using PHABS and ZPHABS again, and obtained a good fit with = 1.1(471). Model parameters, and key quantities derived from them, are given in Table 3, and the fit to the data are shown in Fig. 6. As with the reflection model, we find similar parameters here to those obtained in the original work of Gladstone et al. (2009). The electron temperature of the Comptonising corona is low ( ), and it is optically thick (). In addition, the temperature of the innermost disc inferred from the model ( , in the limit of no corona) is akin with that seen in stellar mass black hole binaries in accretion states with high Eddington ratios, e.g. the high/soft state or the steep powerlaw state (using the nomenclature of Remillard & McClintock 2006). The inclination angle of the inner disc, , is not known in this case, so the inner radius of the disc is quoted in terms of its functional dependence on this angle.
| Component | Parameter | Value | ||
| PHABS | \tmark[a] | * | ||
| ZPHABS | \tmark[a] | |||
| * | ||||
| DKBBFTH | ||||
| \tmark[b] | ||||
| \tmark[b] | ||||
| \tmark[c] | ||||
| /\tmark[d] | ||||
| \tmark[e] | ||||
| 1.1(471) | ||||
| \tmark[f] |
a Column densities are given in atom cm-2
b Temperatures are given in
c Inner radius of the disc in km, in terms of the unknown inclination angle
d Outer radius of the corona, relative to the inner radius of the disc
e is not a model parameter, but is calculated from and
f The absorption corrected 0.3–10.0 luminosity in erg s-1
4 Discussion and Comparison
We find that both disc reflection and Comptonisation can model the high quality 0.3–10.0 EPIC spectra of NGC 4517 ULX1 well when a broad parameter range is considered, and in fact give statistically equivalent fits to the data. This appears to be the case for the majority of ULXs with spectral curvature, as all the sources modelled with reflection in Caballero-García & Fabian (2010) are also well modelled with Comptonisation by Gladstone et al. (2009). Currently these spectra represent the best available ULX data, so other means are necessary to distinguish between these two interpretations. We begin by considering the physical implications of our analysis, as well as the results obtained for other ULXs.
The lack of direct thermal emission from the accretion disc included in the reflection model may at first seem puzzling. For many of the black hole masses invoked in both the stellar mass and IMBH interpretations, the inner temperature of the disc is expected to occur in the X-ray bandpass (1.0 for a 10 stellar mass black hole, down to 0.3 for a 1000 IMBH). Given the strong disc reflection, one might expect to see a sizeable contribution from a direct thermal component. However, if magnetic extraction of energy from the disc to the corona (which itself might be magnetic in nature, see e.g. Merloni & Fabian 2002, Liu et al. 2002 and references therein) is highly efficient, energy may be extracted from the disc before it is able to thermalise. In this way, the direct thermal emission could be suppressed with respect to that of the corona, and hence also the reflected component. Such processes are not currently well understood and merit further attention. Were this to be the case, such highly efficient magnetic extraction would distinguish ULXs from both XRBs and AGNs, as it is well known that there is often evidence for direct thermal emission in both cases (albeit in the UV for AGNs), especially at high accretion rates (as are anticipated to be present in ULXs). Hence the efficiency of magnetic extraction is not expected to be particularly high in XRBs and AGNs.
Of course, the direct thermal disc emission must be distinguished from any of the reflected emission thermalised in the disc during the reflection process. The temperature at which this feature appears, for a given ionisation state, depends on the rate of free-free absorption and hence on the density of the illuminated surface of the disc. It is incorporated into the REFLIONX model, however, this model is calculated assuming a hydrogen number density of cm-3, for which the thermalised component of the reflected emission occurs at 0.1 ; if the assumed density is not appropriate for the discs around ULXs then this emission will not be accounted for correctly. For NGC 4517 ULX1 this might not be a significant issue as the large absorption column prevents a detailed study of any additional emission at soft X-ray energies. For sources with less absorption it will be necessary to include this effect with reflection models calculated for a higher density (e.g. REFHIDEN; Ross & Fabian 2007). This will be explored in future work.
The emissivity profile obtained is strongly centrally peaked, which suggests that gravitational light bending is important. For this to be the case, the corona must be compact and located close enough to the central black hole that the gravitational potential focuses additional flux from the corona away from the observer and onto the the accretion disc. This allows the reflected component to appear more luminous than the intrinsic component; see Miniutti & Fabian (2004) for a more detailed discussion of this phenomenon. In their work, it is shown that gravitational light bending preferentially illuminates the inner disc, and hence in such a regime the radial emissivity profile of the inner disc is not best described by a single uniform powerlaw, so the significant improvement obtained by allowing for a broken powerlaw emissivity profile is not unexpected. Given that centrally peaked emissivity profiles appear to occur fairly frequently when applying a disc reflection interpretation to ULX spectra, and that some sources require reflection dominated solutions, allowing for a more complex emissivity profile may lead to similar improvements in the modelling of other sources.
The proximity of the X-ray emitting corona to the black hole required to provide the obtained emissivity profile for NGC 4517 ULX1 suggests that, for a corona on-axis, the majority of the flux ends up crossing the event horizon rather than illuminating the disc. The model of Niedźwiecki & Zycki (2008) requires the corona to be within 1.5 , at which point, if on-axis, 90 per cent of the coronal flux may not illuminate the disc, so the true intrinsic luminosity would be substantially larger than that observed. In addition, any small change in the height of the corona above the black hole would lead to large changes in observed luminosity, which may be in contrast with the extremely stable ULX lightcurves seen here and in Heil et al. (2009). A more appropriate geometry may be similar to that proposed for MCG –6-30-15 by Niedźwiecki & Zycki (2008), where the corona is located just above the inner disc. In this scenario the illumination from the corona is Doppler beamed along the disc, so a greater proportion illuminates the disc rather than being lost over the event horizon.
At a first glance, the high iron abundance obtained for the accretion disc here, and in general when modelling ULX spectra with disc reflection (Caballero-García & Fabian 2010), does not seem consistent with the observation that ULXs are often located in low metallicity regions (see e.g. Soria et al. 2005, Mapelli et al. 2009, Mapelli et al. 2010), nor the theoretical considerations that suggest the 10 black holes ULXs are speculated to host are easier to form in low metallicity regions, both due to the formation of larger progenitor stars, and reduced mass loss rates from stellar winds (Madau & Rees 2001; Bromm 2004; Vink et al. 2001). However, if the black holes in ULXs are accreting from debris discs formed from the metal rich inner layers of the stars that originally collapsed to form them in the first place, it may be possible for the accretion disc to have a very high metallicity even though the surrounding regions do not. Such discs could be produced by a method similar to that proposed by Li (2003), where the inner regions of the collapsing/exploding star are not properly ejected, and fall back towards the collapsed core to form the accretion disc. In such a scenario the black hole need not be in a mass transfer binary system to appear bright in X-rays, and we note that a number of ULX optical counterparts appear more consistent with X-ray irradiation of the outer regions of an accretion disc than with a stellar companion (e.g. Kaaret & Feng 2009), although it may just be that the emission from the disc dominates that of any companion star even in the optical bandpass, as is the case for LMXBs in outburst. Debris discs might be a common scenario if ULXs are associated with supernova remnants (SNR), an explanation initially proposed for the ionised nebulae many ULXs are embedded within, e.g. IC 342 X-1 (Roberts et al. 2003) and MF 16 in NGC 6946 (Roberts & Colbert 2003).
However, there is growing evidence that these nebulae are not SNR, but a combination of X-ray photoionised and shock-ionised material due to irradiation and outflowing winds from the central X-ray source (see e.g. Pakull & Grisé 2008). From these nebulae the ages of ULXs can be estimated as 104-6 yr (Pakull et al. 2006; Pakull & Grisé 2008), which can be used to estimate the mass of high metallicity material required in the debris disc scenario. In order to radiate at erg s-1 the black hole must be accreting at yr-1, so in order for ULXs to have observable debris discs, these must have formed from at least 0.1 of high metallicity material. Of course, this makes the simplistic assumption that the mass accretion rate is constant with time. Mineshige et al. (1997) studied post supernova accretion via fallback of matter in detail and found that the accretion rate should evolve with time, as , with (the exact value of depends on the conditions of the material as it begins to fall back). In this case the required accretion rate of yr-1 would represent the ‘current’ accretion rate, and the initial mass of high metallicity material available may have had to have been much greater than 0.1 even for a ULX currently radiating at erg s-1. In addition, disc winds may have been present throughout, or at stages during the lifetime of the ULX. The initial disc masses required are therefore at least an order of magnitude larger than the lower limits for the current disc mass estimates for the ULXs CXOJ033831.8-352604 and XMMU122939.7+075333 in Porter (2010).
It may be difficult to form such large discs through fallback. Supernovae in low metallicity regions may not eject large amounts of material (Zampieri & Roberts 2009), hence massive, rapidly rotating progenitor stars may be required. In addition, a number of optical ULX counterparts have been identified as probable high mass or evolved stellar companions, (see e.g. Kuntz et al. 2005, Soria et al. 2005, Liu et al. 2007, Roberts et al. 2008, but especially Patruno & Zampieri 2008), from which mass is expected to be transferred to the black hole. The binary companion and the mass transfer could disrupt and dilute the metallicity of such a large disc. The possible presence of outflows is also interesting. The population of optical nebulae associated with ULXs appear to show a combination of photoionised and shock-ionised material, and Pakull & Grisé (2008) argue the latter cases may be inflated by winds from the central source, although the possibility that they are remnants of the explosive event in which the ULX was formed is not ruled out. If these are due to winds and ULXs are accreting from high metallicity fallback material, some metal enrichment of the regions surrounding the ULX might be expected, although exactly how much effect on the elemental abundances these outflows should have will depend on the amount of material ejected in comparison to that in the ISM. It seems that although debris discs can not be ruled out for a fraction of the population, they may not be a viable explanation for all ULXs.
An alternative explanation is that the iron abundances obtained may not be good estimates of the true abundances of the systems in question, but systematically modified by processes that are not accounted for in the modelling. For example, this would be the case if there are actually multiple reflections of the intrinsic continuum. The observed emissivity profile implies that strong gravitational light bending is an important process in NGC 4517 ULX1, and ULXs in general, if reflection is the correct interpretation. This causes the initial reflection of the intrinsic powerlaw component to occur primarily within the central regions of the accretion disc, so the majority of the reflected emission also originates within the region in which strong light bending is present. Some fraction of this reflected emission could therefore be bent back towards the disc and reflected a second time. The initially reflected emission already has the iron emission features imprinted onto it and the secondary reflection should serve to enhance these further, as demonstrated by Ross et al. (2002), hence the iron abundance obtained from modelling the emission with a single reflection process could be artificially inflated. If this is the case, it may not be necessary to invoke the high metallicity debris discs discussed previously. Whatever the correct explanation for the super-solar iron abundances obtained, it might be natural to expect that other heavy elements might be or appear over-abundant for the same reason. Unfortunately model limitations currently prevent us from exploring this possibility.
The Comptonisation interpretation requires that the coronal electron temperature of NGC 4517 ULX1 is rather low, at . Indeed, low electron temperatures ( ) are a common feature in the application of this model to ULX spectra (Gladstone et al. 2009), as they are an unavoidable consequence of modelling the observed curvature as the high energy cut-off of Compton up-scattering by thermal electrons. Typical electron temperatures for XRBs are usually much higher, for binaries in the low/hard state and 30–50 in the high/soft state (although here there can also be a significant contribution from a non-thermal electron distribution); see e.g. Malzac & Belmont (2009), Gierliński et al. (1999), Sunyaev & Titarchuk (1980) amongst others. The coronal optical depth is also quite discrepant from typical values for XRBs: in the high/soft state and 1 in the low/hard state. Here we find . However, ULX spectra are often likened most to the steep powerlaw state. Sources in this state often display very high Eddington Ratios (1). Again, Compton up-scattering by thermal electrons is observed to be important, with (Wilson & Done 2001; Kubota & Makishima 2004; Kubota & Done 2004). These temperatures are often still highly discrepant from those obtained from ULX spectra, although the highest luminosity observations of the XRB GRS 1915+105 are notable exceptions (Middleton et al. 2006; Ueda et al. 2009).
However, in the work of Gladstone et al. (2009), it is suggested that most ULXs may represent a new accretion state entirely, dubbed the ‘Ultraluminous State’, which sources enter if and when they are able to radiate at super-Eddington luminosities (). As sources approach, and potentially exceed the Eddington limit, there is much speculation that radiatively driven disc winds become increasingly important (see e.g. King & Pounds 2003). A case in point, potentially relevant for ULXs, is the binary system SS 433 which is expected to have a very high mass transfer rate and from which large outflows are observed, in addition to relativistic jets (Begelman et al. 2006; Poutanen et al. 2007). Gladstone et al. (2009) argue that such winds may be the source of the increased coronal opacity obtained from ULX spectra, as further mass is injected into the corona by the outflow. The electron density of the corona is then increased, and there is therefore less energy available per electron, so the average temperature of the electrons decreases. These outflows could be responsible for the inflation of the observed ULX optical nebulae (Pakull & Grisé 2008).
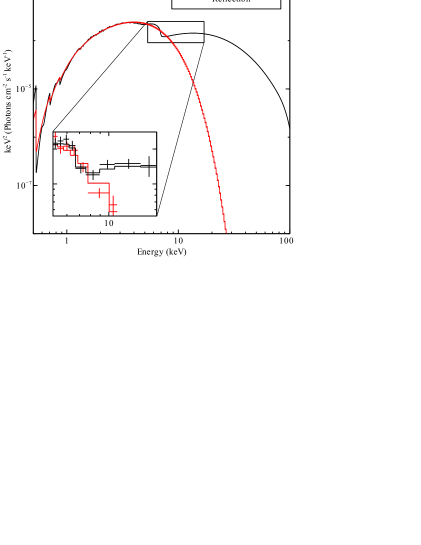
In brief, it seems that on purely physical grounds, neither interpretation can be excluded from being the underlying process for at least some fraction of the ULX population, so we must seek other, observational means to distinguish between them. Ideally, this would be easily applied to a sample of ULXs large enough to be considered representative of the population as a whole. Unfortunately, the models do not make unique predictions for the emission at non X-ray wavelengths, so multiwavelength studies are unlikely to resolve this particular issue. In Fig. 7 we compare the two models fit to the spectrum of NGC 4517 ULX1, but extended beyond the XMM-Newton bandpass up to 100 . A few minor details aside, the models agree very well below 10 . As we have demonstrated an observation of 100 ks is insufficient to differentiate between them for NGC 4517 ULX1, and the work of Caballero-García & Fabian (2010) and Gladstone et al. (2009) suggests both models agree well at these energies for similar length observations of even brighter ULXs. Attempting to determine which, if any, of these models is correct using only CCD data would require even longer observations, which are not realistically obtainable for a large number of sources. Some ULXs may be bright enough that the reflection grating spectrometers aboard XMM-Newton could investigate the differences in the neutral absorption the two models predict with reasonable observation lengths. However, these are very much in the minority, and obtaining an independent value for the column density would not confirm either interpretation directly, it would merely provide an an additional constraint that each model must fulfil if they are to continue to provide acceptable representations of the data.
Potentially, the most fruitful avenue utilising only data below 10 is the combination of spectral and variability studies. Investigation of the rms variability spectrum can aid significantly in the deconvolution of separately varying spectral components and could be able to differentiate between the two models considered here. Both are two component solutions, but the energy dependence of the relative importance of the two components is different for the two models. This approach is being investigated by Middleton et al. (in preparation). However, a reliable estimation of the rms variability spectrum requires good quality data, which often requires long observations. In addition, this method relies on the ULXs displaying observable variability, however Heil et al. (2009) demonstrated that the brightness of many ULXs is remarkably stable within single XMM-Newton observations up to 100 ks in duration; it seems that NGC 4517 ULX1 may also be counted amongst this number. As a further complication, there are also sources that exhibit flux variability without any strong spectral variability (see Kaaret & Feng 2009.) This might be considered unusual for interpretations invoking two distinct emission components. However, these components are not independent of one another, in both models one component represents reprocessed emission from the other. If the luminosity of the primary component varies, then the luminosity of the secondary component must also vary in the same way. A brightening of the primary component might lead to some variation in the observable parameters, for example the temperatures of the observable part of the disc and the Comptonising electrons in the Comptonisation interpretation or the ionisation of the disc in the reflection interpretation, but as argued by Vierdayanti et al. (2010) these effects are likely to be fairly subtle and not easily detected with the hardness ratio analysis employed by Kaaret & Feng (2009). Unfortunately, combining spectral and variability studies to decompose emission components is often only possible when strong spectral variability is present. All of these requirements limit the number of sources for which such analysis is possible.
Returning to Fig. 7, the comparison above 10 shows the two models diverging. The Comptonisation model continues its downward curvature, as this is due to the high energy limit of the Compton up-scattering process of disc photons by cool electrons, while the reflection spectrum turns back up above 10 due to the Compton hump. This is a broad emission feature present in reflection spectra that peaks at 20–50 due to the interplay within the reflecting medium between Compton down-scattering of high energy photons and photoelectric absorption of low energy photons (George & Fabian 1991). Features consistent with the Compton hump are fairly commonly observed in the spectra of both BHBs and AGNs (see e.g. Reis et al. 2010; Walton et al. 2010). The difference in the origins of the observed curvature between the two models leads to large differences in their predicted high energy spectra. Of course, the Comptonisation model assumes the electrons have a purely thermal distribution. It is likely there is an additional non-thermal electron population that will eventually arrest the downward curvature predicted in this Comptonisation model, but we still anticipate clear differences between the two models at high energies, as for any reasonable non-thermal temperature distribution these electrons would merely limit the downward curvature and provide a high energy powerlaw tail, not turn the spectrum back up again. In addition, if ULXs are an extremely high accretion rate extension of the Steep Powerlaw State (i.e. the Ultraluminous State), the emission from the non-thermal electrons may not be significant until energies .
The strength of the predicted Compton hump is obviously determined by the parameters of the reflection model, notably the inclination of the disc. Although we find the key parameters to be well determined in this case, parameter degeneracies may exist in other cases. REFLIONX is an angle averaged model, best suited for use with inclination angles 45∘, so we investigate how the strength of the Compton hump may change for extreme inclinations with the PEXRAV model (Magdziarz & Zdziarski 1995). At low inclinations (10∘) its strength is actually enhanced by 5–10 per cent (relative to the 45∘ case), while at high inclinations (80∘) its strength is reduced by 25–30 per cent. This variation is highly unlikely to be able to reconcile the predictions of the two models in any given case. Other factors may also modify its strength. For example, REFLIONX is calculated assuming the illuminating spectrum is a powerlaw with a high energy cut-off at 300 . Lowering the energy of this cut-off will also serve to reduce the predicted Compton hump to some extent. However, we stress that when both models provide acceptable representations of the data below 10 , the extra emission due to the presence of this high energy feature in the reflection interpretation should lead to large differences in the predictions of the two models above 10 for just about any parameter combination. Therefore, observations of ULXs at such energies should be an extremely important diagnostic of the underlying physical processes powering the emission from ULXs.
At the time of writing there are two facilities that are capable of observing simultaneously in the 0.5–10.0 range required to determine the key model parameters for each interpretation from the curvature at 6 , and at the higher energies required to distinguish between them. These are Suzaku (Mitsuda et al. 2007), with the combination of the Hard X-ray Detector (HXD, specifically the PIN detector; Takahashi et al. 2007) and X-ray Imaging Spectrometers (XIS; Koyama et al. 2007), and Swift (Gehrels et al. 2004) with the combination of the Burst Alert Telescope (BAT; Barthelmy et al. 2005) and the X-ray Telescope (XRT; Burrows et al. 2005). Some key information on the hard X-ray instruments on board these two satellites is summarised in Table 4. Both have very modest spatial resolution (the HXD is a collimating instrument, so its effective spatial resolution is the same as its field of view). For the vast majority of ULXs, and certainly for the specific case of NGC 4517 ULX1 we have been considering here, neither of these instruments would be able to resolve the ULX from the nucleus of its host galaxy, which in most galaxies (although not necessarily NGC 4517) will be the dominant source of hard X-rays. This has been a common problem with hard X-ray detectors to date, and as such very little is known about the spectra of ULXs above 10 .
| Instrument | Type | Energy Range | Angular Resolution |
|---|---|---|---|
| () | (FWHM, arcmin) | ||
| HXD (PIN) | Collimating | 12–70 | 34 (FoV) |
| BAT | Coded Mask | 15–150 | 17 (PSF) |
The exception is M 82 X-1, for which Miyawaki et al. (2009) claim a Suzaku HXD detection up to 20 . In this work, the 3.2–20.0 spectrum of M 82 X-1 is found to require a curved continuum (below 3.2 the spectrum is dominated by diffuse, thermal emission). Some uncertainty remains over what proportion of the flux detected above 10 originates from M 82 X-1 and what proportion originates from the rest of the (sizeable) XRB/ULX population of M 82, but the requirement of a curved continuum is not sensitive to this. This curvature is well modelled with Comptonisation, and similar parameters to the results from other ULXs are obtained ( 2.5 , 8). However, this was only possible due to the unique scenario M 82 X-1 is in. M 82 is a starburst galaxy with no discernible AGN activity, and of its X-ray source population, M 82 X-1 is usually the brightest (Zhang et al. 2009; Zezas et al. 2001; Matsumoto et al. 2001). In addition, during the observations utilised by Miyawaki et al. (2009), it was possible to choose the pointing to ensure other nearby bright X-ray sources, e.g. the LLAGN in M 81, M 81 X-6 and Holmberg IX X-1, were outside of the HXD field of view.
It may be possible for the PIN and BAT detectors to contribute to the differentiation of other sources if they are also significantly brighter than any others that they can not spatially be resolved from. In addition, a total non-detection at a low enough flux sensitivity would rule out the reflection interpretation. However, the sensitivities of these instruments is rather limiting for the study of ULXs. We stress that these scenarios will both be extremely rare, so such an approach will not be possible for the vast majority of the ULX population. M 82 X-1 is the only currently known source these instruments have been able to study due to its apparently unique situation and high flux. In order to obtain spectral information above 10 for a large sample of ULXs an imaging spectrometer with significantly higher spatial resolution than is currently available will be required. With the improvement in sensitivity and angular resolution (60–90”) offered by the Hard X-ray Imaging System proposed to fly on Astro-H555http://astro-h.isas.jaxa.jp/si/index_e.html (Kokubun et al. 2008) in 2014, combined with the Soft X-ray Imaging system and the Soft X-ray Spectroscopy System (microcalorimeter) also due to be on board, it should be possible to begin addressing the nature of the observed emission from ULXs with a series of relatively short, pointed observations. In the shorter term, such observations should also be possible with simultaneous observations from NuSTAR666http://by134w.bay134.mail.live.com/default.aspx?wa=wsignin1.0 (Harrison et al. 2005), which is due for launch in 2011, and either XMM-Newton or Suzaku. An excellent candidate with which to demonstrate the capabilities of these instruments to contribute to ULX studies is Holmberg IX X-1, which is bright, nearby, and has a very hard spectrum, but currently cannot be resolved from the nucleus of M 81 above 10 .
As an immediate demonstration of the potential of these two instruments for ULX science, we have obtained the pre-flight instrument response files for Astro-H and simulated the data that would be obtained for both the models obtained here with a 100 ks observation of NGC 4517 ULX1 (we only simulate for Astro-H because the hard X-ray imaging responses are very similar for this mission and NuSTAR, and Astro-H will also carry soft X-ray spectrographs). These simulations are shown in the inset in Fig. 7. NGC 4517 ULX1 would clearly be detected out to much higher energies with the reflection interpretation than with the Comptonisation interpretation. We apply the Comptonisation interpretation to the data simulated from the reflection model for the full suite of instrumentation aboard Astro-H, allowing its parameters to vary (although requiring that Comptonisation models the 6 curvature), and obtain a relatively poor fit, with = 1.33(284). Even though the electron temperature of the corona increases to and its optical depth decreases to , Fig. 8 shows there is a clear excess of counts at hard energies. To provide a rough estimate of the number of ULXs for which Astro-H and NuSTAR should be able to make such a distinction with observations of a similar or shorter duration to that considered above, there are 19 sources in the ULX catalogue presented by Walton et al. (2011; submitted) with a greater flux than NGC 4517 ULX1, including 5 whose flux is more than an order of magnitude higher. We stress that this is actually a lower limit, as there are a number of bright ULXs that are not present in the catalogue, of which Holmberg IX X-1 is a prime example.
5 Conclusions
We have analysed the high quality EPIC spectrum of NGC 4517 ULX1, demonstrating that this source exhibits spectral curvature at 6 , similar to that seen in the highest quality observations of other ULXs to date. This feature has been modelled with both the recent reflection and Comptonisation interpretations (see Caballero-García & Fabian 2010 and Gladstone et al. 2009 respectively) in an attempt to provide a direct comparison of the two. The reflection interpretation requires that the majority of the emission occurs within the innermost regions of the accretion disc. We find that the radial emissivity profile must be strongly centrally peaked in order to provide the smooth downturn, which can be achieved if the disc-corona geometry is such that strong gravitational light bending occurs (Miniutti & Fabian 2004). In order to model the curvature in NGC 4517 ULX1, the disc must have, or appear to have, a highly super-solar iron abundance. This may be possible if the black hole is accreting from a debris disc formed primarily from the metal-rich inner layers of the star that originally collapsed to form it, or if the light bending is so strong that multiple reflections of the intrinsic continuum occur. Meanwhile, we find that the Comptonisation interpretation requires that the electron temperature of the Comptonising corona is very low, and that the corona is optically thick. It is the low temperature of the thermal component of the Comptonising electrons that provides the curvature in the spectrum, as this determines the high energy cut-off of the Compton up-scattering process. These low temperatures and high optical depths may be due to mass loading of the corona if disc winds are important at high accretion rates, as proposed by King & Pounds (2003).
Neither model may be excluded physically, so alternative observational means are required to distinguish between them. Correctly identifying the origins of the high energy curvature could be a very important step in enhancing our understanding of ULXs, as it is one of their characteristics that distinguishes them from XRBs. By extending both of the models to energies above 10 , it becomes clear that there are large differences between them at these energies (Fig. 7). We expect this to be the case even if, as is likely, there is a contribution from a non-thermal distribution of electrons to limit the downward curvature in the Comptonisation model. The major cause of the discrepancy between the two models at high energies is the presence of the Compton hump in reflection spectra, a broad emission feature that often peaks at 30–50 . Observations of ULXs above 10 should provide an important diagnostic for the relative importance of these physical processes in the ULX population.
Unfortunately, the angular resolution of the hard X-ray instruments aboard currently operational facilities that simultaneously provide spectral coverage over the 0.5–10.0 and 10–100 energy ranges is not sufficient to provide uncontaminated data for a large number of ULXs. We stress the importance of modelling data above and below 10 obtained simultaneously as spectral variability and accretion state transitions could otherwise lead to incorrect conclusions, especially if ULXs do primarily represent a new accretion state. Hard X-ray imaging spectrometers with good angular resolution, such as the Astro-H Hard X-ray Imaging System, should allow a good number of reliable ULX spectra above 10 to be obtained in the future.
ACKNOWLEDGEMENTS
DJW acknowledges the financial support provided by STFC, and ACF thanks the Royal Society. Some of the figures included in this work have been produced with the Veusz777http://home.gna.org/veusz/ plotting package, written by Jeremy Sanders. The authors would also like to thank the anonymous referee for useful comments and suggestions, and their attention to detail. This work is based on XMM-Newton observations, an ESA mission with instruments and contributions directly funded by ESA member states and the USA (NASA). In addition, this research has made use of the NASA/IPAC Extragalactic Database (NED), operated by the Jet Propulsion Laboratory, California Institute of Technology, as well as the Digitised Sky Survey (DSS), produced at the Space Telescope Science Institute under U.S. Government grant NAG W-2166.
References
- Abramowicz et al. (1980) Abramowicz M. A., Calvani M., Nobili L., 1980, ApJ, 242, 772
- Abramowicz et al. (1988) Abramowicz M. A., Czerny B., Lasota J. P., Szuszkiewicz E., 1988, ApJ, 332, 646
- Arnaud (1996) Arnaud K. A., 1996, in Astronomical Society of the Pacific Conference Series, Vol. 101, G. H. Jacoby & J. Barnes , ed, Astronomical Data Analysis Software and Systems V, p. 17
- Barthelmy et al. (2005) Barthelmy S. D. et al., 2005, Space Science Reviews, 120, 143
- Begelman et al. (2006) Begelman M. C., King A. R., Pringle J. E., 2006, MNRAS, 370, 399
- Berghea et al. (2010) Berghea C. T., Dudik R. P., Weaver K. A., Kallman T. R., 2010, ApJ, 708, 364
- Bromm (2004) Bromm V., 2004, PASP, 116, 103
- Burrows et al. (2005) Burrows D. N. et al., 2005, Space Science Reviews, 120, 165
- Caballero-García & Fabian (2010) Caballero-García M. D., Fabian A. C., 2010, MNRAS, 402, 2559
- Chandar et al. (2004) Chandar R., Whitmore B., Lee M. G., 2004, ApJ, 611, 220
- Colbert & Mushotzky (1999) Colbert E. J. M., Mushotzky R. F., 1999, ApJ, 519, 89
- de Vaucouleurs et al. (1991) de Vaucouleurs G., de Vaucouleurs A., Corwin H. G., Jr., Buta R. J., Paturel G., Fouque P., 1991, The Third Reference Catalogue of Bright Galaxies (New York: Springer)
- Done & Kubota (2006) Done C., Kubota A., 2006, MNRAS, 371, 1216
- Edelson et al. (2002) Edelson R., Turner T. J., Pounds K., Vaughan S., Markowitz A., Marshall H., Dobbie P., Warwick R., 2002, ApJ, 568, 610
- Fabbiano (1989) Fabbiano G., 1989, ARA&A, 27, 87
- Finke & Böttcher (2007) Finke J. D., Böttcher M., 2007, ApJ, 667, 395
- Foster et al. (2010) Foster D., Charles P., Holley-Bockelmann K., 2010, ArXiv e-prints
- Gehrels et al. (2004) Gehrels N. et al., 2004, ApJ, 611, 1005
- George & Fabian (1991) George I. M., Fabian A. C., 1991, MNRAS, 249, 352
- Gierliński et al. (1999) Gierliński M., Zdziarski A. A., Poutanen J., Coppi P. S., Ebisawa K., Johnson W. N., 1999, MNRAS, 309, 496
- Gladstone et al. (2009) Gladstone J. C., Roberts T. P., Done C., 2009, MNRAS, 397, 1836
- Gonçalves & Soria (2006) Gonçalves A. C., Soria R., 2006, MNRAS, 371, 673
- Goudfrooij et al. (2003) Goudfrooij P., Strader J., Brenneman L., Kissler-Patig M., Minniti D., Edwin Huizinga J., 2003, MNRAS, 343, 665
- Harrison et al. (2005) Harrison F. A. et al., 2005, Experimental Astronomy, 20, 131
- Heil et al. (2009) Heil L. M., Vaughan S., Roberts T. P., 2009, MNRAS, 397, 1061
- Janiuk et al. (2000) Janiuk A., Zycki P. T., Czerny B., 2000, MNRAS, 314, 364
- Jansen et al. (2001) Jansen F. et al., 2001, A&A, 365, L1
- Kaaret & Feng (2007) Kaaret P., Feng H., 2007, ApJ, 669, 106
- Kaaret & Feng (2009) Kaaret P., Feng H., 2009, ApJ, 702, 1679
- Kaaret et al. (2004) Kaaret P., Ward M. J., Zezas A., 2004, MNRAS, 351, L83
- Kalberla et al. (2005) Kalberla P. M. W., Burton W. B., Hartmann D., Arnal E. M., Bajaja E., Morras R., Pöppel W. G. L., 2005, A&A, 440, 775
- Kewley et al. (2006) Kewley L. J., Groves B., Kauffmann G., Heckman T., 2006, MNRAS, 372, 961
- King et al. (2001) King A. R., Davies M. B., Ward M. J., Fabbiano G., Elvis M., 2001, ApJ, 552, L109
- King & Pounds (2003) King A. R., Pounds K. A., 2003, MNRAS, 345, 657
- Kokubun et al. (2008) Kokubun M. et al., 2008, in Society of Photo-Optical Instrumentation Engineers (SPIE) Conference Series, Vol. 7011, Society of Photo-Optical Instrumentation Engineers (SPIE) Conference Series
- Koyama et al. (2007) Koyama K. et al., 2007, PASJ, 59, 23
- Kubota & Done (2004) Kubota A., Done C., 2004, MNRAS, 353, 980
- Kubota & Makishima (2004) Kubota A., Makishima K., 2004, ApJ, 601, 428
- Kuntz et al. (2005) Kuntz K. D., Gruendl R. A., Chu Y., Chen C., Still M., Mukai K., Mushotzky R. F., 2005, ApJ, 620, L31
- Laor (1991) Laor A., 1991, ApJ, 376, 90
- Li (2003) Li X., 2003, ApJ, 596, L199
- Liu et al. (2002) Liu B. F., Mineshige S., Shibata K., 2002, ApJ, 572, L173
- Liu et al. (2007) Liu J., Bregman J., Miller J., Kaaret P., 2007, ApJ, 661, 165
- Liu et al. (2009) Liu J., Bregman J. N., McClintock J. E., 2009, ApJ, 690, L39
- Madau & Rees (2001) Madau P., Rees M. J., 2001, ApJ, 551, L27
- Magdziarz & Zdziarski (1995) Magdziarz P., Zdziarski A. A., 1995, MNRAS, 273, 837
- Makishima et al. (2000) Makishima K. et al., 2000, ApJ, 535, 632
- Malzac & Belmont (2009) Malzac J., Belmont R., 2009, MNRAS, 392, 570
- Mapelli et al. (2009) Mapelli M., Colpi M., Zampieri L., 2009, MNRAS, 395, L71
- Mapelli et al. (2010) Mapelli M., Ripamonti E., Zampieri L., Colpi M., Bressan A., 2010, MNRAS, 1382
- Matsumoto et al. (2001) Matsumoto H., Tsuru T. G., Koyama K., Awaki H., Canizares C. R., Kawai N., Matsushita S., Kawabe R., 2001, ApJ, 547, L25
- Merloni & Fabian (2002) Merloni A., Fabian A. C., 2002, MNRAS, 332, 165
- Middleton et al. (2006) Middleton M., Done C., Gierliński M., Davis S. W., 2006, MNRAS, 373, 1004
- Miller et al. (2004) Miller J. M., Fabian A. C., Miller M. C., 2004, ApJ, 614, L117
- Miller & Colbert (2004) Miller M. C., Colbert E. J. M., 2004, International Journal of Modern Physics D, 13, 1
- Mineshige et al. (1997) Mineshige S., Nomura H., Hirose M., Nomoto K., Suzuki T., 1997, ApJ, 489, 227
- Miniutti & Fabian (2004) Miniutti G., Fabian A. C., 2004, MNRAS, 349, 1435
- Mitsuda et al. (2007) Mitsuda K. et al., 2007, PASJ, 59, 1
- Miyawaki et al. (2009) Miyawaki R., Makishima K., Yamada S., Gandhi P., Mizuno T., Kubota A., Tsuru T. G., Matsumoto H., 2009, PASJ, 61, 263
- Morrison & McCammon (1983) Morrison R., McCammon D., 1983, ApJ, 270, 119
- Nardini et al. (2010) Nardini E., Fabian A. C., Reis R. C., Walton D. J., 2010, MNRAS, 1558
- Niedźwiecki & Zycki (2008) Niedźwiecki A., Zycki P. T., 2008, MNRAS, 386, 759
- Noyola et al. (2008) Noyola E., Gebhardt K., Bergmann M., 2008, ApJ, 676, 1008
- Pakull & Grisé (2008) Pakull M. W., Grisé F., 2008, in American Institute of Physics Conference Series, Vol. 1010, R. M. Bandyopadhyay, S. Wachter, D. Gelino, & C. R. Gelino , ed, A Population Explosion: The Nature & Evolution of X-ray Binaries in Diverse Environments, p. 303
- Pakull et al. (2006) Pakull M. W., Grisé F., Motch C., 2006, in IAU Symposium, Vol. 230, E. J. A. Meurs & G. Fabbiano , ed, Populations of High Energy Sources in Galaxies, p. 293
- Pakull & Mirioni (2003) Pakull M. W., Mirioni L., 2003, in Revista Mexicana de Astronomia y Astrofisica, vol. 27, Vol. 15, J. Arthur & W. J. Henney , ed, Revista Mexicana de Astronomia y Astrofisica Conference Series, p. 197
- Patruno & Zampieri (2008) Patruno A., Zampieri L., 2008, MNRAS, 386, 543
- Piconcelli et al. (2004) Piconcelli E., Jimenez-Bailón E., Guainazzi M., Schartel N., Rodríguez-Pascual P. M., Santos-Lleó M., 2004, MNRAS, 351, 161
- Porter (2010) Porter R. L., 2010, ArXiv e-prints
- Poutanen et al. (2007) Poutanen J., Lipunova G., Fabrika S., Butkevich A. G., Abolmasov P., 2007, MNRAS, 377, 1187
- Reis et al. (2010) Reis R. C., Fabian A. C., Miller J. M., 2010, MNRAS, 402, 836
- Remillard & McClintock (2006) Remillard R. A., McClintock J. E., 2006, ARA&A, 44, 49
- Reynolds et al. (1997) Reynolds C. S., Loan A. J., Fabian A. C., Makishima K., Brandt W. N., Mizuno T., 1997, MNRAS, 286, 349
- Roberts (2007) Roberts T. P., 2007, Astrophysics and Space Science, 311, 203
- Roberts & Colbert (2003) Roberts T. P., Colbert E. J. M., 2003, MNRAS, 341, L49
- Roberts et al. (2003) Roberts T. P., Goad M. R., Ward M. J., Warwick R. S., 2003, MNRAS, 342, 709
- Roberts et al. (2008) Roberts T. P., Levan A. J., Goad M. R., 2008, MNRAS, 387, 73
- Ross & Fabian (2005) Ross R. R., Fabian A. C., 2005, MNRAS, 358, 211
- Ross & Fabian (2007) Ross R. R., Fabian A. C., 2007, MNRAS, 381, 1697
- Ross et al. (2002) Ross R. R., Fabian A. C., Ballantyne D. R., 2002, MNRAS, 336, 315
- Seth et al. (2008) Seth A., Agüeros M., Lee D., Basu-Zych A., 2008, ApJ, 678, 116
- Soria et al. (2005) Soria R., Cropper M., Pakull M., Mushotzky R., Wu K., 2005, MNRAS, 356, 12
- Stobbart et al. (2006) Stobbart A.-M., Roberts T. P., Wilms J., 2006, MNRAS, 368, 397
- Strohmayer (2009) Strohmayer T. E., 2009, ApJ, 706, L210
- Strohmayer et al. (2007) Strohmayer T. E., Mushotzky R. F., Winter L., Soria R., Uttley P., Cropper M., 2007, ApJ, 660, 580
- Strüder et al. (2001) Strüder L. et al., 2001, A&A, 365, L18
- Sunyaev & Titarchuk (1980) Sunyaev R. A., Titarchuk L. G., 1980, A&A, 86, 121
- Svensson & Zdziarski (1994) Svensson R., Zdziarski A. A., 1994, ApJ, 436, 599
- Swartz et al. (2009) Swartz D. A., Tennant A. F., Soria R., 2009, ApJ, 703, 159
- Takahashi et al. (2007) Takahashi T. et al., 2007, PASJ, 59, 35
- Turner et al. (2001) Turner M. J. L. et al., 2001, A&A, 365, L27
- Ueda et al. (2009) Ueda Y., Yamaoka K., Remillard R., 2009, ApJ, 695, 888
- Vaughan et al. (2003) Vaughan S., Edelson R., Warwick R. S., Uttley P., 2003, MNRAS, 345, 1271
- Vierdayanti et al. (2010) Vierdayanti K., Done C., Roberts T. P., Mineshige S., 2010, MNRAS, 403, 1206
- Vink et al. (2001) Vink J. S., de Koter A., Lamers H. J. G. L. M., 2001, A&A, 369, 574
- Walton et al. (2010) Walton D. J., Reis R. C., Fabian A. C., 2010, MNRAS, 408, 601
- Watson et al. (2009) Watson M. G. et al., 2009, A&A, 493, 339
- Wilson & Done (2001) Wilson C. D., Done C., 2001, MNRAS, 325, 167
- Zampieri & Roberts (2009) Zampieri L., Roberts T. P., 2009, MNRAS, 400, 677
- Zezas et al. (2001) Zezas A., Fabbiano G., Prestwich A., Murray S., Ward M., 2001, in Astronomical Society of the Pacific Conference Series, Vol. 249, J. H. Knapen, J. E. Beckman, I. Shlosman, & T. J. Mahoney , ed, The Central Kiloparsec of Starbursts and AGN: The La Palma Connection, p. 425
- Zhang et al. (2009) Zhang W. M., Soria R., Zhang S. N., Swartz D. A., Liu J. F., 2009, ApJ, 699, 281