Detection of brown dwarf-like objects in the core of NGC 3603
Abstract
We used near-infrared data obtained with the Wide Field Camera 3 (WFC3) on the Hubble Space Telescope to identify objects having the colors of brown dwarfs (BDs) in the field of the massive galactic cluster NGC 3603. These are identified through a combination of narrow and medium band filters which span the J and H bands and are particularly sensitive to the presence of the 1.3-1.5m H2O molecular band unique to BDs. We provide a calibration of the relationship between effective temperature and color for both field stars and for BDs. This photometric method provides effective temperatures for BDs to an accuracy of 350K relative to spectroscopic techniques. This accuracy is shown to be not significantly affected by either stellar surface gravity or uncertainties in the interstellar extinction. We identify nine objects having effective temperature between 1700 and 2200 K, typical of BDs, observed J-band magnitudes in the range 19.5-21.5, and that are strongly clustered towards the luminous core of NGC 3603. However, if these are located at the distance of the cluster, they are far too luminous to be normal BDs. We argue that it is unlikely that these objects are either artifacts of our dataset, normal field BDs/M-type giants or extra-galactic contaminants and, therefore, might represent a new class of stars having the effective temperatures of BDs but with luminosities of more massive stars. We explore the interesting scenario in which these objects would be normal stars that have recently tidally ingested a Hot Jupiter, the remnants of which are providing a short-lived extended photosphere to the central star. In this case, we would expect them to show the signature of fast rotation.
1 Introduction
Understanding the origin of brown dwarfs (BDs) is an important component of the theory of star formation and evolution that still remains somewhat mysterious (Whitworth et al., 2007). Moreover, recent observations (Gould et al., 2009) suggest that old substellar field objects may be more common than previously assumed, opening again the debate on whether BDs are ubiquitous and occur in sufficient numbers to account for an appreciable amount of dark matter in the Galaxy (e.g., Tinney, 1999).
Canonical approaches to these research fields include surveys for BDs in the field, studies of the sub-stellar initial mass function (IMF) in young clusters and associations under different star forming conditions, measurements of the disk frequency in the very low-mass regime and investigations of the mass accretion process near and below the substellar boundary (see, e.g., Jayawardhana et al., 2003). However, these overall approaches ultimately rely on the spectral classification of low-mass stars and BDs and, hence, on optical/near-infrared (IR) spectroscopy (see, e.g., McLean et al., 2003; Geballe et al., 2002), which has proved impossible for very faint distant BDs with current telescopes. Thus, the studies conducted so far are limited to galactic clusters and star forming regions within a few kpc from the Sun, while the substellar population of extreme environments, such as the outer/center of the Galaxy or nearby galaxies, are basically unexplored. Such environments are particularly important for low-mass star/BD formation studies because they present properties (stellar density, total cluster mass, number of ionizing OB stars, metallicity, etc.) very different from nearby stellar populations and allow us to probe/discard the numerous scenarios proposed for BD formation (e.g., Joergens, 2005).
To overcome these limitations, new BD classification methods have been devised on the basis of near-IR broad-band (see, e.g., Leggett et al., 2010; Schmidt et al., 2010, and references therein) and narrow-band photometry that targets unique molecular features of L and T dwarfs, in particular H2O and CH4 bands (see, e.g., Gorlova, 2003; Mainzer et al., 2004). These techniques are equivalent to extremely low resolution spectroscopy and can be confidently applied for statistical purposes, e.g. to detect and classify bona fide very low-mass stars and BDs in large imaging surveys. However, such samples are inevitably affected by spectral contamination, since ground-based measurements of the depth of water bands are complicated by the presence of variable water bands in the Earth’s atmosphere itself. Thus, these kinds of studies are more efficiently conducted from space and, indeed, HST/NICMOS photometry has been already used to measure the strength of water bands for BD spectral classification purposes (Najita et al., 2000; Andersen et al., 2006). However, NICMOS’s field of view and sensitivity are still limited (Thompson, 1998). The new Wide Field Camera 3 (WFC3) on board the HST is very sensitive at both optical and IR wavelengths and brings unique capabilities to star formation studies. Specifically, the WFC3 is equipped with a set of four near-IR narrow-band filters spanning the J and H bands and covering H2O molecular features useful for BD characterization, overcoming the contamination by atmospheric water bands affecting ground-based measurements and exceeding the sensitivity and field coverage of NICMOS.
In this paper we present WFC3/IR observations, including narrow-band imaging in the H2O bands, of the young massive cluster in the core of NGC 3603. NGC 3603 (, ) is a galactic giant HII region at a distance of 6-7 kpc (Melena et al., 2008, and references therein). The young (1-20 Myrs, Beccari et al., 2010) compact stellar cluster (HD97950 or NGC 3603YC) lies at the core of this region and has long been the center of attention for the relatively numerous population of massive stars (3 WNL, 6 O3-type stars and numerous late O-type stars). Together, these regions have a bolometric luminosity of 100 times that of the Orion cluster and 0.1 times that of NGC 2070 in the 30 Doradus complex in the Large Magellanic Cloud and a total mass in excess of 104 M⊙ (see Harayama et al., 2008, and references therein). These overall characteristics make NGC 3603 the closest small-scale resolved prototype of the starburst clusters commonly seen in active galaxies and the first natural place to probe the substellar population of an environment very different from those observed so far. The pioneering observations presented in this paper represent the “first look” at a star-burst cluster in the H2O bands and the first attempt to “see” into its BD population.
This paper is organized as follows: Sect. 2 describes the WFC3 observations in NGC 3603 and the data reduction procedure. In Sect. 3 we develop a method to identify and classify BDs on the basis of WFC3/IR colors in the H2O bands, discuss its advantages and limitations in comparison with predictions from synthetic spectra of stars and BDs and use the observations in NGC 3603 to quantify the effect of uncertainties in interstellar extinction. In Sect. 4 and 5 we apply our method to identify objects presenting H2O absorption bands in the field of NGC 3603 and discuss the surprising properties of the selected sample. The conclusions of this work are given in Sect. 6.
2 Observations and data reduction
NGC 3603 was observed between August and November 2009 with the WFC3 on board the refurbished HST in both the optical (UVIS) and infrared (IR) channels as part of the early release science (ERS) program. The analysis of the UVIS data-set has been presented in a previous paper dedicated to the characterization of the stellar population in NGC 3603 and to the study of its star formation history (Beccari et al., 2010). Here we focus on the WFC3/IR observations.
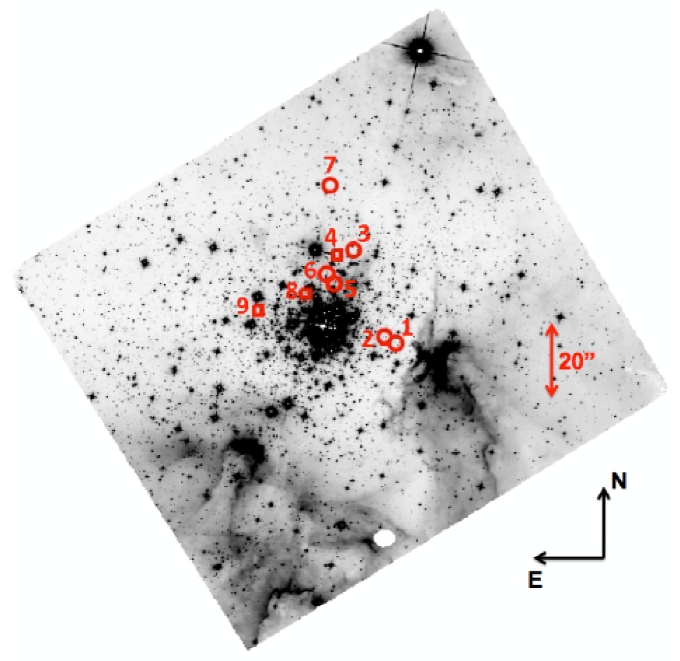
The WFC3 IR detector is a single 10241024 HgCdTe CCD with a total field of view of 123136 at a plate scale of 013 per pixel. The observations in NGC 3603 were performed through the F110W (J-band) and F160W (H-band) broad-band filters, the F127M, F139M and F153M medium-band filters, and the F128N narrow-band filter (see characteristics in Table 1). For each filter, three images with approximately the same exposure time were taken with a constant 3.5 pixel dithering in order to allow for the removal of cosmic rays, hot pixels and other detector blemishes. The WFC3/IR detector is affected by persistence effects, which according to the WFC3 handbook are below the read noise in less than 15 minutes (see Sect. 7.9.4. by Dressel et al., 2010). In order to ensure that persistence spots do not compromise the photometry, especially in the center of the cluster where there is a high concentration of bright OB stars, our observations were performed so that the time interval between two consecutive visits is always longer than 1.5 day (see Table 2). All observations were performed so that the core of NGC 3603 is roughly located at the center of the camera’s field of view (FoV). In Figure 1 we show a mosaic of the images in the F110W filter as obtained with the PyRAF/MULTIDRIZZLE package.
The photometric analysis of the entire data-set was performed on the flat-fielded (FLT) images multiplied by the pixel-area maps to get uniformity in the measured counts of an object across the field. About 150 isolated and well-exposed stars were selected in every image over the entire FoV in order to properly model the point spread function (PSF) with the DAOPHOTII/PSF routine (Stetson, 1987). We find that a first order polynomial gives a good approximation to the PSF variation across the FoV. A first list of stars was generated by searching for objects above the 3 detection limit in each individual image and a preliminary PSF fitting was performed using DAOPHOTII/ALLSTAR. We then used DAOMATCH and DAOMASTER to match all stars in each chip, regardless of the filter, in order to get an accurate coordinate transformation between the frames. A master star list was created using stars detected in the F110W image (the deepest of the IR data-set) with the requirement that a star had to be detected in at least two of the three images in this filter. We used the sharpness (sh) and chi square (chi) parameters given by ALLSTAR to remove spurious detections. The final catalogue was then obtained by rejecting residual spurious sources (30%) through visual inspection of the drizzled images. The master list was then used as an input for ALLFRAME (Stetson, 1994), which simultaneously determines the brightness of the stars in all frames while enforcing one set of centroids and one transformation between all images. All the magnitude values for each star were normalized to a reference frame and averaged together, and the photometric error was derived as the standard deviation of the repeated measurements. The final catalogue contains photometry in the F110W, F160W, F127M, F128N, F139M and F153M filters for 9693 stars.
The photometric calibration to the standard VEGAMAG photometric system was performed following Kalirai et al. (2009). A sample of bright isolated stars was used to correct the instrumental magnitudes to a fixed aperture of 04. The magnitudes were then transformed into the VEGAMAG system by adopting the synthetic zero points for the WFC3/IR bands given by Kalirai et al. (2009) (see their Table 5).
The WFC3/IR channel is affected by geometric distortion and a correction is necessary in order to properly derive the absolute positions of individual stars in each catalogue. We used the distortion coefficients derived by Kozhurina-Platais et al. (2009) to obtain relative star positions that are corrected for distortion. We then used the stars in common between our IR and the 2MASS catalogues to derive an astrometric solution and obtain the absolute R.A. and Dec. positions of our stars. We find a systematic residual of 0.3 with respect to the 2MASS coordinates.
In Table 2 we summarize the exposure times, saturation limits and limiting magnitudes at the 3 level in each filter. At the distance (6-7 kpc) and age (1-20 Myr) of NGC 3603 and in the absence of interstellar extinction, these limiting magnitudes correspond to cluster members with masses down to 0.150.2 M⊙, according to the pre-main sequence (PMS) isochrones by Baraffe et al. (1998) specifically calculated for the HST/WFC3 filters111Available at http://perso.ens-lyon.fr/isabelle.baraffe/. Considering the typical extinction of AV=5.5 mag toward the center of NGC 3603 (Sect. 3.2), the mass limit would be 0.4 M⊙. The large uncertainty on the distance to NGC 3603 (1 kpc or more; Melena et al., 2008) results in an uncertainty on our photometric limits of about 0.5 mag, i.e. 0.05 M⊙ for cluster members. This means that our observations probe the cluster population down to the substellar boundary in the ideal case of no extinction and should be too shallow to detect sub-stellar members. However, as we will see in Sect. 4 and 5, we identified a sample of very cool objects presenting H2O absorption bands that are likely members of NGC 3603. Our method to identify objects with H2O in absorption is based on the use of color indices (Sect. 3) and, hence, is not affected by the uncertainty on the cluster distance.
| Filter | aaAs defined in Sect. 7.5 of Dressel et al. (2010). | aaAs defined in Sect. 7.5 of Dressel et al. (2010). | ZpbbFrom Kalirai et al. (2009). |
|---|---|---|---|
| (nm) | (nm) | ||
| F110W | 1153.4 | 443.0 | 26.07 |
| F127M | 1274.0 | 68.8 | 23.69 |
| F128N | 1283.2 | 15.9 | 21.98 |
| F139M | 1383.8 | 64.3 | 23.42 |
| F153M | 1532.2 | 68.5 | 23.21 |
| F160W | 1536.9 | 268.3 | 24.70 |
| Filter | Dithering | Star time | Texp | Mag Sat. | Mag 3 |
|---|---|---|---|---|---|
| (Julian day) | (sec) | ||||
| F110W | 1 | 55070.226 | 3200 | 12.0 | 20.5 |
| 2 | 55070.291 | ||||
| 3 | 55070.357 | ||||
| F127M | 1 | 55070.241 | 3800 | 10.0 | 20.0 |
| 2 | 55070.306 | ||||
| 3 | 55070.372 | ||||
| F128N | 1 | 55070.251 | 3400 | 9.0 | 19.5 |
| 2 | 55070.315 | ||||
| 3 | 55070.382 | ||||
| F139M | 1 | 55070.453 | 3800 | 10.0 | 20.0 |
| 2 | 55070.519 | ||||
| 3 | 55070.586 | ||||
| F153M | 1 | 55070.424 | 3800 | 9.5 | 19.5 |
| 2 | 55070.491 | ||||
| 3 | 55070.557 | ||||
| F160W | 1 | 55070.229 | 3200 | 11.5 | 19.5 |
| 2 | 55070.294 | ||||
| 3 | 55070.360 |
3 Using WFC3 narrow-band photometry to characterize brown dwarfs
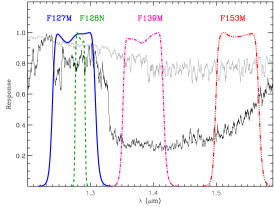
The WFC3 is equipped with a set of four near-IR medium and narrow-band filters centered at 1.27m (F127M), 1.28m (F128N), 1.39m (F139M), and 1.53m (F153M). The F139M filter probes the H2O absorption band centered at 1.4m while the F153M filter measures the edge of this band (Figure 2) and is also sensitive to methane absorption. Other molecular absorption lines (CN, HCN, metal hydrides and alkali metals) characterize the spectrum of very cool objects (T3000 K) between 1.3 and 1.5m, however H2O is by far the strongest molecular absorber in this wavelength range (Kirkpatrick et al., 1999, 2005). Because this H2O feature is unique to very cool objects (see Figure 1 in Mainzer et al., 2004), the F139M and F153M filters can be used to identify very low-mass stars and BDs and estimate their approximate effective temperature by measuring the strength of the water absorption bands, provided the stellar continuum in this wavelength region is known. This information is easily obtained by combining measurements in the other two filters. Indeed, F127M can be used as the primary continuum filter for it covers a wavelength range relatively featureless in late-type objects; the only contamination expected in this wavelength range comes from the Paschen- line (1.2818m), which is expected to be in emission in young accreting objects (see, e.g., Folha & Emerson, 2001) and is present in nebulous regions as well (see, e.g., Kennicutt, 1998). The narrow F128N filter, centered at 1.28m with a bandwidth of 15.9 nm, is a good indicator of the possible contamination due to the Paschen- emission line. Thus, the flux ratio between the F139M and F153W bands with respect to the continuum, corrected for Paschen- emission, gives a good measure of the strength of the water absorption bands.
Our images are produced in units of electrons/sec and, hence, the counts scale with the bandwidth of the filter. Thus, to compute the flux density (Flux) in the continuum and the water line, we divided the corresponding counts (C) by the effective bandwidths of the filters:
| (1) |
| (2) |
| (3) |
where , , and are the bandwidths of the four filters reported in Table 1. Equations 1-3 implicitly assume that the adopted filters have a rectangle response curve (top-hat filters), which is realistic in the case of WFC3/IR filters (Figure 2).
We then convert the flux density in magnitude (mag) and define two narrow-band indices, I(139)= and I(153)=, which are a measure of the water absorption and can then be used to identify very late-type objects and estimate their effective temperature.
In order to verify this approach, we built an empirical relation between these color indices and the effective temperature by using the actual spectra of 552 stars and BDs available from the literature. These objects range in spectral type from O5 to T9 (Teff=45000-600 K) and were drawn from the Bruzual-Persson-Gunn-Stryker (BPGS) atlas (Strecker et al., 1979; Gunn & Stryker, 1983), the Brown Dwarfs Spectroscopic Survey (BDSS, McLean et al., 2003), the SpeX Prism Spectral Libraries (SpeX)222http://www.browndwarfs.org/spexprism/ and the spectroscopic databases for very low-mass stars and BDs by Reid et al. (2001), Testi (2009), and B. Burningham (private communication). Using the WFC3/IR filter transmission curves and the STSDAS/Synphot synthetic photometry package in IRAF, we calculated the magnitudes of each object in each band by integrating the total flux in that band. Magnitudes are given in the VEGAMAG photometric system using the zero points for the WFC3/IR filters listed in Table 1. Figure 3 shows the relation between the two water-band indices, derived from the observed spectra, and the effective temperatures (Teff) of the 137 stars and BDs in our sample. The figure shows that there is reasonable agreement between all of the sets of observations and the thick solid line represents the mean relation derived by averaging the measurements within steps of 250 K. Down to T3500 K, both the I(139) and I(153) color indices have a mean value close to zero, indicating that no water is present in the spectrum. The onset of the water-vapor absorption feature is clearly seen below T3500K, where both color indices become more and more negative as Teff decreases. This decrease is roughly monotonic in the range 3500500K for I(139) and in the range 2500500K for I(153) and, hence, these color indices can be used for BD spectral classification purposes.
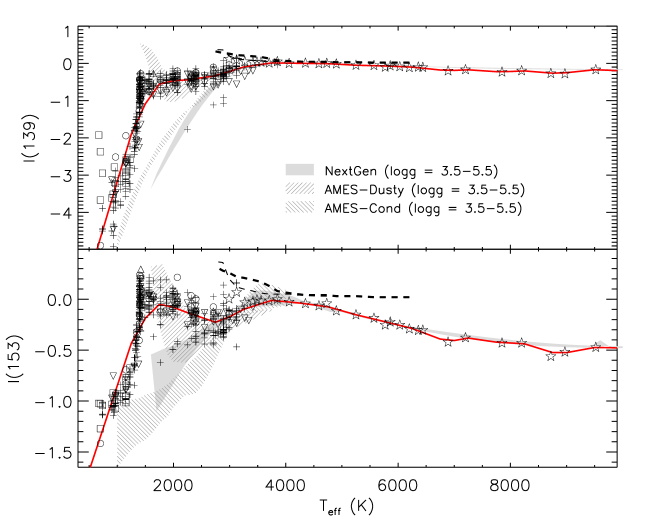
We compared this empirical relation with expectations from model spectra of very-low mass stars and BDs. This can give further insight into the physical processes occurring in their atmosphere, which are still not clear (see Chabrier et al., 2000, and references therein). We used the NextGen, AMES-Dusty and AMES-Cond model spectra which are, to our knowledge, the most complete grids of model atmospheres for late-type objects currently available. The NextGen models are dust-free model atmospheres (see Hauschildt et al., 1999). The AMES-Dusty and AMES-Cond models (Allard et al., 2001) take into account the formation of condensed species, which depletes the gas phase of a number of molecular species and refractory elements, modifying significantly the atmospheric structure and, hence, the emergent spectrum. While in the AMES-Dusty models the condensed species are included both in the equation of state and in the opacity, taking into account dust scattering and absorption, in the AMES-Cond models the opacity of these condensates is ignored, in order to mimic a rapid gravitational settling of all grains below the photosphere. For further details about these grids of models we refer to Chabrier et al. (2000). The color indices of the model spectra were derived by folding them with the WFC3/IR filters, as was done with the actual spectra. The grey-filled areas in Figure 3 show the color vs. Teff dependency for the three sets of models. The comparison between the model predictions and the spectroscopic data shows that:
-
1.
The relation between both our narrow-band color indices and Teff depends on stellar gravity, as indicated by the shaded areas in Figure 3, which encompasses all the calibrations for models in the range . This variation with is more significant for the I(153) color index, but in any case is well within the spread of the spectroscopic data;
-
2.
the predictions by the three sets of models are in good agreement with the actual spectra down to 3000K;
-
3.
below 3000K the predictions of the three sets of models differ significantly from one another because the effect of dust grain formation in the atmospheres is treated differently, as explained above, and below 2000K they clearly disagree with the actual spectra. Data from the actual spectra show a linear decrease of both color indices with Teff, more similar to the prediction by the AMES-Cond models. However, for both color indices this decrease is less steep than that predicted by the AMES-Cond models, mimicking an average behavior between the AMES-Cond and the AMES-Dusty models. In other words, the data support a scenario where both dust gravitational settling and scattering/absorption operate in the atmosphere of very cool objects and, hence, affect their spectrum.
Allard et al. (2001) suggest the use of the NextGen models for T2700K, the AMES-Dusty models for 1700K2700K, and the AMES-Cond models for T1400K. Between 1700 and 1400K, a new set of models (AMES-Settl) are being studied and are still in the experimental phase333See F. Allard web-page: http://perso.ens-lyon.fr/france.allard/. Indeed, Figure 3 shows that this prescription roughly reproduces the trend obtained from the observed spectra. In particular, the AMES-Dusty models are roughly consistent with the I(139) and I(153) colors for 1700K2000K, while the AMES-Cond models underestimate both colors for T1400K for any stellar gravity in the range . Thus, given the large uncertainties affecting model predictions in this temperature range, we conclude that the mean relation between the water-band indices and Teff derived from the observed spectra (solid line in Figure 3) is more reliable for the identification and classification of BDs. We report this calibration relation in tabular form in Table 3; the uncertainties on the color indices are calculated as the dispersion of the data in each temperature bin.
We also show in Figure 3 the ground-based H2O indices computed by Aaronson et al. (1978) as a function of effective temperature for giant and dwarf stars. These indices were used for quite some time in constructing population synthesis models for galaxies and clusters. It is then reassuring to see that our I(139) color index perfectly reproduces the trend of the Aaronson et al. (1978) H2O indices, while the I(153) only slightly underestimates them. Note that this agreement is not straightforward because the measurements were taken from different facilities (one ground-based, the other a satellite), different filters, different continuum estimates, etc.
| Spec.† | Teff | I(139) | I(153) |
|---|---|---|---|
| Type | (K) | ||
| T9 | 500 | -5.700.34 | -1.680.05 |
| T8 | 750 | -4.430.38 | -1.270.01 |
| T6 | 1000 | -3.170.41 | -0.850.08 |
| T4.5 | 1250 | -1.900.45 | -0.430.15 |
| L6.5 | 1500 | -1.080.33 | -0.190.14 |
| L4.5 | 1750 | -0.560.11 | -0.050.08 |
| L2.5 | 2000 | -0.490.09 | -0.080.07 |
| L1.5 | 2250 | -0.440.10 | -0.130.07 |
| L0 | 2500 | -0.390.10 | -0.180.06 |
| M8 | 2750 | -0.330.10 | -0.230.06 |
| M6 | 3000 | -0.210.09 | -0.170.06 |
| M4 | 3250 | -0.100.08 | -0.100.06 |
| M2.5 | 3500 | -0.040.05 | -0.050.03 |
| M0.5 | 3750 | 0.010.02 | -0.010.01 |
| K7.5 | 4000 | 0.010.01 | -0.020.01 |
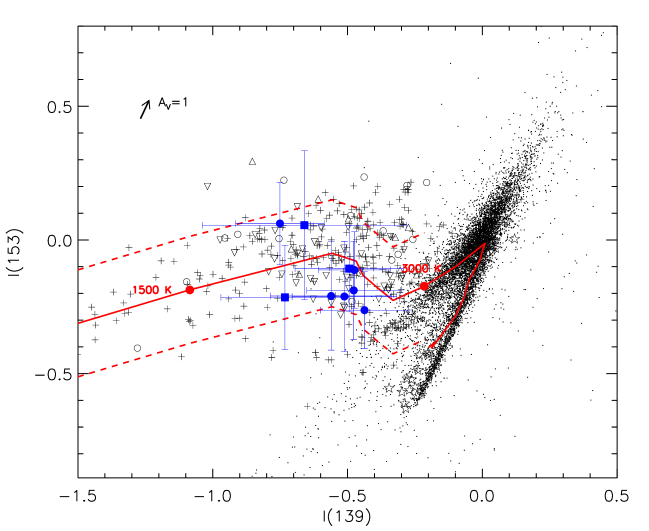
Figure 4 shows the I(139) vs. I(153) color-color plot derived from our calibration (thick solid line). This diagram shows that, when no information on the effective temperature of an object is available, WFC3 photometry in the four near-IR bands can be used to give an estimate of its Teff value. In particular, objects close to or below the sub-stellar limit (T3000K) are expected to be located in a region of this diagram well separated from that of more massive stars. We also used our BD reference sample to estimate the accuracy on the color-derived Teff. We performed a linear fit of the spectroscopic Teff of the BDs in our reference sample as a function of the Teff predicted by the colorcolor relation. The computed RMS indicates that the two sets of measurements agree within 350 K. Thus, the accuracy of our method is sufficient for BD identification purposes, even though it provides only a rough estimate of their effective temperature. Two caveats must be taken into account: i) our Teff estimate is based on the assumption that uncertainties on magnitude are not higher than 10% in each of the four filters; ii) there has been a controversy in recent years over the spectroscopic effective temperatures scale for L and T dwarfs in that differences of the order of 250 K exist among different calibrations (see, i.e., Basri et al., 2000; Schweitzer et al., 2001, 2002).
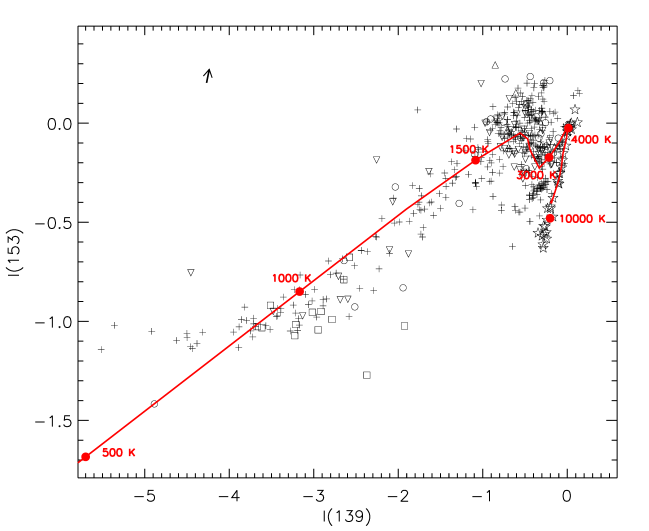
Since our calibration relation is based on the use of near-IR filters that are very close to each other in central wavelength, it is only slightly affected by uncertainties on interstellar extinction (Figure 4). This makes our method particularly suitable to identifying BD candidates in young clusters, where extinction is normally highly variable. This issue is further discussed in Sect. 3.2.
3.1 Using the J-band as the primary continuum filter
In this section we discuss the adoption of the WFC3/IR J-like bands as the primary continuum indicators when computing the I(139) and I(153) color indices.
As explained in Sect. 3, the use of the F128N filter allows us to correct the continuum emission for the possible contamination due to the Paschen- line, which is expected to be in emission in young accreting objects (see, e.g., Folha & Emerson, 2001). However, since F128N is a narrow-band filter (13.54 nm), long exposure times are required to reach a photometric depth suitable for BD detection in distant star forming regions. Using the WFC3/IR-imaging exposure time calculator444http://etc.stsci.edu/webetc/mainPages/wfc3IRImagingETC.jsp, we estimate that observations through the narrow F128N filter typically require an exposure time five times longer than for the three medium-band filters (F127M, F139M and F153M) to reach the same photometric depth. Thus, observations through the F128N filter are very time consuming and dominate the required observing time.
For those objects which are not expected to accrete (e.g. field BDs) and are not located in nebular regions, the J-band filter can be used as a continuum filter. The WFC3/IR camera is equipped with two J-like filters: F110W and F125W. In Table 4 we provide the calibration relations between the water-band indices I(139) and I(153) and the effective temperature when the continuum is estimated using these two J-like filters. Note that, because both F110W and F125W are wide-band filters, the continuum estimates based on the use of these filters are slightly more sensitive to uncertainties in interstellar reddening.
| Continuum filter F110W | Continuum filter F125W | ||||
|---|---|---|---|---|---|
| Spec.† | Teff | I(139) | I(153) | I(139) | I(153) |
| Type | (K) | ||||
| T9 | 500 | -5.260.58 | -1.250.23 | -5.230.57 | -1.220.24 |
| T8 | 750 | -4.100.54 | -0.930.22 | -4.080.53 | -0.920.22 |
| T6 | 1000 | -2.940.51 | -0.620.21 | -2.940.50 | -0.620.20 |
| T4.5 | 1250 | -1.770.47 | -0.310.20 | -1.790.46 | -0.320.19 |
| L6.5 | 1500 | -1.010.33 | -0.110.16 | -1.040.32 | -0.140.14 |
| L4.5 | 1750 | -0.500.11 | 0.020.10 | -0.530.10 | -0.020.08 |
| L2.5 | 2000 | -0.390.11 | -0.010.11 | -0.440.09 | -0.050.08 |
| L1.5 | 2250 | -0.340.14 | -0.030.13 | -0.410.11 | -0.100.08 |
| L0 | 2500 | -0.320.13 | -0.110.10 | -0.370.10 | -0.160.07 |
| M8 | 2750 | -0.300.11 | -0.200.08 | -0.320.10 | -0.220.06 |
| M6 | 3000 | -0.210.09 | -0.170.07 | -0.220.09 | -0.180.06 |
| M4 | 3250 | -0.110.08 | -0.110.07 | -0.120.07 | -0.120.06 |
| M2.5 | 3500 | -0.090.05 | -0.100.05 | -0.090.04 | -0.100.04 |
| M0.5 | 3750 | -0.070.03 | -0.100.03 | -0.060.01 | -0.080.02 |
| K7.5 | 4000 | -0.140.02 | -0.170.02 | -0.090.01 | -0.110.01 |
3.2 Quantifying the effect of interstellar extinction
In this section we use the observations in NGC 3603 to quantify the effect of uncertainties in interstellar extinction on our BD classification method.
Figure 5 shows the dereddened I(139) vs. I(153) color-color diagram for point-like sources in the field of NCG 3603. In order to correct our magnitudes for interstellar extinction, we followed the study of differential reddening in NGC 3603 by Sung & Bessel (2004). These authors were able to map the variation of E(B-V) as a function of the distance from the cluster centre (see their Figure 5b) using multi-band HST photometry of the bright massive stars (which are saturated in our images). They found that the value AV=4.5 is representative of the very centre of the OB stars association, while they noticed an increase toward the external regions. Adopting the total-to-selective extinction ratio (RV) value of 3.55, suggested by Sung & Bessel (2004), we estimate the value of AV =5.5 (i.e. A1.5) to be representative of the mean visual extinction in the area sampled by our observations (from 10 to 70). We adopted this value of AV and the extinction law by Cardelli et al. (1989) to correct the magnitude of stars in our catalogue. As shown in Figure 5, the dereddened photometry matches rather well our calibration relation, thus confirming the accuracy of our method.
As mentioned in Sect. 3, since our calibration relation is based on the use of near-IR filters that are very close to each other in central wavelength, it is only slightly affected by uncertainties on interstellar reddening (see also Mainzer et al., 2004). The arrow in Figure 5 represents the reddening vector for AV=1, which is the typical uncertainty in NGC 3603. This uncertainty in interstellar extinction translates the data points by 0.03 mag in I(139) and 0.07 mag in I(153), i.e. within the photometric uncertainties.
Note also that, for large values of AV, RV depends on the intrinsic color of the star because of flux weighting through the different filter response functions (Wildey, 1963, and references therein). However, the fact that we compute colors from filters very close to each other in central wavelength makes this dependency moot.
4 Selection of objects with water-vapor absorption in NGC 3603: what are they?
As seen in Sect. 2, our observations in NGC 3603 probe the cluster population down to the substellar boundary in the best case, i.e. in the absence of extinction, and hence we do not expect to detect any object presenting H2O absorption bands belonging to this cluster. However, the dereddened I(139) vs. I(153) color-color diagram of the point-like sources in the field of NCG 3603 (Figure 5) surprisingly shows a number of objects located in the region expected for BDs with significant absorption in the water bands (i.e. T3000K).
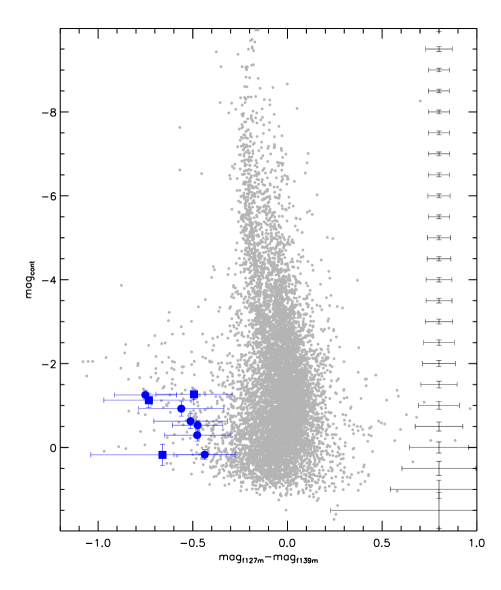
In order to systematically isolate this group of points, we first considered the calibration relation I(139) vs. I(153) in the substellar domain and calculated the dispersion () of the spectroscopic data used to derive this relation. We then selected all objects below T3000K having colors consistent with the calibration relation within 1 and whose photometric uncertainties still place the object within 3 of the mean calibration relation. These criteria take into account that, when measuring spectral line intensities, narrow-band photometry is necessarily less accurate than spectroscopy. We identified in this way 9 objects with absorption in the water bands, shown as filled circles/squares in Figure 5. In Figure 6 we plot the position of these 9 objects on the dereddened vs. color-magnitude diagram. There are 9 objects which are singled out as interesting sources because they exhibit more negative colors with respect to the remaining sources in the observed field, due to the 1.4m absorption band. Note that there are a number of objects with colors similar to these 9 objects which were not selected on the basis of Figure 5, because they have larger photometric uncertainties on the I(139) and I(153) indices and do not satisfy our selection criteria.
In Table 5 we list the observed WFC3/IR photometry for the 9 objects with water-vapor absorption and their derived effective temperatures, which lie in the range 1700-2200K. Their J-band observed magnitudes lie in the range 19.5-21.5; assuming the distance modulus of NGC 3603 (14 mag) and the average interstellar reddening in its direction (A1.5), this range corresponds to J-band absolute magnitudes between 4.1 and 6.1 and to stellar luminosities in the range 0.6-4 L⊙.
| ID | RA J2000) | DEC J2000 | mF110W | mF127M | mF128N | mF139M | mF153M | mF160W | Teff | Spectral† |
|---|---|---|---|---|---|---|---|---|---|---|
| (hh:mm:ss) | (dd:mm:ss) | (K) | Type | |||||||
| 1 | 11:15:04.79 | -61:15:42.85 | 20.650.12 | 20.270.11 | 20.180.15 | 20.430.10 | 19.660.11 | 19.580.09 | 2100 | L2 |
| 2 | 11:15:04.93 | -61:15:42.75 | 20.430.13 | 19.980.14 | 20.080.17 | 20.130.08 | 19.350.11 | 19.230.09 | 2000 | L2.5 |
| 3 | 11:15:06.17 | -61:15:17.75 | 21.440.06 | 20.830.08 | 21.130.40 | 20.850.11 | 20.200.08 | 20.220.07 | 2200 | L1.5 |
| 4‡ | 11:15:06.82 | -61:15:19.26 | 19.730.23 | 19.480.14 | 19.550.14 | 19.850.16 | 18.850.09 | 18.670.12 | 1700 | L5 |
| 5 | 11:15:06.98 | -61:15:26.49 | 19.910.11 | 19.370.09 | 19.540.12 | 19.740.12 | 18.450.10 | 18.320.10 | 1700 | L5 |
| 6 | 11:15:07.00 | -61:15:25.98 | 20.460.15 | 19.660.14 | 19.640.17 | 19.880.14 | 19.050.09 | 18.790.09 | 1900 | L3.5 |
| 7 | 11:15:07.06 | -61:14:59.93 | 20.740.07 | 20.050.09 | 20.020.13 | 20.190.06 | 19.350.08 | 19.360.06 | 2100 | L2 |
| 8‡ | 11:15:08.04 | -61:15:29.59 | 19.630.11 | 19.360.10 | 19.510.17 | 19.470.16 | 18.610.10 | 18.410.09 | 2100 | L2 |
| 9‡ | 11:15:09.85 | -61:15:34.44 | 21.460.15 | 20.700.18 | 20.490.25 | 21.080.28 | 19.890.11 | 19.920.11 | 1700 | L5 |
† Spectral types are inferred using the temperature scale by Vrba et al. (2004).
‡ Possible photometric contamination from nearby bright/saturated stars.
Since the photometric sensitivity of our data does not allow us to detect NGC 3603 members below 0.15-0.2 M⊙ in the ideal case of no extinction, we now investigate what these objects are. Before exploring the various possibilities, we collect further hints on the nature of these objects making use of our observations in the broad-band F110W (J-band) and F160W (H-band) filters:
-
1.
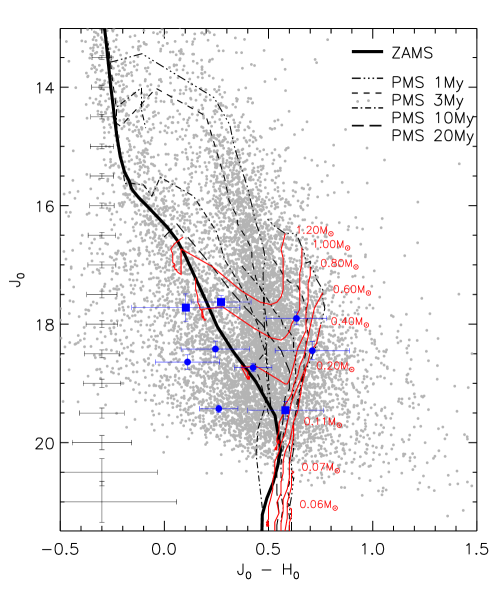
Figure 7 shows the dereddened vs. color-magnitude diagram (CMD) for the point-like objects detected in NGC 3603 together with the zero age main sequence (ZAMS) of Marigo et al. (2008), which roughly separates the locus expected for field main-sequence (MS) stars from the PMS star locus, and the PMS isochrones and evolutionary tracks by Baraffe et al. (1998) and Siess et al. (2000), which take H2O and other prominent near-IR absorption features into account555Note that isochrones have been corrected for a constant color term of =0.18 mag to account for the difference between the standard Johnson’s filter and the WFC3 F110W and F160W filters.. The position of the 9 objects with water absorption in this CMD indicates that their luminosity is comparable to that of PMS/MS stars with masses between M⊙, i.e. much higher than expected for PMS objects with a surface temperature in the range 1700-2200K. Moreover, only a few of them have colors typical of such cool PMS objects, while the majority appear to be bluer and, hence, older. While the over-luminosity of these 9 objects has no straightforward explanation (see Sect. 5), their peculiar colors can be partly explained considering the star formation history of NGC 3603. Indeed, the analysis by Beccari et al. (2010) focused on stars with H excess emission, a robust indicator of youth (e.g., White & Basri, 2003), found that star formation in and around the cluster has been ongoing for at least 10-20 Myr; 2/3 of the young population have ages from 1 to 10 Myr with a median value of 3 Myr according to their position on the CMD, while 1/3 of them lie at or near the ZAMS, thus suggesting a considerably higher age, of order of 20-30 Myr. The 9 objects with water-vapor absorption appear to follow the same behavior, being spread between the PMS region of the CMD and the ZAMS. Although the statistic of this sample is hardly significant, we note that percentages are reversed with respect to the H emitters population, i.e. 2/3 of the objects with absorption in the water bands lie near the ZAMS and only 1/3 (i.e. 2-3 objects) are located in the PMS region;
-
2.
The spatial distribution of the 9 objects with water-vapor absorption appears to be strongly clustered towards the luminous core of NGC 3603 (see Figure 1). We attempt to use a Kolmogorov-Smirnov (KS) test to check whether the radial distribution of these 9 objects with respect to the cluster center is consistent with that of the cluster members (see Beccari et al., 2010, for a detailed description of this test). The small number statistic makes the results of this test not highly reliable; however, the general indication is that these 9 objects are more centrally concentrated than the field population, mimicking the radial distribution of the young stars belonging to the cluster. We also noticed that all 9 objects are preferentially located on the North side of NGC 3603 (Figure 1). The presence of pillars in the South region suggests a higher gas and dust density which could prevent us from detecting faint objects on this side of the cluster. A high resolution extinction map of NGC 3603 has been recently computed (X. Pang & A. Pasquali, private communication) using WFC3 narrow-band imaging in the H (Beccari et al., 2010) and Pa lines (this work). The very preliminary result of this extinction study does not show a significant difference in reddening between the north and south regions of the cluster for the depth probed by the H and Pa lines. However, the higher gas density in the South region can shield circumstellar disks from the radiation field of NGC 3603 more efficiently. This implies that circumstellar disks in the North and South region of the cluster might undergo different evolutionary paths. Indeed, as we well see in Sect. 5, the observed properties of our 9 objects may be related to a specific disk dispersal mechanism, i.e. planet formation.
Further clues as to the evolutionary phase of these 9 objects were obtained from optical broad-band and narrow-band H photometry, which would allow us to put constraints on the mass accretion process typical of very young objects (see, e.g., De Marchi et al., 2010). We cross-matched our WFC3/IR catalog with the optical WFC3/UVIS catalog of sources in NCG 3603 by Beccari et al. (2010). However, the 9 objects in exam are either not detected in the optical or do not have sufficient photometric accuracy to apply the method by De Marchi et al. (2010), which requires detection in the three , and H bands to determine the mass accretion rate of PMS objects.
We also searched for previous ground- and space-based observations of these 9 objects that could provide some hint on their variability.
Two ground-based imaging surveys of NCG 3603 are available to date: the survey conducted with ISAAC@ESO-VLT by Brandl et al. (1999) (see also Andersen, 2005) and the deep, high angular resolution survey conducted with NAOS-CONICA@ESO-VLT by Harayama et al. (2008). The spatial resolution and sensitivity of the ISAAC data is 2-3 times poorer than for the WFC3 data. Thus, we could not retrieve accurate photometry of our 9 objects, which are located very close to the cluster center. However, all 9 objects are visible, though very faint, in -band images. In the and -band images, only 3 of them are detected with sufficient accuracy to attempt photometry and the magnitudes we retrieved are consistent with the WFC3 ones within the photometric uncertainties. Only 3 of our 9 objects (namely ID 5, ID 6 and ID 8) are located in the central 2828 area of NGC 3603 observed with NAOS-CONICA. Moreover, these observations have a detection limit of J20 (see Figure 3-4 in Harayama et al., 2008), while our 9 objects have magnitudes very close to this limit or fainter. Thus, the ground-based observations available to date for NGC 3603 do not complement our WFC3-IR dataset.
NGC 3603 has been observed both with ACS (Advanced Camera for Surveys) and NICMOS (Near Infrared Camera and Multi-Object Spectrometer) on board of the HST using several narrow and wide-band filters spanning the 0.22-1.6m wavelength range. These observations were performed on 2005 December 29 and 1997 September 24, respectively. We retrieved the multi-drizzled images of this dataset from the HST Legacy Archive666http://hla.stsci.edu/. Our 9 objects are not detected in the NICMOS F110W and F160W images because of their limited photometric depth (see also Moffat et al., 2004), but are detected in the ACS images in the F435W and F850LP filters and their magnitudes are reported in Table 6.
Recently, Rochau et al. (2010) presented a proper motion study of the core of NGC 3603 based on HST/Wide Field Planetary Camera 2 (WFPC2) observations obtained 10 years apart, respectively, in 1997 and 2007. Only 3 of the 9 objects with water absorption fall in the 3434 area observed with the Planetary Camera (PC) and none of them is detected, most likely because their visual magnitude is fainter than the detection limit (m25) of the Rochau et al. (2010) dataset.
| ID | mF435W | mF850LP |
|---|---|---|
| 1 | - | 23.6030.547 |
| 2 | - | 23.2430.465 |
| 3 | 25.8630.797 | 23.6250.555 |
| 4 | - | 22.4370.323 |
| 5 | 27.5971.839 | 21.6850.229 |
| 6 | 26.6591.171 | 21.8200.244 |
| 7 | 28.2292.453 | 23.4260.505 |
| 8 | 25.5320.728 | 22.0360.282 |
| 9 | - | 23.7720.601 |
5 Discussion
Our exploratory narrow-band survey of NGC 3603 has led to the surprising identification of 9 objects considerably more luminous than BDs which nonetheless display water-vapor absorption bands typical of BDs. Here we discuss possible explanations:
-
1.
Contamination from field objects: The most immediate explanation would be that the 9 objects presenting water-vapor absorption are field objects unrelated to NGC 3603. Under this hypothesis, these 9 objects could be either foreground field BDs or background early M-type super-giant stars, where the presence of H2O absorption was confirmed by Tsuji (2000). Moreover, long period variables and late M-type supergiants in metal poor environments can have strong H2O absorption and, hence, bluer colors than expected for their Teff (see, e.g., Elias et al., 1985; Lebzelter et al., 2010). All these hypotheses would explain why these objects appear over-luminous with respect to cluster BDs and why they are mainly located on the ZAMS in the CMD (Figure 7), but on the other hand there are a number of objections to it: a) there is no explanation for the concentration of the contaminants around the center of NGC 3603 (Figure 1); b) metallicity studies in the direction of NGC 3603 confirm that the typical Galactic solar metallicity (z = 0.020) is appropriate for this region (Smartt et al., 2002; Peimbert et al., 2007; Lebouteiller et al., 2008); c) the Robin et al. (2003) model of the Galactic stellar distribution does not predict any M-type super-giants in the 0.002 area observed towards NGC 3603; d) using the magnitude limits given in Table 2, the Cruz et al. (2007) luminosity function, and the distribution of L and T dwarfs in the Galaxy by Ryan et al. (2005), we find a predicted count in our field of 0.16 L-dwarfs for no extinction and 0.04 if the line-of-sight extinction is AV=5.5 mag (Sect. 3.2). However, Galactic counts models become more and more inaccurate towards the very low-mass regime and the predicted number depends on the adopted model. On the other hand, using other models (D’Antona, 1999; Robin et al., 2003) would also result in no more than 1 or 2 LT dwarfs in this field. Thus, we do not expect to pick up any appreciable number of interloping field LT-dwarfs in the observed area towards NGC 3603. For all these reasons, Galactic field stars do not appear to be a major source of contamination of our sample of objects with water-vapor absorption.
-
2.
Extra-galactic contamination: It is generally very hard to distinguish between an extended sources and background compact galaxies on the basis of broad-band colors alone (see, e.g., Yan et al., 2008). Our sample of water-vapor absorbers might then be contaminated by extra-galactic objects. From the most recent J-band galaxy number counts (see Table 1 and Figure 17 by Cristóbal-Hornillos et al., 2009), the expected number of background galaxies with 19.521.5, i.e. the magnitude range of the 9 objects under examination, in the observed 0.002 area is 1. In addition, active galaxies usually show near-IR water lines in emission because of the presence of water vapor masers (e.g. Braatz et al., 2003). Hence, they are not a likely source of contamination.
-
3.
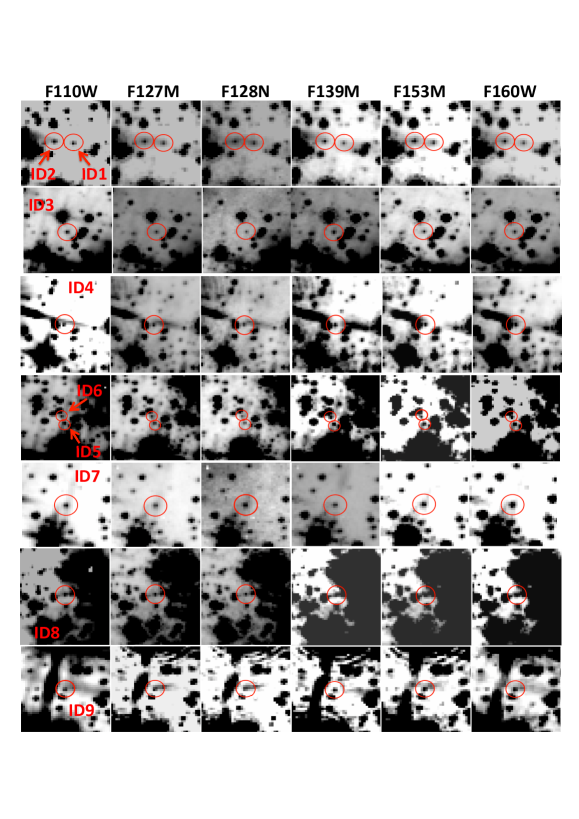
Artifacts: Another hypothesis to check is whether there is some artifact in the data that has biased us towards finding cluster-centric sources. Our images are not significantly affected by instrumental effects, such as vignetting, optical ghosts or image degradation moving away from the center, that could have caused bias in the selection. All 9 selected sources are well detected in our images, with a signal-to-noise ratio better than 5 in all 6 filters (Figure 8). Moreover, all of them are visible, though very faint, in the ISAAC and ACS images (Sect. 4). This demonstrates that they are not spurious detections. We have also checked whether the magnitudes of these 9 objects could be somehow affected by nearby bright/saturated stars. Also this possibility appears to be unlikely for various reasons: a) as explained in Sect. 2, our observing strategy ensures that persistence spots due to saturated sources do not compromise the photometry; b) we excluded from our analysis the innermost 5″region of the cluster, where there is a high concentration of bright OB stars that are saturated; c) only 3 (see ID 4, ID 8 and ID 9 in Figure 8) out of the 9 sources are located within a few pixels of bright/saturated sources that might have contaminated their photometry, while all the others are not; these 3 objects are marked in Table 5 and in Figure 1 and 5-7. We adopted PSF fitting magnitudes and local background estimates (see Sect. 2), which should minimize photometric contamination even in those 3 cases. However, even in the most conservative case in which we exclude these 3 objects, we remain with 6 clustered objects showing water absorption, a number still hard to explain invoking field contamination, as seen above.
-
4.
Binary systems: The 9 objects could be BDs belonging to NGC 3603 which are detected because they are in binary systems and, hence, more luminous. Because the BD population of NGC 3603 is still not explored, we cannot predict the number of binary BDs in the cluster. However, they are to be expected, because the fraction of BDs comprised in binaries measured in the field is of the order of 15% for a primary mass below 0.1 M⊙ (Lada, 2006; Thies & Kroupa, 2007; Bate, 2009) and appears to be even higher in star forming regions and young clusters of age similar to NGC 3603 (20%; Konopacky et al., 2007, and references therein). Moreover, Burgasser et al. (2008) reported the detection of a field BD, namely 2MASS J09393548 2448279, presenting a highly inflated radius which can be reconciled with BD structure models of the same effective temperature (600-700 K) only assuming that this source is an unresolved, equal-mass binary.
A BD/BD or BD/planet pair would have a luminosity 0.75 mag brighter than a single BD at maximum, e.g. in the case of the two BDs of the pair having the same mass. According to the isochrones by Baraffe et al. (1998), our 9 objects are about 2 mag brighter than what is expected for single BDs belonging to the cluster. This estimate is affected by our photometric uncertainties and also depends on two uncertain parameters: the distance to NGC 3603 and the interstellar extinction along the line of sight. The photometric uncertainties for our 9 objects are of the order of 0.10 mag (see Table 5). The cluster distance is known with an uncertainty of about 1 kpc (Melena et al., 2008), i.e. 0.33 mag in distance modulus, while the uncertainty on visual extinction is 1 mag (see Sect. 3.2), i.e. 0.28 mag. Altogether, these uncertainties might account for an uncertainty on absolute J magnitude of 0.7 mag. Adding this 0.7 mag to the 0.75 mag excess luminosity produced by a BD/BD pair, binary BDs would be at most 1.5 mag brighter than single BDs in the cluster. This difference is still smaller than the 2 mag difference seen in the CMD (Figure 7) between the position of our candidates and the expected position of BDs belonging to the cluster. Thus, the hypothesis of these objects being BD/BD or BD/planet pairs appears unlikely. To justify the observed luminosity, we should assume that they are star/BD pairs with the primary star having a mass between 0.3 and 0.6 M⊙, so that the BD would be responsible for the observed water absorption while the primary star would be responsible for the observed luminosity. However, in this scenario, the luminosity of the primary star in the F139M and F153M filters would suppress the BD contribution to our non-resolved photometry and, hence, we would not be able to detect the presence of water absorption bands.
-
5.
A new class of objects (“Bloatars”): The alternative hypothesis would be that these objects belong to a formerly unrecognized class of young stars with a surface temperature similar to those of BDs, but with a luminosity characteristic of much more massive stars (M⊙). These stars appear to be “bloated”, with radii far in excess of what standard PMS evolutionary theory would predict for objects of the same temperature, and so we will dub them “Bloatars” (bloated stars). All the hints we have collected on these 9 objects on the basis of our data support this hypothesis: their cool temperature, their higher luminosity with respect to field and/or cluster BDs, their clustered spatial distribution, their CMD similar to that of PMS stars in NCG 3603.
In the next sections we explore this possible and interesting scenario in more detail.
5.1 How could “Bloatars” be formed?
The data presented in this paper suggest that we have discovered a new class of PMS stars, designated as “Bloatars”, with a surface temperature similar to those of BDs but with a luminosity characteristic of much more massive stars (0.2-1 M⊙). How could such stars be formed? Essentially, it would require a recent mass accretion event - preferably with added angular momentum. Two scenarios are possible. First, that the system was formed as a very close binary system, and that the secondary has overflowed its Roche Lobe. Second, the Bloatar has recently swallowed an orbiting hot Jupiter planet. In both these scenarios, the merging is driven by tidal interaction, and the debris from the merger forms a common envelope which is optically-thick to the escape of photons from the primary star’s photosphere, thus forming - for a brief period - a “false photosphere” with radius much larger, and temperature much lower, than the primary star. We will now investigate the likely parameters of such tidal mergers, and attempt to determine which scenario gives the most plausible results.
5.1.1 Formation Rates and Timescales
Planetary systems forming hot Jupiters are thought to form in two stages, an initial accretion period lasting a few Myr, with orbital migration driven by dynamical interaction with the protoplanetary disk, followed by a chaotic era lasting as long as 100 Myr in which interactions between the newly formed planets dominate (Jurić & Tremaine, 2008).
The age of the NGC 3603 cluster stars varies from zero up to more than 10 Myr. Beccari et al. (2010) show that the star formation rate has been increasing rapidly over the past few Myr, with the bulk of the stars forming over the past 2-3 Myr. Thus, the age of the cluster stars is comparable to the length of the first phase of evolution of the planetary system. Any planet which is going to merge with its star must have therefore already migrated to an orbit in which continued tidal interaction will cause it to inspiral in a timescale of less than about 1-3 Myr.
The inspiral time is determined by a dimensionless parameter representing the ratio of the binding energy and the increase in binding energy over one orbital period. This is driven primarily by tidal dissipation in the satellite body, but may also be augmented by magnetic braking and spin-orbit alignment (Barker & Ogilvie, 2009). Typically, (Peale, 1999). The inspiral timescale is given by (Dobbs-Dixon et al., 2004; Levrard et al., 2009):
| (4) |
where is the orbital angular frequency, the star has mass and radius , and the planet has mass and is orbiting with semi-major axis . If we want the star to inspiral in Myr, then the hot Jupiter must initially be at a radius of order AU (cm) with an orbital period of the order of a day. Hot Jupiters with such short orbital timescales have indeed been observed, e.g. the eclipsing system WASP-18 (Hellier et al., 2009). If the companion was not a planet, but a star in its own right, the infall timescale from this initial radius would be perhaps a factor of 100 times longer.
The number, , of Bloatars we expect to see is where is the number of stars in the cluster with mean age Myr, is the fraction of stars having hot Jupiters which can inspiral in the lifetime of the cluster, and is the lifetime of the bloated phase, before the accreted envelope once again becomes optically thin to the escape of photons from the true stellar photosphere. According to the most recent estimates, though still uncertain, the value of is expected to be within the range 0.1-0.2 (see, i.e., Cumming et al., 2008), while in NGC 3603 is of the order of (Beccari et al., 2010) and is according to this work. Thus, yr. Bloatars must be short-lived, and therefore comparatively rare objects.
| mp (M⊙) | 0.001 | 0.01 | 0.001 | 0.0005 | ||
|---|---|---|---|---|---|---|
| rp (R⊙) | 0.14 | 0.14 | 0.25 | 0.14 | ||
| M⋆ (M⊙) | T⋆ (K) | Teff (K) | ||||
| 1.00 | 5920 | 3326 | 4755 | 2489 | 2977 | |
| 0.93 | 5610 | 3075 | 4393 | 2301 | 2752 | |
| 0.78 | 5150 | 2775 | 3958 | 2076 | 2485 | |
| 0.69 | 4640 | 2378 | 3388 | 1780 | 2130 | |
| 0.47 | 3920 | 1970 | 2794 | 1474 | 1765 | |
| 0.21 | 3120 | 1266 | 1775 | 948 | 1137 |
5.1.2 Orbital parameters & Surface temperatures
An inspiralling planet or companion star will start to be tidally disrupted when it comes to fill its Roche lobe. According to Paczyński (1971), for mass ratios in the range this will occur when the radius of the companion, , exceeds a critical radius, , given by:
| (5) |
We assume that the tidally stripped debris from the companion form a fast-rotating common envelope with a radius . The stripped debris form a ”false photosphere” to the star; if the tidal debris are optically thick, the effective radius of the parent star is and therefore the effective temperature of the ”false photosphere” is given by:
| (6) |
Presumably, the effective temperature would be higher if viewed from the polar direction, because the common envelope would be ellipsoidal in shape. If the companion is a lower mass star, then nuclear burning is not likely to be immediately extinguished, and the effective temperature is somewhat higher than that given by equation 6, owing to the additional luminosity of the companion star circulating within the common envelope.
Equations 5 and 6 provide the basis for determining the most likely formation scenario for these Bloatars. Table 7 summarizes the computed effective temperature of the bloated photosphere for different combinations of mass/temperature of the primary star and mass/orbital radius of the companion planet and shows that a companion hot Jupiter provides a much more likely match to the observations.
Indeed, if the companion is a star in its own right, the break-up radius is smaller than if it was a hot Jupiter. For a companion of mass of 0.21 M⊙ orbiting around a primary star of M⊙, we get and K. At the other extreme, for a companion of mass of 0.66 M⊙ orbiting around a primary star of M⊙, we get and K. These temperatures are too high to explain the observations. This fact coupled with the long inspiral timescale of such massive companions makes it most unlikely that the Bloatars are simply common-envelope binaries.
Even a planet like WASP-18 ( M⊙; ) would likewise provide too high an effective temperature in the common envelope. In the stellar mass range M⊙ the computed common envelope effective temperature lies in the range K.
For a standard “hot Jupiter” ( M⊙; ) the computed common envelope effective temperature lies in the range K over the stellar mass range M⊙. However, the tidal heating of the companion planet is likely to bloat the planet up to larger radius, causing it to fill its Roche Lobe earlier and at greater radius from the primary star (Leconte et al., 2010). If the radius of the planet is increased to , then the computed common envelope effective temperature lies in the range K over the stellar mass range M⊙. This nicely brackets the range of parameters we derive for our nine stars ( M⊙ and K).
Finally we ask: is the envelope formed sufficiently dense to form a “false photosphere” to the central star? If we adopt the bloated hot Jupiter parameters of the previous paragraph, then the common envelope will have a local density in the range gm cm-3 and a column density gm cm-2. Thus, although the atmosphere formed is tenuous, it has more than enough of a column density to be extremely optically thick to the escape of radiation.
5.2 Why have “Bloatars” escaped detection so far?
The idea of stars “swallowing planets” is not new in the literature. For example, Siess & Livio (1999a) presented simulations of the accretion of massive planets or brown dwarfs by asymptotic giant branch stars. In Siess & Livio (1999b) they also extended this concept to solar-mass stars on the red giant branch. Moreover, a few giant and dwarf stars have been suggested to undergo atmospheric expansion and swallowing of relatively massive planets in close orbits (see, e.g., Israelian et al., 2001; Retter & Marom, 2003; Li et al., 2010; Fossati et al., 2010).
On the other hand, all these detections involve stellar systems in later evolutionary phases than our 9 Bloatar candidates, which are only a few Myr old. Thus, a very important issue we need to address is why Bloatars have not been detected so far in the many photometric and spectroscopic surveys of young clusters that are much closer than NGC 3603, i.e. in the solar neighborhood (d1-2 kpc).
The probability of detecting a Bloatar is expected to be very small. As we saw in Sect. 5.1, the “bloated” phase would occur at ages comparable with the first phase of evolution of the planetary system (1-3 Myrs) and is expected to last only for about yr. In NGC 3603, whose rich PMS population and youth provide the circumstances most favorable for the detection of Bloatars, they would represent just 1% of the 1 Myrs old PMS population.
These considerations imply that Bloatars could have been found only in nearby star forming regions or clusters younger than a few Myrs. The probability of detecting a Bloatar in this restricted sample is much smaller than in a massive cluster like NGC 3603 for several reasons:
-
•
Nearby 1-3 Myrs old star forming regions and clusters have a typical number of confirmed PMS stars of the order of 102 rather than 103 (Reipurth, 2008a, b). Thus, if we assume that Bloatars represent just 1% of the PMS population, only a few of them (4) are expected to be present in this kind of regions.
-
•
The spatial extent of nearby star forming regions, like Orion, Serpens, Lupus is of the order of a few square degrees or more (Reipurth, 2008a, b) and even more compact young open clusters, like IC 348, typically extend for more than 0.5 deg2 (Muench et al., 2007). Thus, spectroscopic surveys of the PMS population in these regions are often spatially incomplete and might have easily missed the few Bloatars expected to be present.
-
•
Photometric surveys for PMS stars and BDs are nowadays spatially complete. However, as we have seen in Sect. 4, broad-band colors of Bloatars are similar to those of 0.2-1 M⊙ PMS stars. Thus, Bloatars might have been confused with more ordinary PMS stars in such surveys. Only a handful of regions have been surveyed combining the use of broad and narrow-band photometry in H2O or CH4 lines (see, e.g., Najita et al., 2000; Gorlova, 2003; Mainzer et al., 2004; Andersen et al., 2006).
6 Conclusions
We have presented the results of a pioneering narrow-band WFC3/IR survey of NGC 3603 with the aim of discovering objects displaying deep water-vapor absorption bands, characteristic of Brown Dwarfs. The main results of our study are as follows:
-
•
We have developed a method to identify BD candidates on the basis of WFC3/IR narrow-band imaging in water molecular bands. This photometric method provides effective temperatures for BDs to an accuracy of K relative to spectroscopic techniques. This accuracy is not significantly affected by either stellar surface gravity or uncertainties in the interstellar extinction;
-
•
The comparison of this calibration relation with expectations from models of stellar/sub-stellar photospheres supports a scenario where both dust gravitational settling and scattering/absorption operate in the atmosphere of very cool objects;
-
•
Using this technique, we identify 9 objects having the colors of BDs, strongly clustered towards the luminous core of NGC 3603 but far too luminous to be normal BD members of this cluster. We argue that it is unlikely that these objects are either artifacts of our dataset, normal field BDs/M-type giants or extra-galactic contaminants and, hence, we might have discovered a new class of bloated objects having the effective temperatures of BDs (“Bloatars”);
-
•
We explore the interesting scenario in which these Bloatars would be young stars that have recently tidally ingested a Hot Jupiter, the remnants of which is providing a short-lived extended photosphere to the central star. We predict that, if this scenario is correct, these stars would show the signature of fast rotation, with the equatorial part of the “Bloatar” rotating at the orbital velocity of the absorbed planet.
References
- Aaronson et al. (1978) Aaronson, M., Persson, S. E., & Frogel, J. A., 1978, ApJ, 220, 442
- Allard et al. (2001) Allard, F., Hauschildt, P.H., Alexander, D.R., et al. 2001, ApJ, 556, 357
- Andersen (2005) Andersen, M., Ph.D. thesis, 2005, Potsdam University
- Andersen et al. (2006) Andersen, M., Meyer, M.R., Oppenheimer, B., Dougados, C., & Carpenter, J. 2006, AJ, 132, 2296
- Baraffe et al. (1998) Baraffe, I., Chabrier, G., Allard, F., Hauschildt, P.H.,1998, A&A, 337, 403
- Barker & Ogilvie (2009) Barker, J. J., & Ogilvie, G. I., 2009, MNRAS, 395, 2268
- Basri et al. (2000) Basri, G., Mohanty, S., Allard, F., et al. 2000, ApJ, 538, 363
- Bate (2009) Bate, M. R. 2009, MNRAS, 392, 590
- Beccari et al. (2010) Beccari, G., Spezzi, L., De Marchi, G., et al. 2010, ApJ, 720, 1108
- Braatz et al. (2003) Braatz, J. A., Wilson, A. S., Henkel, C., Gough, R., & Sinclair, M. 2003, ApJS, 146, 249
- Brandl et al. (1999) Brandl, B., Brandner, W., Eisenhauer, F., Moffat, A. F. J., Palla, F., & Zinnecker, H., 1999, A&A, 352, L69
- Burgasser et al. (2008) Burgasser, A. J., Tinney, C. G., Cushing, M. C., Saumon, D., Marley, M. S., Bennett, C. S., & Kirkpatrick, J. D. 2008, ApJ, 689, L53
- Cardelli et al. (1989) Cardelli, J. A., Clayton, G. C., & Mathis, J. S., 1989, ApJ, 345, 245
- Chabrier et al. (2000) Chabrier, G., Baraffe, I., Allard, F., & Hauschildt, P., 2000, ApJ, 542, 464
- Cristóbal-Hornillos et al. (2009) Cristóbal-Hornillos, D., et al. 2009, ApJ, 696, 1554
- Cruz et al. (2007) Cruz, K. L., Reid, I.N., Kirkpatrick, J.D., et al. 2007, AJ, 133, 439
- Cumming et al. (2008) Cumming, A., Butler, R.P., Marcy, G.W, et al. 2008, PASP, 120, 531
- D’Antona (1999) D’Antona, F., Oliva, E. & Zeppieri, A., 1999, A&A, 352, 567
- De Marchi et al. (2010) De Marchi, G., Panagia, N., & Romaniello, M. 2010, ApJ, 715, 1
- Dobbs-Dixon et al. (2004) Dobbs-Dixon, I., Lin, D. N. C., & Mardling, R. A., 2004, ApJ, 610, 464
- Dressel et al. (2010) Dressel, L., Wong, M.H., Pavlovsky, C., and Long, K. et al., 2010. “Wide Field Camera 3 Instrument Handbook, Version 2.1” (Baltimore: STScI)
- Elias et al. (1985) Elias, J. H., Frogel, J. A., & Humphreys, R. M. 1985, ApJS, 57, 91
- Folha & Emerson (2001) Folha D.F.M., & Emerson, J.P. 2001, A&A, 365, 90
- Fossati et al. (2010) Fossati, L., et al. 2010, ApJ, 714, L222
- Geballe et al. (2002) Geballe, T.R., Knapp, G.R., Leggett, S.K., et al. 2002, ApJ, 564, 466
- Gorlova (2003) Gorlova, N.I., Meyer, M.R., Rieke, G.H., & Liebert, J., 2003, ApJ, 593, 1074
- Gunn & Stryker (1983) Gunn, J.E., & Stryker, L.L. 1983, ApJS, 52, 121
- Gould et al. (2009) Gould, A., Udalski, A., Monard, B.,et al. 2009, ApJ, 698, L147
- Harayama et al. (2008) Harayama, Y., Eisenhauer, F., & Martins, F. 2008, ApJ, 675, 1319
- Hauschildt et al. (1999) Hauschildt, P.H., Allard, F., & Baron, E., 1999, ApJ, 512, 377
- Hellier et al. (2009) Hellier, C., Anderson, D. R., Cameron, A. Collier, et al. 2009, Nature 460, 1098
- Israelian et al. (2001) Israelian, G., Santos, N. C., Mayor, M., & Rebolo, R. 2001, Nature, 411, 163
- Jayawardhana et al. (2003) Jayawardhana, R., Mohanty, S., Basri, G., Ardila, D. R., Stelzer, B., & Haisch, K. E., Jr. 2003, Open Issues in Local Star Formation, 299, 251
- Joergens (2005) Joergens, V., 2005, Reviews in Modern Astronomy, 18, 216
- Jurić & Tremaine (2008) Juri c, M. & Tremaine, S., 2008, ApJ, 686, 603
- Kalirai et al. (2009) Kalirai, J.S., et al. 2009, Instrument Science Report WFC3 2009-30, 20 pages, 30
- Kennicutt (1998) Kennicutt, R.C., 1998, Ann. Rev. A&A, 36, 189
- Kenyon & Hartmann (1995) Kenyon, S. J., & Hartmann, L. 1995, ApJS, 101, 117
- Kirkpatrick et al. (1999) Kirkpatrick, J.D., Reid, I.N., Liebert, J., et al. 1999, ApJ, 519, 802
- Kirkpatrick et al. (2005) Kirkpatrick, J.D., 2005, Annual Reviews of A&A, 43, 195
- Konopacky et al. (2007) Konopacky, Q. M., Ghez, A. M., Rice, E. L., & Duchêne, G. 2007, ApJ, 663, 394
- Kozhurina-Platais et al. (2009) Kozhurina-Platais, V., Cox, C., McLean, B., et al. 2009, Instrument Science Report WFC3 2009-34, 16 pages, 34
- Lada (2006) Lada, C. J. 2006, ApJ, 640, L63
- Lebouteiller et al. (2008) Lebouteiller, V., Bernard-Salas, J., Brandl, B., et al. 2008, ApJ, 680, 398
- Lebzelter et al. (2010) Lebzelter, T., Nowotny, W., Höfner, S., Lederer, M. T., Hinkle, K. H., & Aringer, B. 2010, A&A, 517, A6
- Leconte et al. (2010) Leconte, L., Chabrier, G., Baraffe, I & Levard, B., 2010, A&A, 516, 64
- Leggett et al. (2010) Leggett, S.K., Burningham, B., Saumon, D., et al. 2010, ApJ, 710, 1627
- Levrard et al. (2009) Levrard, B. Winisdoerffer, C. & Chabrier, G., 2009, ApJ692, L9-13
- Li et al. (2010) Li, S.-L., Miller, N., Lin, D. N. C., & Fortney, J. J. 2010, Nature, 463, 1054
- Luhman et al. (2003) Luhman, K.L., Stauffer, J.R., Muench, A.A., et al. 2003, ApJ, 593, 1093
- Mainzer et al. (2004) Mainzer, A.K., McLean, I.S, Sievers, J.L. & Young, E.T. 2004, ApJ, 604, 832
- Marigo et al. (2008) Marigo, P., Girardi, L., Bressan, A., et al. 2008, A&A, 482, 883
- Martin et al. (1999) Martin, E.L., Delfosee, X., Basri, G., et al. 1999, AJ, 118, 24661
- McLean et al. (2003) McLean, I.S., McGovern, M.R., Burgasser, A.J., et al. 2003, ApJ, 596, 561
- Melena et al. (2008) Melena, N. W., Massey, P., Morrell, N. I., & Zangari, A. M. 2008, AJ, 135, 878
- Moffat et al. (2004) Moffat, A.F.J., Poitras, V., Marchenko, S.V., et al. 2004, AJ, 128, 2854
- Muench et al. (2007) Muench, A. A., Lada, C. J., Luhman, K. L., Muzerolle, J., & Young, E. 2007, AJ, 134, 411
- Najita et al. (2000) Najita, J.R., Tiede, G.P., & Carr, J.S., 2000, ApJ, 54, 977
- Paczyński (1971) Paczyński, B., 1971, Ann. Rev. A&A, 9, 183
- Peale (1999) Peale, S. J., 1999, ARA&A, 37, 533
- Peimbert et al. (2007) Peimbert, M., Peimbert, A., Esteban, C., et al. 2007, Revista Mexicana de Astronomia y Astrofisica Conference Series, 29, 7
- Reid et al. (2001) Reid, I.N., Burgasser, A.J., Cruz, K.L., et al. 2001, AJ, 121, 1710
- Reipurth (2008a) Reipurth, B. 2008, Handbook of Star Forming Regions, Volume I
- Reipurth (2008b) Reipurth, B. 2008, Handbook of Star Forming Regions, Volume II
- Retter & Marom (2003) Retter, A., & Marom, A. 2003, MNRAS, 345, L25
- Robin et al. (2003) Robin, A. C., Reylé, C., Derriére, S., et al. 2003, A&A, 409, 523
- Rochau et al. (2010) Rochau, B., Brandner, W., Stolte, A., Gennaro, M., Gouliermis, D., Da Rio, N., Dzyurkevich, N., & Henning, T. 2010, ApJ, 716, L90
- Ryan et al. (2005) Ryan, R. E., Jr., Hathi, N. P., Cohen, S. H., & Windhorst, R. A., 2005, ApJ, 631, L159
- Schmidt et al. (2010) Schmidt, S. J., West, A. A., Hawley, S. L., & Pineda, J. S. 2010, AJ, 139, 1808
- Schweitzer et al. (2001) Schweitzer, A., Gizis, J.E., Hauschildt, P.H., et al. 2001, ApJ, 555, 368
- Schweitzer et al. (2002) Schweitzer, A., Gizis, J.E., Hauschildt, P.H., et al. 2002, ApJ, 566, 435
- Siess & Livio (1999a) Siess, L., & Livio, M. 1999, MNRAS, 304, 925
- Siess & Livio (1999b) Siess, L., & Livio, M. 1999, MNRAS, 308, 1133
- Siess et al. (2000) Siess, L., Dufour, E., & Forestini, M., 2000, A&A, 358, 593
- Smartt et al. (2002) Smartt, S. J., Lennon, D. J., Kudritzki, R. P., Rosales, F., Ryans, R. S. I., & Wright, N. 2002, A&A, 391, 979
- Stetson (1987) Stetson, P.B. 1987, PASP, 99, 191
- Stetson (1994) Stetson, P.B. 1994, PASP, 106, 250
- Strecker et al. (1979) Strecker, D.W., Erickson, E.F., & Whittenborn, F.C. 1979, ApJS, 41, 501
- Sung & Bessel (2004) Sung, H., & Bessell, M.S., 2004, AJ, 127, 1014
- Testi (2009) Testi, L., 2009, A&A, 503, 639
- Thies & Kroupa (2007) Thies, I., & Kroupa, P. 2007, ApJ, 671, 767
- Thompson (1998) Thompson, R.I., 1998, ASP Conference Series, Vol. 133, pag. 34
- Tinney (1999) Tinney, C. G., 1999, “The Third Stromlo Symposium: The Galactic Halo”, 165, 419
- Tsuji (2000) Tsuji, T., 2000, ApJ, 538, 801
- Vrba et al. (2004) Vrba, F.J., 1, Henden, A.A., Luginbuhl, C.B., et al., 2004, AJ, 127, 2948
- Wildey (1963) Wildey, R. L. 1963, AJ, 68, 190
- White & Basri (2003) White, R.J., & Basri, G., 2003, ApJ, 582, 1109 bf
- Whitworth et al. (2007) Whitworth, A., Bate, M. R., Nordlund, Å., Reipurth, B., & Zinnecker, H. 2007, Protostars and Planets V, 459
- Yan et al. (2008) Yan, H., Hathi, N. P., & Windhorst, R. A. 2008, ApJ, 675, 136