Phase separation and dynamical arrest for particles interacting with mixed potentials the case of globular proteins revisited
Abstract
We examine the applicability of the extended law of corresponding states (ELCS) to equilibrium and non equilibrium features of the state diagram of the globular protein lysozyme. We provide compelling evidence that the ELCS correctly reproduces the location of the binodal for different ionic strengths, but fails in describing the location of the arrest line. We subsequently use Mode Coupling Theory (MCT) to gain additional insight into the origin of these observations. We demonstrate that while the critical point and the connected binodal and spinodal are governed by the integral features of the interaction potential described by the normalized second virial coefficient, the arrest line is mainly determined by the attractive well depth or bond strength. This article is published in Soft Matter. The reference is: DOI: 10.1039/c0sm01175d
I Introduction
Gel formation in colloidal suspensions has continued to attract considerable attention during the last few years. Particular attention has been given to particles interacting via a short-ranged attractive potential, and the role of the key parameters volume fraction , interparticle interaction strength Ua and range of the potential D in determining the state diagram has been addressed [1,2]. Depending upon the strength of the attraction, they can form amorphous solids from arbitrarily low volume fraction, , up to random close packing.1 At intermediate values of and , one encounters an intriguing interplay between spinodal decomposition and gelation that results in the phenomenon of an arrested spinodal decomposition and the formation of a solid-like network [2 6]. While there are a number of experimental studies that report on the phenomena, there are relatively few quantitative results on the actual location of the arrest line in the vicinity of the binodal and spinodal. In a recent study Lu et al.6 provided for example evidence that gelation for short range attractive particles indeed occurs as a consequence of an initial equilibrium liquid liquid phase separation. The authors claimed that all phase separating samples gelled, i.e., that the gel line coincided with the binodal in the Baxter sticky sphere model, and that the concentration of the resulting colloidal gels would always be around 0.55. This was interpreted as a result of the gel line intersecting the phase separation boundary at 0.55, with the dense phase undergoing an attractive glass transition after phase separation.
Moreover, these authors also suggested the existence of a universal state diagram when using the second virial coefficient , normalized to the second virial coefficient of hard spheres with the same diameter , as an effective temperature . It had in fact already previously been suggested that the so-called extended law of corresponding states (ELCS) [7] should not only allow for a rescaling of thermodynamic properties, but that it should also hold for dynamic properties such as gel or glass lines that describe the occurrence of dynamical arrest [2,8].
Another example, where a state diagram that combines liquid liquid phase separation and dynamical arrest has been reported, was based on the use of globular proteins as model colloids [4,9]. Direct analogies between colloids interacting via a short range attractive potential and globular proteins have been used in the past quite successfully to understand the phase behavior of globular proteins and to rationalize some of the phenomenological observations made during protein crystallization [1014]. In particular lysozyme has been extensively investigated in view of the potential but also limits of such a coarse-grained colloid approach to protein solutions [11,13,15,16].
While the existence of dynamical arrest in protein solutions has in fact already been reported previously, [13] it is only recently that we have been able to locate the glass line in the region below the coexistence curve for the globular protein lysozyme [4]. These findings are summarized in the lysozyme state diagram in Fig. 1, where the temperature is plotted as a function of the protein volume fraction . A lysozyme solution above the coexistence curve quenched down to temperatures within region I undergoes complete macroscopic phase separation after some time [4]. However, deeper quenches into region II lead to the formation of a gel due to the interplay between phase separation and dynamical arrest [4,9].
Arrest is thought to occur during the early stage of spinodal decomposition when the volume fraction of the dense phase intersects the dynamical arrest threshold given by the arrest line, which extends deep into the unstable region (right triangles in Fig. 1). At this point the dense phase forms an attractive glass and arrests, and phase separation thus gets pinned into a space spanning gel network with a characteristic length [4]. Additional support for this scenario was subsequently obtained through investigations combining video microscopy and ultra small-angle light scattering experiments [9]. Moreover, this interpretation is also in agreement with the work of Dumetz et al.,[16] who looked at the phase behavior of several globular proteins and noted the existence of an arrested state.

If the invariance of the state diagram for colloids with short range attractions in the frame of a Noro-Frenkel ELCS would also hold for non-equilibrium properties such as gel and glass formation as proposed by a number of authors, [6,8,17] this could serve as an ideal basis for comparing various systems and generating a generic phase diagram as a function of a single control parameter . However, while there exist simulations that have addressed this problem, [8] there are to our knowledge no systematic experimental investigations available that have tested the applicability of the ELCS to glass or gel formation for colloidal suspensions. Moreover, while most theoretical, simulation and experimental studies have concentrated on purely attractive systems, any attempt to extend this approach to protein solutions and many colloidal systems of practical importance will have to consider the effects of amixed potential that also includes a soft repulsion due to residual charges.While it has already been observed that the location of the binodal changes with ionic strength in a way that is at least qualitatively in agreement with the ELCS, [10] no information on the arrest line in the vicinity of the binodal has been reported so far, despite the fact that this is for example an essential ingredient of the zone picture for protein crystallization. We have thus started a systematic characterization of the binodal and the arrest line under conditions where we increase the contributions from the screened Coulomb repulsion. We in particular concentrate on the question whether the resulting liquid gas coexistence curves and the arrest lines can be superimposed by using as a scaling parameter also if the electrostatic repulsion becomes more prominent and longer ranged.
II Material and Methods
We used the globular protein hen egg white lysozyme (Fluka, L7651) in 20mM HEPES buffer at pH = 7.8, where lysozyme carries a net charge of +8e.18 We varied the electrostatic repulsion created by the residual charges of lysozyme at pH=7.8 by adding different amounts of NaCl. Details about the sample preparation are given elsewhere [4]. The buffers used in this study contain 200, 300, 400, and 500mM NaCl. Taking into account the counter-ions from the proteins, this corresponds to a decrease of the Debye length from about 19% of the lysozyme diameter for 200mM to about 12% for 500mM NaCl for a lysozyme solution at 20 mg mL-1.19 For the determination of the state diagrams at different ionic strengths we again used a combination of visual observation, optical microscopy, static light scattering, rheology and centrifugation as described in ref. 4. The volume fraction of lysozyme f was calculated from the protein concentrations c as measured by UV absorption spectroscopy using , where g cm3 is the protein density.
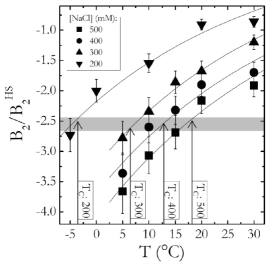
The second virial coefficient for lysozyme solutions was measured using static light scattering experiments on concentration series of dilute solutions of lysozyme. The light scattering experiments were performed with a commercial goniometer system (ALV/DLS/SLS-5000F mono-mode fiber compact goniometer system with ALV-5000 fast correlator) at a wavelength of 514.5nm and a fixed scattering angle of 90o, leading to a scattering vector = 0,022 nm. Figure 2 summarizes the results from our determination of the second virial coefficient B2 as a function of temperature for four different values of the ionic strength. Here we used the relation , where is the contrast term, is the concentration, is the molecular weight, and is the Avogadro s number, to determine from the measured Rayleigh ratios . Plotted in Fig. 2 are the values of the second virial coefficients obtained and normalized by their value for hard sphere, . Also shown are the values of the critical temperature for the different salt concentrations. It is interesting to note that for all salt concentrations investigated, the values at are
III Results
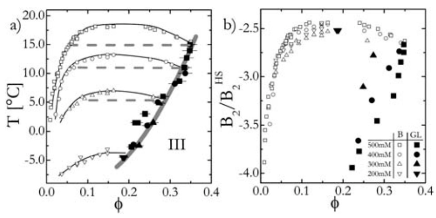
We first determined the location of the coexistence curves as a function of salt concentration. The resulting binodals are shown in Fig. 3A.We find that the critical volume fraction is salt independent and consistent with values from literature [10,20]. The critical temperature , however, increases with increasing salt concentration, reflecting the fact that the attractive part of the interaction potential which drives phase separation becomes more dominant as the electrostatic repulsion becomes increasingly screened.
It has already been demonstrated in various studies of liquid gas coexistence and crystallization in protein solutions that the ionic strength dependence of the location of the liquid solid and liquid liquid phase boundaries can be rationalized at least qualitatively using an integral quantity of the strength of the interaction potential as given by [11,13,16,2125]. We have thus also determined the second virial coefficient as a function of temperature for all ionic strengths with static light scattering (see ESI for additional information).We found that the normalized at is , identical within experimental errors irrespective of ionic strength, in qualitative agreement with the idea that equilibrium properties are dictated by integral features of the interaction potential.We can in fact rescale the corresponding phase boundaries for all values of the ionic strength using as an effective temperature as shown in Fig. 3B. This provides us with a direct verification of the applicability of the ELCS for lysozyme as a model for particles interacting via amixed potential.
In a next step we now focus on the dynamical arrest line as a function of ionic strength and temperature. We determined their location by a combination of rheology, microscopy and centrifugation experiments as described in detail in ref. 4. The results are also summarized in Fig. 4. In contrast to the strongly salt-dependent coexistence curves, the location of the dynamical arrest line seems to be independent of ionic strength, and all the arrest lines at different ionic strengths overlap within the experimental error bars. This holds not only for the points within the unstable region that were determined by a combination of a rapid temperature quench and subsequent centrifugation, but also for the intersection with the binodal (point A in Fig. 1) determined independently by rheology and microscopy.
These experimental observations thus lead to the following scenario: the coexistence curves are not sensitive to the details of the interaction potential and can be rescaled using an integral quantity the second virial coefficient that characterizes the overall potential. However, this drastically changes when it comes to dynamical arrest. Here it appears that the short-range part of the potential, i.e. the temperature-dependent attractive well, determines its location.
We next turn to the idealized mode coupling theory (MCT) [27] in an attempt to gain some qualitative insight into the trends observed experimentally. MCT requires the static structure factor as input, which we obtain from Percus Yevick (PY) theory [28] applied to an interaction potential of double Yukawa form, for separation distances and complemented by a hard core for . Here we chose to use a simple mixed potential that would allow us to capture the general trends upon a variation of the ionic strengths. The parameters of the screened Coulomb part of the interaction, and , have been calculated from the experimental parameters using the linear superposition principle of the linearized Poisson Boltzmann equation. Their (weak) temperature dependence has been neglected. In addition, and , so that the first term in the interaction potential models a short-range attraction and the contact value provides a suitable temperature , viz. , for a qualitative comparison with the experimental data of Fig. 3. However, we refrain from attempting to model the nonequilibrium transitions quantitatively because of the limitations of MCT for very short-range attractions.8
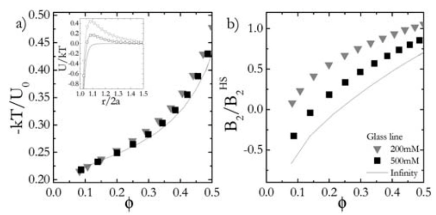
Fig. 4A shows the arrest line observed within MCT as a function of added monovalent salt. At the higher volume fractions increasing the ionic strength has the effect of shifting the glass transitions to higher , in agreement with ref. 26. However, at sufficiently low temperatures and particle concentrations the glass lines merge and become essentially independent of the ionic strength. In this region the location of the glassy arrest transition produced by the theory is found to be governed by the contact value of the interaction potential. Indeed, at comparable f the location of the glass line is unaffected by changes in the ionic strength (see Fig. 4A). MCT thus captures the experimentally observed trends. This is further demonstrated in Fig. 4B, where the theoretical predictions are scaled by . Whereas PY calculations for the spinodals reveal that they superpose reasonably well under these conditions (data not shown), the glass lines from the theory do not scale with , confirming that under the prevailing conditions it is the well depth or bond strength , rather than , that governs the structural arrest.
We are thus left with the discrepancy between the results from ref. 8, where evidence was presented that the ELCS would also be valid for dynamical arrest, and our own findings. However, it is important to point out that the simulations performed in ref. 8 were performed for purely attractive potentials of very short range .On the other hand, lysozyme possesses a mixed potential, and has been modeled with a range for the attraction of approximately , depending upon whether an isotropic potential or a patchy description has been used [15]. It is clear thatMCT provides qualitative agreement between experiment and theory only. However, despite its shortcomings,MCT should be able to reproduce dynamical arrest for particles interacting via a not too short-ranged potential reasonably well, [29] and indeed captures the trends observed (Fig. 3 and 4).
IV Conclusion
Additional simulations and experiments with colloidal model systems under comparable conditions (mixed potential, not too short-ranged attraction) are thus needed before we can generalize our findings. However, we believe that our results are of considerable importance for current attempts to link proteins and colloids. A coarse-grained approach to the phase behavior of globular proteins based on a close analogy between colloids and proteins has frequently been used to gain insight into phenomena such as protein crystallization or protein condensation diseases [10,13,14,30]. The assumption of a generalized state diagram has for example been used to develop new strategies in protein crystallization. However, our study clearly demonstrates that there may be no sound basis for such a generic state diagram for globular proteins that incorporates both equilibrium as well as non-equilibrium features.
We may also speculate about the importance of our findings for the colloid community. For colloids with mixed interaction potentials we may observe a significant shift of the arrest line with respect to the binodal at different ionic strengths. For weakly screened electrostatic repulsion this could result in a shift of the binodal below the arrest line and thus open up a direct path to gelation that does not compete with a simultaneous spinodal decomposition. This is a scenario that has been discussed previously in attempts to generalize our current understanding of gelation and glass formation, but no convincing experimental evidence has been provided so far.2Given the enormous structural and mechanical differences found in colloidal gels and glasses that have formed via different routes, this opens up new avenues towards the formation of solid-like complex fluids that may be extremely interesting for applications in materials or food science [31].
This work was supported by the Swiss National Science Foundation, the State Secretariat for Education and Research (SER) of Switzerland, the Marie Curie Network on Dynamical Arrest of Soft Matter and Colloids (MRTN-CT-2003-504712), and the EU NoE SoftComp NMP3-CT-2004-502235. We also acknowledge support from the Adolphe Merkle Foundation.
V Bibliography
-
1.
V. Trappe and P. Sandkuhler, Curr. Opin. Colloid Interface Sci., 2005, 18, 494 500.
-
2.
E. Zaccarelli, J. Phys.: Condens. Matter, 2007, 19, 323101.
-
3.
N. A. M. Verhaegh, D. Asnaghi, H. N. W. Lekkerkerker, M. Giglio and L. Cipelletti, Phys. A, 1997, 242, 104 118.
-
4.
F. Cardinaux, T. Gibaud, A. Stradner and P. Schurtenberger, Phys. Rev. Lett., 2007, 99, 118301.
-
5.
S. Buzzaccaro, R. Rusconi and R. Piazza, Phys. Rev. Lett., 2007, 99, 098301.
-
6.
P. Lu, E. Zaccarelli, F. Ciulla, A. B. Schofield, F. Sciortino and D. A. Weitz, Nature, 2008, 453, 499 503.
-
7.
M. G. Noro and D. Frenkel, J. Chem. Phys., 2000, 113, 2941 2944.
-
8.
G. Foffi, C. de Michele, F. Sciortino and P. Tartaglia, Phys. Rev. Lett., 2005, 94, 078301.
-
9.
T. Gibaud and P. Schurtenberger, J. Phys.: Condens. Matter, 2009, 21, 322201.
-
10.
M. Muschol and F. Rosenberger, J. Chem. Phys., 1997, 107, 1953.
-
11.
R. Piazza, V. Peyre and V. Degiorgio, Phys. Rev. E: Stat. Phys., Plasmas, Fluids, Relat. Interdiscip. Top., 1998, 58, R2733.
-
12.
R. Piazza, Curr. Opin. Colloid Interface Sci., 2000, 5, 38.
-
13.
A. Kulkarni, N. M. Dixit and C. F. Zukoski, Faraday Discuss., 2003, 123, 37.
-
14.
G. Foffi, K. A. Dawson, S. V. Buldyrev, F. Sciortino, E. Zaccarelli and P. Tartaglia, Phys. Rev. E: Stat. Phys., Plasmas, Fluids, Relat. Interdiscip. Top., 2002, 65, 050802.
-
15.
C. Gogelein, G. Nagele, R. Tuinier, T. Gibaud, A. Stradner and P. Schurtenberger, J. Chem. Phys., 2008, 129, 085102.
-
16.
A. Dumetz, A. M. Chockla, E. W. Kaler and A. M. Lenhoff, Biophys. J., 2008, 94, 570.
-
17.
E. Zaccarelli, P. J. Lu, F. Ciulla, D. A. Weitz and F. Sciortino, J. Phys.: Condens. Matter, 2008, 20, 494242.
-
18.
C. Tanford and R. Roxby, Biochemistry, 1972, 11, 2192.
-
19.
L. Belloni, J. Chem. Phys., 1986, 85, 519 526.
-
20.
V. G. Taratuta, A. Holschbach, G. M. Thurston, D. Blankschtein and G. B. Benedek, J. Phys. Chem., 1990, 94, 2140 2144.
-
21.
A. George and W. W. Wilson, Acta Cryst., 1994, 50, 361 365.
-
22.
D. F. Rosenbaum and C. F. Zukoski, J. Cryst. Growth, 1996, 169, 752.
-
23.
M. L. Broide, T. M. Tominc and M. D. Saxowsky, Phys. Rev. E: Stat. Phys., Plasmas, Fluids, Relat. Interdiscip. Top., 1996, 53, 6325.
-
24.
D. F. Rosenbaum, A. Kulkarni, S. Ramakrishnan and C. F. Zukoski, J. Chem. Phys., 1999, 111, 9882.
-
25.
H. Sedgwick, J. E. Cameron, W. C. K. Poon and S. U. Egelhaaf, J. Chem. Phys., 2007, 127, 125102.
-
26.
J. Wu, Y. Liu, W.-R. Chen, J. Cao and S.-H. Chen, Phys. Rev. E: Stat., Nonlinear,Soft Matter Phys., 2004, 70, 050401.
-
27.
W. Gotze and L. Sjogren, Rep. Prog. Phys., 1992, 55, 241.
-
28.
B. D Aguanno and R. Klein, Static scattering properties of colloidal suspensions, Clarendon Press, Oxford, 1996.
-
29.
B. Ahlstr om and J. Bergenholtz, J. Phys.: Condens. Matter, 2007, 19, 036102.
-
30.
A. Stradner, G. Foffi, N. Dorsaz, G. Thurston and P. Schurtenberger, Phys. Rev. Lett., 2007, 99, 198103.
-
31.
R. Mezzenga, P. Schurtenberger, A. Burdige and M. Michel, Nat. Mater., 2005, 4, 729.