The Fundamental Plane of Gamma-ray Globular Clusters
Abstract
We have investigated the properties of a group of -ray emitting globular clusters (GCs) which have recently been uncovered in our Galaxy. By correlating the observed -ray luminosities with various cluster properties, we probe the origin of the high energy photons from these GCs. We report is positively correlated with the encounter rate and the metalicity which place an intimate link between the gamma-ray emission and the millisecond pulsar population. We also find a tendency that increase with the energy densities of the soft photon at the cluster location. Furthermore, the two-dimensional regression analysis suggests that , soft photon densities, and / possibly span fundamental planes which potentially provide better predictions for the -ray properties of GCs.
1 INTRODUCTION
Millisecond pulsars (MSPs) are generally believed as the descenders of the low-mass X-ray binaries (LMXBs) (Alpar et al. 1982). As the formation rate per unit mass of LMXBs is orders of magnitude greater in globular clusters (GCs) than in the Galactic field (Katz 1975; Clark 1975), it is not surprise that of the detected MSPs are located in GCs111see also http://www.naic.edu/pfreire/GCpsr.html (cf. Manchester et al. 2005). The relatively high formation rate of LMXBs and MSPs is a natural consequence of the frequent stellar encounters. With the X-ray populations in various GCs have been revealed by the Chandra X-Ray Observatory, Pooley et al. (2003) and Gendre et al. (2003) have found a positive correlation between the number of LMXBs in GCs and the stellar encounter rate, . This provides evidence for the dynamical formation of LMXBs in GCs. As the descenders of the LMXBs, MSPs are also expected to have a dynamically origin.
Very recently, with the corrections of the observational effects in the radio pulsar surveys toward different GCs, Hui, Cheng & Taam (2010) have found a positive correlation between the MSP populations in GCs and , which has long been predicted. Moreover, the authors have also found another positive correlation between the metalicity and the MSP population. This relation is not unexpected as the high metalicity in a GC can result in a more efficient orbital shrinkage by magnetic braking. Therefore, the parameter space for the successful Roche-lobe overflow is enhanced (Ivanova 2006) and subsequently lead to a higher formation rate of MSPs.
A brand new window for investigating the MSPs in GCs has been open by the launch of the Fermi Gamma-ray Space Telescope. Since MSPs are the only steady -ray emitters in GCs, observations with Fermi can provide an alternative channel for investigating MSP populations. Shortly after the commence of its operation, the Large Area Telescope (LAT) onboard the spacecraft has detected rays from 47 Tucanae (hereafter 47 Tuc) (Abdo et al. 2009). Terzan 5, which hosts the largest known MSP population, has also been subsequently detected (Kong et al. 2010). As the sensitivity of LAT increases monotonically with the continuous all-sky survey, a total of 15 confirmed detections of ray emitting GCs have very recently been reported by Abdo et al. (2010a; 2010b) and Tam et al. (2010). Using years of LAT data, Abdo et al. (2010a) have detected 6 new -ray GCs besides 47 Tuc and Terzan 5. On the other hand, Tam et al. (2010) have recently reported 7 other new detections with years data. Among all known -ray GCs, Liller 1, which has the highest metalicity in our Milky way, is also found to have the highest -ray luminosity (Tam et al. 2010). This discovery further suggests that the effects of metalicity cannot be neglected. Thanks to these surveys, we are able to study these clusters as a unique class for the first time.
To explain the rays from GCs, there are two main streams. Venter & de Jager (2008) and Venter et al. (2009) suggest the rays are originated from the curvature radiation of electrons in MSP magnetospheres. However, the frequent stellar interactions can lead to a complicated magnetic field structure (Cheng & Taam 2003), which can possibly explain the difference of the radio and X-ray properties of MSPs in GCs with respect to those located in the Galactic field (cf. Hui, Cheng & Taam 2009, 2010). One consequence of the complicated surface magnetic field is to turn off the accelerating region for producing high energy photons. Ruderman & Cheng (1988) argue that if the open field lines are curving upward due to the effect of local field then in this case pair production and outflow can occur on all open-field lines. As a result, the outer-magnetospheric gap is quenched by these pairs. This scenario is supported by the fact that the MSPs in 47 Tuc are essentially thermal X-ray emitters (Bogdanov et al. 2006). All these demonstrate the potential difficulties of the pulsar magnetospheric model in explaining the observed rays from GCs, which motivate the exploration of additional / alternative emission mechanisms.
On the other hand, Bednarek & Sitarek (2007) have proposed that the inverse Compton scattering (ICS) could be a possible mechanism to produce rays from GCs. In their model they predict that GCs could be sources of GeV-TeV photons. Unfortunately they have ignored the contribution from the Galactic background photons. Very recently, through generalizing the ICS model by including various soft photon fields, Cheng et al. (2010) have found that the observed ray spectra of all 8 -ray GCs reported by Abdo et al. (2010a) can be well-modeled by the ICS between relativistic electrons/positrons in the pulsar wind of MSPs in the GCs and the background Galactic soft photons. This provides another possible explanation for the origin of the rays.
In this paper, we report the results from exploring the ray emission properties by comparing with various cluster properties, which provides us with insight on the origin of the rays from this class of GCs. In §2, we report the method and the results from the correlation and the regression analysis. We subsequently discuss the implication of these results in §3.
2 CORRELATION & REGRESSION ANALYSIS
Abdo et al. (2010a) and Tam et al. (2010) have reported 15 GCs with firm detections. This sample size is somewhat larger than that adopted by Pooley et al. (2003) for investigating the relations between the X-ray point source populations in GCs and various cluster parameters. The sensitivity limit of the current sample is erg cm-2 s-1 (0.1-100 GeV). The properties of 15 confirmed ray GCs are summarized in Table 1 and the entries are explained in the following.
| Cluster Name | aaCluster distance adopted from Abdo et al. (2010a) and Tam et al. (2010). | bbTwo-body encounter rate estimated by with the value scaled with that in M4 which has pc-3, pc and km/s | [Fe/H]ccMetalicity | ddAbsolute visual magnitude | eeEnergy densities of various soft photon fields (see text) | eeEnergy densities of various soft photon fields (see text) | ffray luminosities adopted from in Abdo et al. (2010a) and Tam et al. (2010) |
| kpc | eV cm-3 | eV cm-3 | erg s-1 | ||||
| Adopted from Abdo et al. (2010a) | |||||||
| 47 Tuc | 4.0 | 44.13 | -0.76 | -9.17 | 0.93 | 0.25 | |
| Omega Cen | 4.8 | 4.03 | -1.62 | -10.07 | 1.61 | 0.51 | |
| M 62 | 6.6 | 47.15 | -1.29 | -9.09 | 8.07 | 0.86 | |
| NGC 6388 | 11.6 | 101.99 | -0.60 | -9.74 | 2.59 | 0.56 | |
| Terzan 5 | 5.5 | 118.29 | 0.00 | -6.51 | 7.02 | 1.37 | |
| NGC 6440 | 8.5 | 74.17 | -0.34 | -8.78 | 10.79 | 1.00 | |
| M 28 | 5.1 | 13.10 | -1.45 | -7.98 | 5.47 | 0.92 | |
| NGC 6652 | 9.0 | 1.24 | -0.96 | -6.43 | 3.65 | 0.51 | |
| Adopted from Tam et al. (2010) | |||||||
| Liller 1 | 9.6 | 77.98 | 0.22 | -7.63 | 10.53 | 1.40 | |
| M 80 | 10.3 | 31.31 | -1.75 | -8.23 | 1.88 | 0.33 | |
| NGC 6441 | 11.7 | 88.42 | -0.53 | -9.64 | 3.59 | 0.69 | |
| NGC 6624 | 7.9 | 14.65 | -0.44 | -7.49 | 6.03 | 0.67 | |
| NGC 6541 | 6.9 | 20.00 | -1.83 | -8.34 | 4.69 | 0.61 | |
| NGC 6752 | 4.4 | 10.78 | -1.56 | -7.94 | 2.01 | 0.48 | |
| NGC 6139 | 10.1 | 13.28 | -1.68 | -8.36 | 4.10 | 0.69 | |
.
For choosing the cluster parameters for the correlation analysis, we have considered two-body encounter rate , metalicity , absolute visual magnitude , as well as Galactic background optical / infrared photon densities at the locations of the GCs / .
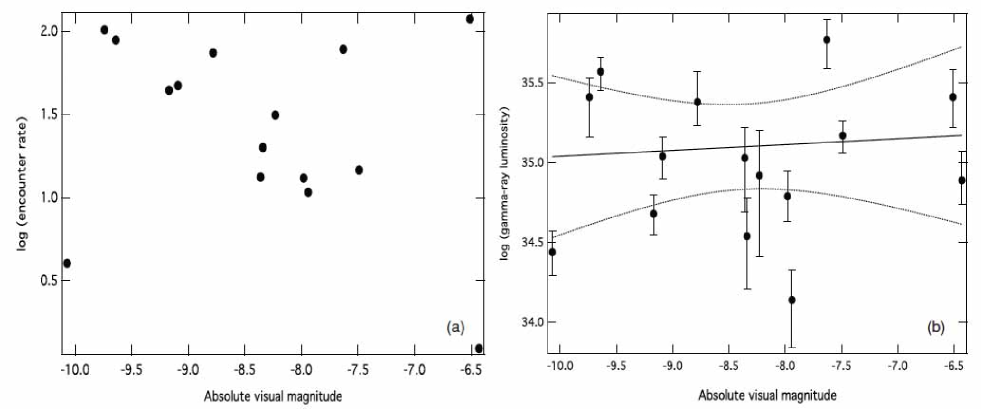
is the most obvious parameter related to the binary formation rate and hence the number of MSP in a GC. This parameter can be estimated as where is the central luminosity density, is the core radius and is the velocity dispersion at the cluster center. are adopted from Gnedin et al. (2002). For and , the values are taken from Harris (1996; 2003 version) and modified for the distances adopted for this analysis (cf. Tab. 1). Besides , Hui et al. (2010) have shown that are also a key parameter in determining the size of the MSP population in a GC. The values of are taken from Harris (1996). On the other hand, if stellar encounters were not the major channel of the binary formation, one would expect the binary population to be correlated with the cluster mass for a primordial binary origin (Lu et al. 2009; Lan et al. 2010). Pooley et al. (2003) have estimated the cluster mass by integrating the King’s profiles of the GCs. And therefore, their mass estimates are naturally correlated with . On the other hand, assuming a constant mass-to-light ratio, can also be estimated from the absolute visual magnitude : (cf. Hui et al. 2010; Lu et al. 2009). Different from the estimates adopted by Pooley et al. (2003), the correlations between our mass estimates with is only confident at the level less than (see Figure 1a). Also, the correlation between and [Fe/H] only attains a confidence level . The values of are also taken from Harris (1996) and modified for the adopted distances as presented in Table 1.
Apart from the number of MSPs, in the context of ICS model, the ray luminosity of a GC also depends on the energy density of the soft photon field (see Cheng et al. 2010). There are three components of background photons in the Galaxy which can interact with the relativistic leptons: they are relic, infrared and optical photons. As the energy density of the relic photons is uniform and does not vary from cluster to cluster, we ignore it in our analysis. We obtain the estimates of Galactic optical and infrared photon density, and with the GALPROP code (Strong & Moskalenko 1998).
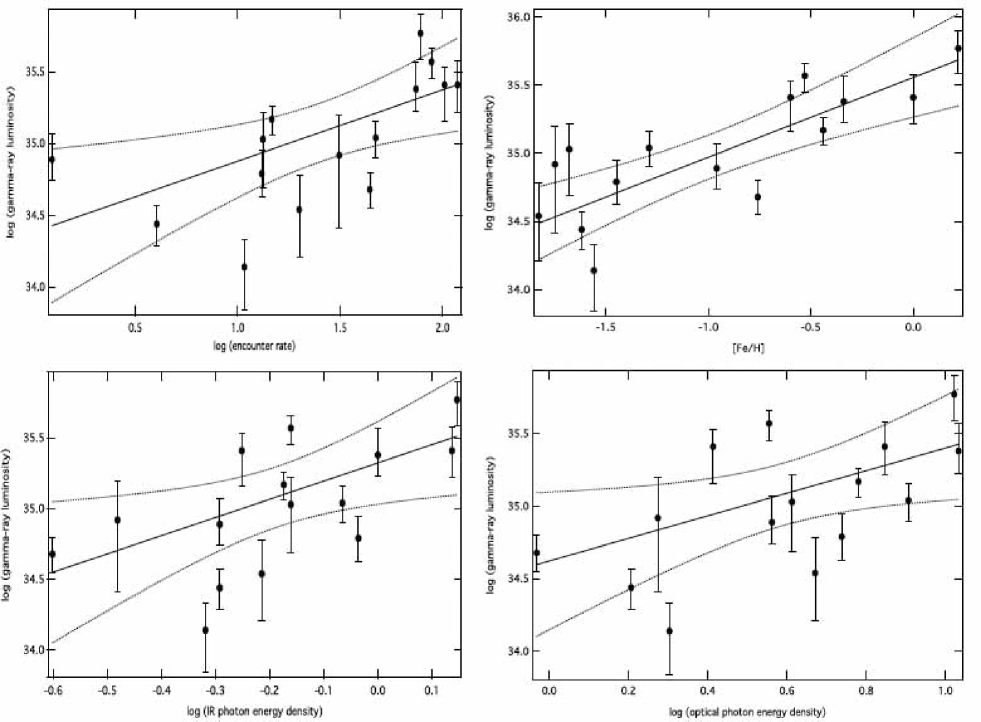
Without a priori knowledge of the distributions of the tested quantities, we follow Pooley et al. (2003) to adopt a nonparametric correlation analysis. The computed Spearman rank correlation coefficients between and various tested quantities are tabulated in Table 2. We have also computed the linear correlation coefficients (i.e. Pearson’s ) for an intutitive account for the data scattering, though they are less robust than the Spearman ranks in quantifying the correlations. We have also performed the 1-dimensional regression analysis. The best-fit parameters are also given in Table 2. All the quoted uncertainties are confidence intervals. The best-fit relations of these quantities with are plotted as solid straight lines in Figure 1b and Figure 2. We have also plotted the upper and lower confidence bands for a visual comparison for the data scattering in each panel.
Among all these parameters, the weakest correlation is found for the relation which is only significant at confidence level. Therefore, there is no convincing correlation between these two quantities (see Figure 1b). On the other hand, the correlations of with and are confident at a level over (see Figure 2). All these findings are fully consistent with the results from analysing the radio MSP population (Hui et al. 2010).
While the correlation between and was reported by Abdo et al. (2010a) with 8 GCs, the effect of metalicity was ignored in their work. From the confidence bands shown in Figure 2, the degree of data scattering of the relations is found to be the smallest among all the tested single parameters. This can be also reflected by the fact that its corresponding linear correlation attains the confidence levels over .
For the tested soft photon fields, Figure 2 shows that also tends to increase with their energy densities. For and , the confidence levels for the correlations are and respectively.
In comparison to the and relations, the relatively large scattering of the data points in the plots of and can be due to the fact that the GALPROP code is a simplification of the real situation in the Galaxy, which assumes an axisymmetric distribution of all parameters of the program (cf. Strong & Moskalenko 1998). Although it provides reliable average density of background photons in the Galaxy, the real photon densities at the locations of the GCs can differ by a factor of a few, in particular for those close to the disk.
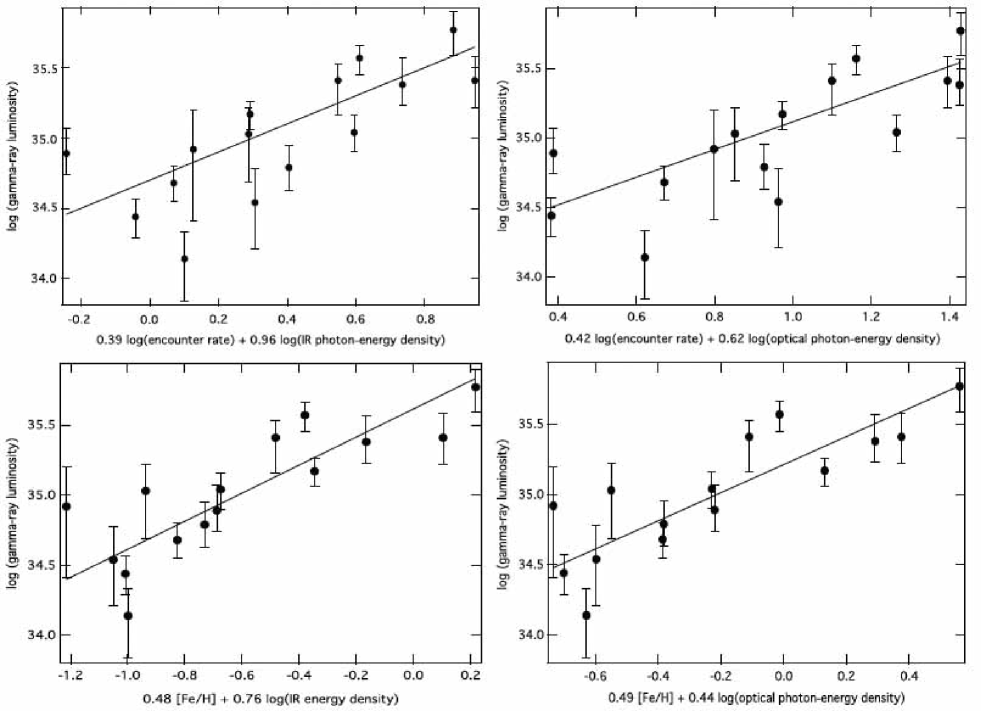
Despite the scattering, the correlation analysis strongly suggests is likely related to the soft photon energy density estimates. This inference is consistent with the ICS modeling the ray spectra of GCs (Cheng et al. 2010) which indicates neither the number of MSPs nor the soft photon energy density is the sole factor in determining . With this consideration, we investigate if , /, and / span a fundamental plane by a 2-dimensional regression analysis. We have examined the sample with the following relations:
| (1) |
| (2) |
| (3) |
| (4) |
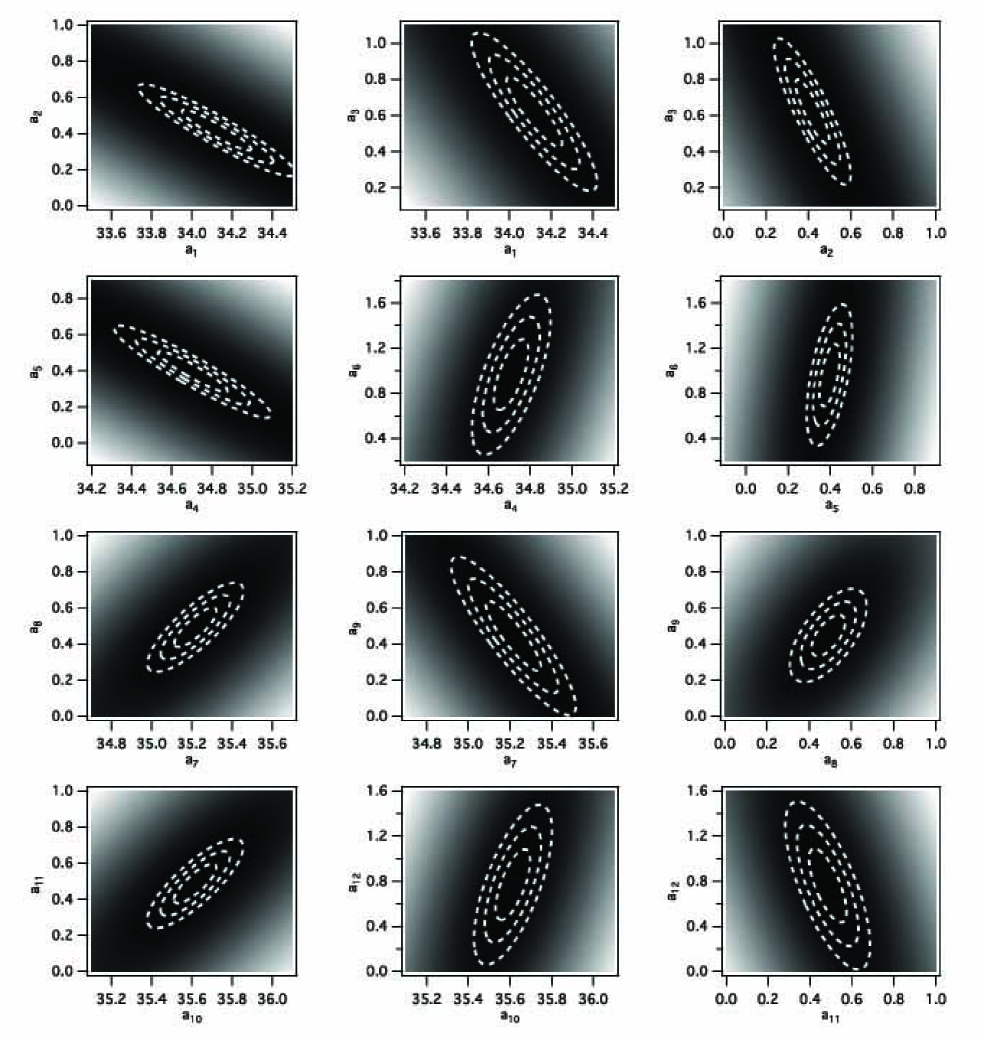
The best-fit parameters are tabulated in Table 3. We have shown the edge-on view of these best-fit fundamental plane relations in Figure 3. In comparison with Figure 2, the data scatter in these plots are somewhat reduced which suggest these fundmental plane relations can possibly provide us with better ray luminosity predictors than the single parameter relations. To better constrain the uncertainties of these parameters, we have further computed the , and confidence contours for various parametric spaces which are shown in Figure 4.
| Parameters | Spearman rank | ProbSaaThe probability that the Spearman rank correlation coefficient is different from zero. | Pearson’s | ProbPbbThe probability that the linear correlation coefficient (i.e. Pearson’s ) is different from zero. | ccThe best-fits for where is the corresponding parameters listed in column 1. | ccThe best-fits for where is the corresponding parameters listed in column 1. |
|---|---|---|---|---|---|---|
| 0.7918 | 0.9996 | 0.6414 | 0.9900 | |||
| 0.7614 | 0.9990 | 0.7912 | 0.9996 | |||
| -0.0536 | 0.1505 | -0.0767 | 0.2141 | |||
| 0.5523 | 0.9672 | 0.5976 | 0.9814 | |||
| 0.6589 | 0.9925 | 0.5970 | 0.9812 |
| Parameters | Best-fit values |
|---|---|
3 DISCUSSION
We have examined the ray emission properties of a group of GCs. By investigating the possible correlations between the ray power and a number of cluster properties, we shed light on the origin of the rays from these GCs. First of all, the correlation between and suggests the high energy radiation are intimately related to the population of dynamically-formed objects, which are presumably MSPs, confirming Abdo et al. (2010a) who used 8 GCs in their study. Together with the lack of any correlation with and hence the cluster mass, this is fully consistent with the inference suggested by Hui et al. (2010) and consolidates the dynamical formation scenario of MSPs in GCs.
Apart from , we have found that is also positively correlated with . This is well-consistent with the tendency deduced from studying the radio MSP population in GCs (Hui et al. 2010) and the fact that the GC possesses the highest [Fe/H] also has the highest (Tam et al. 2010). Ivanova (2006) proposes that the absence of the outer convective zone in metal-poor main sequence donor stars in the mass range of - , in comparison to their metal rich counterparts can be responsible, since the absence of magnetic braking in such stars precludes orbital shrinkage, thereby, significantly reducing the binary parameter space for the production of bright LMXBs. For a conventional scenario, MSPs are the old pulsars that have passed through the death-line in diagram which are subsequently spun-up in the binaries. As the metalicity determines the parameter space for successful Roche-lobe overflow, it is also a key parameter in determining the intrinsic number of MSPs in a GC (Hui et al. 2010; Ivanova 2006).
We note that the link between the LMXBs in extragalactic GCs and the metalicity is somewhat weaker than with the cluster mass (e.g. Sivakoff et al. 2007; Kim et al. 2006; Kundu et al. 2002), which is different from the inference drawn from our investigation of the Galactic MSP-hosting or ray selected clusters. However, a direct comparison between these two populations has to be cautious. As the MSPs are long-lived and are produced by the previous generations of LMXBs, their dynamical properties might be different from that of the LMXB population currently observed. Since the relaxation time at the cluster core is generally longer than the lifetime of LMXBs, the cluster is continuously evolved with mass segregation at the cluster center which can result in a varying formation rate of compact binaries (cf. the discussion in Hui et al. 2010). Also, while a large number of LMXB-hosting GCs in Virgo cluster early-type galaxies have relaxation times Gyr, there is no single GC in our Galaxy with a relaxation timescale larger than this value contains an active LMXB (cf. Sivakoff et al. 2007). Although the reason is still unclear, this suggests possible different properties between the Milky Way GCs and the extragalactic ones. Further investigations are required to understand the difference.
It is instructive to compare the fundamental plane relations of the ray population with the best-fits inferred from the radio MSP population in GCs. Hui et al. (2010) have found that the slopes of and inferred from the radio GC MSPs population are and respectively. Within these quoted uncertainties, the slope of the relation for the radio population is found to intersect with the error contours for the corresponding parameters of the ray fundamental plane relations (i.e. and ). On the other hand, the logarithmic slope of the relation for the radio population is only marginally overlapped with the rims of the error contours for the corresponding parameters inferred from the ray population (i.e. and ).
We have also identified possible positive correlations with various soft photon fields which have significances compatible with those for the encounter rate and the metalicity. These correlations are not expected from the magnetospheric model. Together with the uncertainty of the sustainability of the outergaps in the MSPs in GCs (see §1), our finding further motivate the exploration of alternative explanations for the origin of the observed -ray from GCs.
Abdo et al. (2010a) have argued that the -ray emission is magnetospheric in nature because of the hard photon indices and the cutoff energies inferred from the phenomenological model is consistent with the values expected from the magnetospheric model. On the other hand, Cheng et al. (2010) have recently found that the ICS model can also describe the observed ray spectra of all the GCs discovered by Abdo et al. (2010a) very well. Simply based on the model fitting, we were not able to discriminate these two scenarios unambiguously. However, different from the case of the magnetospheric model, positive correlation between the energy density of the soft photon fields are expected in a ICS scenario as the ICS power is directly proportional to soft photon energy density.
The energy density of the background soft photon field depends on the location of the cluster. We notice these -ray GCs are possibly resided in the Galactic bulge and therefore they are also metal-rich clusters. This results in a natural correlation between the metalicity and the soft photon energy density with a significance . Therefore, it is non-trivial to disentangle the effects of these two parameters.
In any case, our investigation strongly suggests that either the metalicity or the soft photon energy density has to be the new parameter, in addition to , in determining the observed -ray luminosities. This inference is supported by comparing the results reported by Abdo et al. (2010a) and Tam et al. (2010). Apart from the 8 confirmed cases, Abdo et al. (2010a) have also reported 5 non-detections which include three upper-limits and two other cases with the ray emission slightly offset from the respective GC cores. With the LAT data of a longer exposure, Tam et al. (2010) have found a larger number of -ray GCs including 4 previously non-detected cases in Abdo et al. (2010a). This leaves M 15 to be the only non-detected GC in Abdo et al. (2010a). This is not unexpected from trends of metalicity and background soft photon energy density. Although the encounter rate of M 15 () is even higher than M 62, its metalicity ([Fe/H]=-2.26) and the background soft energy densities at its location ( eV cm-3; eV cm-3) are much lower than those of all 15 confirmed -ray GCs.
In view of the aforementioned complication, it is not possible to discriminate the ICS and the magnetospheric scenarios unambiguously simply based on the currently available information. Also, there is still a degeneracy within the context of ICS model. Cheng et al. (2010) show that the ray spectrum from 47 Tuc can be explained equally well by upward scattering of either the relic photons, the Galactic infrared photons or the Galactic optical photons whereas the ray spectra from the other seven GCs reported by Abdo et al. (2010a) are best fitted by the upward scattering of either the Galactic infrared photons or the Galactic optical photons. This has prompted us also to discriminate which source provides the predominant soft photon field for ICS.
Since the IC radiation power is directly proportional to the energy density of the soft photon field, a logarithmic slope of unity is thus expected for the fundamental plane parameters , , and . For the corresponding parameters of (i.e. and ), the line of unity is found to cut through the centers of the error contours for both and [Fe/H] fundamental plane relations. On the other hand, for the parameters correspond to (i.e. and ), the expected value is only marginally intersected with their error contours. Although an unambiguous conclusion cannot be drawn from the current population yet, the comparison between the theoretical expectation and the fundamental plane parameters does favor the scenario involving the background infrared emission as the soft photon field for IC upscattering.
We would like to point out that the predicted spectral shape in energy regime much larger than 10 GeV is significantly different for different soft photon fields (cf. Fig. 2 in Cheng et al. 2010). Therefore, observations with TeV facilities, such as MAGIC, HESS and VERITAS, can be feasible to lift up this degeneracy. Furthermore, as the ICS model and the magnetospheric model predict a rather different TeV spectrum for GCs (Cheng et al. 2010; Venter et al. 2009), TeV observations in the future can possibly better discriminate these two possible contributions of soft photons.
Constraints for the emission model can also be derived from the other energy bands. With the diffusion of the relativistic pulsar wind particles, it has been shown that extended radio and X-ray emission from the GCs can also be produced by synchrotron radiation and ICS respectively (Cheng et al. 2010). This is consistent with the recent discovery of the diffuse X-rays around Terzan 5 which exteneded up pc (Eger, Domainko & Clapson 2010). Although a clear scenario cannot be identified yet, these diffuse X-rays are more likely to have a non-thermal origin (Eger, Domainko & Clapson 2010). Assuming these X-rays are originated from the tail of ICS, the corresponding ray spectrum can be calculated (Cheng et al. 2010). Therefore, a systematic search for the extended X-ray and radio feature outside the half-mass radii of the other ray GCs can provide us indpendent constraints.
In exploring the fundamental plane relations, our analysis suggests that by combining the soft photon energy densities with / the data scattering can be reduced. These best-fit relations can provide the indicators in identifying what kind of GCs are potential ray sources for a further search. And the other way round, any deeper ray search from the GCs can result in an enlarged sample size and a lower sensitivity limit than the current value (i.e. erg cm-2 s-1), which will certainly enable a further test for all these reported relations.
References
- Abdo et al. (2009) Abdo, A. A.. et al. 2009, Science, 325, 845
- Abdo et al. (2010a) Abdo, A. A., et al. 2010a, arXiv:1003.3588v2
- (3) Abdo, A. A., et al. 2010b, ApJS, 188, 405
- (4) Alpar, M. A., Cheng, A. F., Ruderman, M. A., & Shaham, J. 1982, Nature, 300, 728
- (5) Bednarek, W. & Sitarek, J. 2007, MNRAS, 377, 920
- (6) Bogdanov, S. et al. 2006, ApJ, 646, 1104
- (7) Cheng, K. S., et al. 2010, ApJ, 723, 1219
- (8) Cheng, K. S., & Taam, R. E., 2003, ApJ, 598, 1207
- (9) Clark, G. W. 1975, ApJ, 199, L143
- (10) Eger, P., Domainko, W., & Clapson, A.-C. 2010, A&A, 51, 66
- (11) Gendre, B., Barret, D., & Webb, N. 2003, A&A, 403, L11
- (12) Gnedin, O. Y., Zhao, H. S., Pringle, J. E., Fall, S. M., Livio, M., & Meylan, G. 2002, ApJ, 568, L23
- (13) Harris, W.E. 1996, AJ, 112, 1487 (2003 version)
- (14) Hui, C. Y., Cheng, K. S., & Taam, R. E. 2010, ApJ, 714, 1149
- (15) Hui, C. Y., Cheng, K. S., & Taam, R. E. 2009, ApJ, 700, 1233
- (16) Ivanova, N. 2006, ApJ, 636, 979
- (17) Katz, J. I. 1975, Nature, 253, 698
- (18) Kim, E., et al. 2006, ApJ, 647, 276
- Kong et al. (2010) Kong, A. K. H., Hui, C. Y., & Cheng, K. S. 2010, ApJ, 712, L36
- (20) Kundu, A., Maccarone, T.J., & Zepf, S. E. 2002, ApJ, 574, L5
- (21) Lan, S. H., et al. 2010, ApJ, 712, 380
- (22) Lu, T. N., et al. 2009, ApJ, 705, 175
- (23) Manchester, R. N., Hobbs, G. B., Teoh, A., & Hobbs, M. 2005, AJ, 129, 1993
- (24) Pooley, D., et al. 2003, ApJ, 591, L131
- (25) Ruderman, M., & Cheng, K. S. 1988, ApJ, 335, 306
- (26) Sivakoff, G.R., et al. 2007, ApJ, 660, 1246
- Strong & Moskalenko (1998) Strong, A. W. & Moskalenko, I. V. 1998, ApJ, 509, 212
- (28) Tam, P. H. T., Kong, A. K. H., Hui, C. Y., & Cheng, K. S. 2010, submitted to ApJ
- Venter & de Jager (2008) Venter, C. & de Jager, O. C. 2008, ApJ, 680, L125
- Venter et al. (2009) Venter, C., De Jager, O. C., & Clapson, A.-C. 2009, ApJ, 696, L52