Black Hole Mass Limits for Optically Dark X-ray Bright Sources in Elliptical Galaxies
Abstract
Estimation of the black hole mass in bright X-ray sources of nearby galaxies is crucial to the understanding of these systems and their formation. However, the present allowed black hole mass range spans five order of magnitude () with the upper limit obtained from dynamical friction arguments. We show that the absence of a detectable optical counterpart for some of these sources, can provide a much more stringent upper limit. The argument is based only on the assumption that the outer regions of their accretion disks is a standard one. Moreover, such optically dark X-ray sources cannot be foreground stars or background active galactic nuclei, and hence must be accreting systems residing within their host galaxies. As a demonstration we search for candidates among the point-like X-ray sources detected with Chandra in thirteen nearby elliptical galaxies. We use a novel technique to search for faint optical counterparts in the HST images whereby we subtract the bright galaxy light based on isophotal modeling of the surface brightness. We show that for six sources with no detectable optical emission at the 3sigma level, their black hole masses . In particular, an ultra-luminous X-ray source (ULX) in NGC 4486 has . We discuss the potential of this method to provide stringent constraints on the black hole masses, and the implications on the physical nature of these sources.
1 Introduction
Compact, off-nuclear X-ray point sources in nearby galaxies, with luminosities are referred to as Ultra-Luminous X-ray sources (ULXs). Detected in the early 1980’s, with the Einstein X-ray satellite (Fabbiano, 1989), these objects were further studied with ROSAT (Colbert & Mushotzky, 1999) and ASCA (Makishima et al., 2000). The XMM-Newton and Chandra X-ray observatories with their significantly higher angular resolution, dramatically confirmed the presence of ULXs (Kaaret et al., 2001), and have enabled their spectral and temporal properties to be studied in detail (see Miller & Colbert, 2004; Mushotzky, 2004, 2006; Roberts, 2007, for reviews).
The observed luminosities of ULXs exceed the Eddington limit for a black hole. Since ULX are off-nuclear sources, their masses must be from dynamical friction arguments (Kaaret et al., 2001). Thus, ULX may represent a class of Intermediate Mass Black Holes (IMBHs) whose mass range () lies between that of stellar mass black holes and super-massive black holes observed in galaxy centers (Makishima et al., 2000). Alternatively, ULX may be stellar mass black hole systems exhibiting super-Eddington accretions with their radiation geometrically beamed (Shakura & Sunyaev, 1973; King, 2008).
X-ray spectroscopy has provided supporting evidence in favor of IMBHs of in ULXs (Miller et al., 2003, 2003; Cropper et al., 2004; Dewangan et al., 2004; Roberts et al., 2005; Devi et al., 2008). Moreover, X-ray timing characteristics, i.e. presence of low frequency QPOs and/or breaks in the power density spectra, also suggests that ULX may harbor - black holes (Strohmayer & Mushotzky, 2003; Dewangan et al., 2006; Mucciarelli et al., 2006; Strohmayer & Mushotzky, 2009). While indicative these results are not conclusive, since there are also several arguments against IMBHs in ULXs (see e.g., Mushotzky, 2004; Roberts, 2007) and further investigations are required to reveal the true nature of these sources.
Study of the host galaxy properties of ULXs reveals that their number and total X-ray luminosity is related to recent star formation activity, suggesting that they originate in young short-lived systems (Swartz et al., 2004, 2009). While the number of ULXs per galaxy is roughly the same for both spirals and ellipticals, the ones in the spirals have significantly higher luminosities (Swartz et al., 2004). Optical counterparts have been reported for some ULX (Liu et al., 2004; Kuntz et al., 2005; Ramsey et al., 2006; Terashima et al., 2006). While some of the counterparts have been identified as O stars (Liu et al., 2002b, 2007), for most ULXs, the optical counterparts are stellar clusters (Goad et al., 2002; Ptak et al., 2006). However, for many ULX, the optical counterparts reveal that they are either background AGN (Gutierrez, 2006; Bonfini et al., 2009) or foreground stars. ULXs found in elliptical galaxies may have contamination from background sources at % level (Swartz et al., 2004). Detailed studies of X-ray sources in general and their connection with globular clusters have been undertaken (Kim et al., 2006, 2009) who note that the X-ray properties of the the sources in the field (i.e. without optical counterparts) are not different from those in globular clusters.
The allowed black hole mass range for X-ray sources in nearby galaxies span five orders of magnitude () and it is important to obtain tighter constrains. Here, we show that the absence of a detectable optical emission allows us to impose an upper limit on the black hole mass for these accreting systems based on some standard assumptions. Moreoever, We argue that these optically dark X-ray sources cannot be foreground stars or background AGN and hence are a true sample of sources located within the host galaxy. To demonstrate the technique, we search for candiatates among X-ray bright sources detected by Chandra in archival HST ACS, and WFPC2 images.
| Galaxy | Distance (Mpc) | ||
|---|---|---|---|
| NGC 1399 | |||
| NGC 4649 | |||
| NGC 4697 | |||
| NGC 1291 | |||
| NGC 4365 | |||
| NGC 1316 | |||
| NGC 4125 | |||
| NGC 3379 | |||
| NGC 4374 | |||
| NGC 4486 | |||
| NGC 4472 | |||
| NGC 1407 | |||
| NGC 4552 |
Note. — (1) Host galaxy name; (2) Distance to the galaxy ; (3) Number of X-ray sources within HST field of view; (4) Number of X-ray sources without optical counterparts

2 Observations and Data Reduction
Swartz et al. (2004) analyzed Chandra observations of 82 nearby galaxies and have identified bright X-ray sources in them. Of these we select 13 elliptical galaxies for which HST observations are available. Devi et al. (2007) analyzed a subset of thirty galaxies from the Swartz et al. (2004) sample, and fitted the X-ray points sources with both a power-law and a disk black body model, hence obtaining a more conservative and robust estimation of their X-ray luminosity. Nine out of the sub-sample analyzed by Devi et al. (2007) are ellipticals, and for these galaxies we use the X-ray luminosity and coordinates given by them for the present analysis. For the remaining four galaxies we use the values quoted by Swartz et al. (2004). The details of the sample galaxies are given in Table 1.
The optical study was carried out using the images taken with the Advanced Camera for Surveys (ACS), and Wide Field and Planetary Camera (WFPC2) that are available in the HST data archive. When observations from both cameras were available, the datasets with the longer exposure time, and multiple filters were preferred. For the same combination of camera and filters, various images available for different pointings of the same galaxy were analyzed when available, so as to maximize the number of X-ray sources because for different pointings, a different set of X-ray sources would fall in the field of view.
| Galaxy | log | HST Filter | |||||
|---|---|---|---|---|---|---|---|
| NGC 4486 | 12 30 50.82 | +12 25 02.66 | F475W | 0.409 | 533 | 1244 | |
| NGC 4697 | 12 48 33.20 | -05 47 41.17 | F475W | 0.752 | 243 | 2890 | |
| NGC 4649 | 12 43 41.90 | +11 34 33.83 | F475W | 0.402 | 164 | 3073 | |
| NGC 4374 | 12 25 01.54 | +12 52 35.59 | F475W | 0.441 | 347 | 3378 | |
| NGC 1399 | 3 38 25.92 | -35 27 42.37 | F606W | 0.370 | 228 | 3927 | |
| NGC 1316 | 3 22 36.46 | -37 13 24.68 | F475W | 0.449 | 179 | 4780 | |
| NGC 1316 | 3 22 35.58 | -37 13 14.10 | F555W | 0.520 | 287 | 6366 | |
| NGC 1399 | 3 38 32.33 | -35 26 45.73 | F606W | 0.377 | 186 | 7829 | |
| NGC 1399 | 3 38 27.62 | -35 26 48.76 | F606W | 0.766 | 702 | 7829 | |
| NGC 4649 | 12 43 34.17 | +11 33 41.93 | F475W | 0.912 | 97 | 8073 |
Note. — (1) Host galaxy name; (2) Right Ascension of shifted position in hours, minutes and seconds; (3) Declination of shifted position in degrees, arcminutes and arcseconds; (4) log of X-ray luminosity in ; (5) HST filter for which the upper limit on flux and the black hole mass limit is calculated; (6) Upper limit on Optical flux in ergs/s/cm2/Hz; (7) Lower limit on ratio of X-ray to optical flux; (8) , Upper limit on black hole mass.
Most of the optical sources are too faint to be detected against the dominant galaxy light that fills most of the images. To enhance the contrast, and aid in the detection of point sources in the image, the galaxy light was modeled based on the isophotes obtained using the ellipse task in IRAF/STSDAS software. Bright objects, if any, were masked during the fitting. The residual image was obtained by subtracting the model image from the observed galaxy image. The object extraction was done on the residual image using SEXTRACTOR with a threshold level of 3 sigma. On visual inspection, we find that many of the Chandra X-ray sources have counterparts in the HST images, within a positional offset of less than a few arc-seconds. This constant offset was applied for a given galaxy, to match the Chandra sources to the optical sources in the SEXTRACTOR catalog. When images are available in multiple filters, one of the optical images is considered as the reference image, and the necessary offset is applied to match it to the X-ray co-ordinates. The images in other optical filters are then aligned to the reference image using geomap and geotran tasks in IRAF. While a more detailed report on the nature of sources with optical counterparts will be presented later, in this work, we concentrate on those sources for which no optical counterpart was detected.
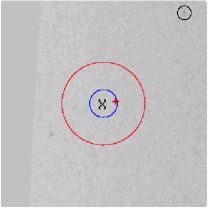
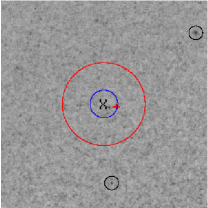
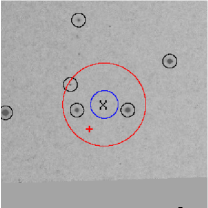
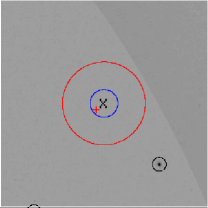
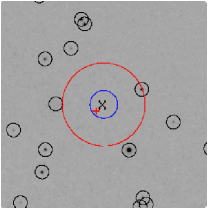
X-ray sources which did not have an optical counterpart (at the 3sigma level) within of their shifted positions, are termed as optically “dark” sources. Six examples of such sources are shown in Figure 1, where the and circles centered on the X-ray co-ordinates are overlaid on the observed optical image. Note that for four of these images, there are no optical source within of the X-ray position. Having identified such optically ”dark” X-ray sources, we estimate the upper limit on their optical flux based on the 3sigma threshold at that position.
3 Optically dark X-ray sources
These optically dark sources are X-ray bright compared to their optical emission and hence are not foreground stars. This can be further quantified by estimating the X-ray-to-optical flux ratio where is the unabsorbed flux in the band and is the flux in an optical band. This ratio ranges from to for AGNs including BL Lacs when is in the band and the V-band magnitude is used (Stocke et al., 1991). In contrast, the estimated lower limit for the optically dark sources in the sample is significantly larger. This is illustrated in Table (LABEL:BHmass) where the ratio is given for ten sources. We, therefore, conclude that these sources are not background AGNs.
Thus, these sources are most likely to be bright X-ray binaries (or at least accreting systems) within the galaxy. An accretion disk around a compact object should also produce optical emission whose flux can be estimated as follows. In the standard accretion disk theory (Shakura & Sunyaev, 1973), the effective temperature profile as a function of radius , of an accretion disk around a black hole with mass and accretion rate , is given by where . The observed flux from the disk at a frequency is then given by the integrated sum of the black body emission over all radii,
| (1) |
where is the blackbody intensity, and are outer and inner radii of the disk, is the inclination angle of the disk and is the distance to the source. Assuming that most of the contribution to arises from regions in the disk that are far away from the inner and outer radii, the expected observed flux can be written as
| (2) | |||||
where is the wavelength and is the radiative efficiency of the accreting system and cos is taken to be .
For optically dark ULX, the predicted accretion flux should be less than the measured upper limit . Thus one can estimate an upper limit on the black hole mass as
| (3) | |||||
For each dark X-ray source in our sample, and for all available filters, we estimate this upper limit on the black hole mass. We use the integration (Eqn 1) to evaluate the upper limit, rather than the approximation Eqn. (3) i.e. we take into account the effect of the inner boundary condition () on the temperature profile. The difference in the upper limit obtained is marginal (%). We assume a standard radiative efficiency of and cos. To obtain a more conservative upper limit, the one-sigma lower value of the X-ray luminosity are used . In Table LABEL:BHmass, we list the ten best cases in ascending order of black hole mass limit . For the other sources, and hence is not a significant constraint. The best case is for the ULX in NGC 4486, for which .
X-ray irradiation of the outer disk may increase the local temperature there and the disk may emit a larger optical emission. We have estimated this effect using the formalism given in the appendix of Vrtilek et al. (1990) and find that X-ray irradiation is not important for the constraint obtained here.
4 Discussion
Optically dark X-ray sources cannot be foreground stars or background AGN, otherwise their optical emission would be significantly higher than what is detected. Hence, these are a clean sample of sources within the host galaxies, which are probably accreting black hole systems. The optical emission from a standard accretion disk scales as mass of the black hole and hence the non-detection of optical emission imposes an upper limit on the black holes mass . For ten of the sources . For a source in NGC 4486 with an X-ray luminosity clearly exceeding ergs/s (and therefore a bona-fide ULX by definition), the estimated black hole mass is smaller than . This is two orders of magnitude smaller than the constraint obtained from dynamical friction, which is .
These sources with black hole mass, cannot be accreting systems with massive black holes residing in star clusters, or in the nuclei of merged satellite galaxies. For typical low-luminosity dwarf galaxies (; Mateo, 1998), such an optical counterpart would be easily detected, given that our 3sigma limits on the images are much fainter. Even a compact nucleus of a merged dwarf galaxy (; Lotz et al., 2004) would have been easily identified. If they are binary systems, their companion cannot be a massive O star as such a star would have been detected in the optical image. Assuming an O star, with , we find that the possibility of such a companion can be ruled out in all cases for which (Table LABEL:BHmass).
In all of the above arguments, we have ignored the effect of dust obscuration in the host galaxies, because we are only considering elliptical galaxies in the present work. Although some ellipticals are known to have dust lanes, and nuclear rings in their centers, the X-ray sources we are considering here are distributed at fairly large radial distance from the center to be significantly affected by dust.
Even for the best cases of optically dark X-ray sources presented in Table (LABEL:BHmass), the range of black hole mass allowed is still large as the source could be a intermediate mass black hole, or a few solar mass object emitting at super-Eddington luminosities. The brightest X-ray sources in the sample have a luminosity of a few times ergs/s. This is unfortunate, since a dark source with luminosity would have provided an order of magnitude better constraint on the black hole mass. Since the black hole mass upper limit a bright X-ray source in a more nearby galaxy () would have also provided significantly better constraints. A systematic search for such sources in very nearby galaxies may indeed prove fruitful. Another point to note is that bright X-ray sources in these galaxies are known to be variable in X-rays. Our analysis in this work, implicitly assumes that the X-ray luminosity observed through a single Chandra observation, represents an average luminosity which is used to derive an average accretion rate which in turn is used to estimate the upper limit on the black hole mass (Eqn 3). This assumption is required because the expected optical emission arises from the outer part of the disk and the local accretion rate there may be different than the one in the inner region which produces the X-rays. Any accretion rate fluctuation in the outer disk will be transfered along the disk on the viscous time-scale which could be significantly longer than a day. Thus, in principle one needs to ascertain the average X-ray luminosity of a source, and using a single very bright, but rare, X-ray observation of the source will not represent the average accretion rate.
A systematic and comprehensive multi-wavelength study (using also other bands like infra-red and radio), along with X-ray variability studies, can shed further light on the nature of these sources.
References
- Bonfini et al. (2009) Bonfini, P., Hatzidimitriou, D., Pietsch, W., & Reig, P. 2009, A&A, 507, 705
- Colbert & Mushotzky (1999) Colbert, E. J. M., & Mushotzky, R. F. 1999, ApJ, 519, 89
- Cropper et al. (2004) Cropper, M., Soria, R., Mushotzky, R. F., Wu, K., Markwardt, C. B., & Pakull, M. 2004, MNRAS, 349, 39
- Devi et al. (2007) Devi, A. S., Misra, R., Agarwal, V. K., & Singh, K. Y. 2007, ApJ, 664, 458
- Devi et al. (2008) Devi, A. S., Misra, R., Shanthi, K., & Singh, K. Y. 2008, ApJ, 665, 455
- Dewangan et al. (2004) Dewangan, G. C., Miyaji, T., Griffiths, R. E., & Lehmann, I. 2004, ApJ, 608, L57
- Dewangan et al. (2006) Dewangan, G. C., Titarchuk, L., & Griffiths, R. E. 2006, ApJ, 637, L21
- Fabbiano (1989) Fabbiano, G. 1989, ARA&A, 27, 87
- Goad et al. (2002) Goad, M., Roberts, T., Knigge, C., & Lira, P. 2002, MNRAS, 335, L67.
- Gutierrez (2006) Gutierrez, C. 2006, ApJ, 640, L17
- Kaaret et al. (2001) Kaaret, P., et al. 2001, MNRAS, 321, L29.
- Kim et al. (2006) Kim, E., et al. 2006b, ApJ, 647, 276
- Kim et al. (2009) Kim, D.-W., et al. 2009, ApJ, 703, 829
- King (2008) King A. R., 2008, MNRAS, 385, L113
- Kuntz et al. (2005) Kuntz, K. D., Gruendl, R. A., Chu, Y.-H., Chen, C.-H. R., Still, M., Mukai, K., & Mushotzky, R. F. 2005, ApJ, 620, L31
- Liu et al. (2002b) Liu, J. F., Bregman, J., & Seitzer, P. 2002b, ApJ, 580, L31
- Liu et al. (2004) Liu, J.-F., Bregman, J. N., & Seitzer, P. 2004, ApJ, 602, 249
- Liu et al. (2007) Liu, J.-F., Bregman, J., Miller, J., & Kaaret, P. 2007, ApJ, 661, 165
- Lotz et al. (2004) Lotz, J. M., Miller, B. W., & Ferguson, H. C. 2004, ApJ, 613, 262
- Makishima et al. (2000) Makishima, K., et al. 2000, ApJ, 535, 632
- Mateo (1998) Mateo, M. L. 1998, ARA&A, 36, 435
- Miller et al. (2003) Miller, J. M., Fabbiano, G., Miller, M. C., & Fabian, A. C., 2003, ApJ, 585, L37.
- Miller et al. (2003) Miller, J. M., Fabbiano, G., Miller, M. C., & Fabian, A. C. 2003, ApJ, 585, L37
- Miller & Colbert (2004) Miller, M. C., & Colbert, E. J. M. 2004, International Journal of Modern Physics D, 13, 1
- Mucciarelli et al. (2006) Mucciarelli, P., Casella, P., Belloni, T., Zampieri, L., & Ranalli, P. 2006, MNRAS, 365, 1123
- Mushotzky (2004) Mushotzky, R. 2004, Progress of Theoretical Physics Supplement, 155, 27
- Mushotzky (2006) Mushotzky, R. 2006, Advances in Space Research, 38, 2793
- Ptak et al. (2006) Ptak, A., et al. 2006, ApJS, 166, 154
- Ramsey et al. (2006) Ramsey, C. J., Williams, R. M., Gruendl, R. A., Chen, C.-H. R., Chu, Y.-H., & Wang, Q. D. 2006, ApJ, 641, 241
- Roberts et al. (2005) Roberts, T. P., Warwick, R. S., Ward, M. J., Goad, M. R., & Jenkins, L. P. 2005, MNRAS, 357, 1363
- Roberts (2007) Roberts, T. P. 2007, Ap&SS, 311, 203
- Shakura & Sunyaev (1973) Shakura N. I., Sunyaev R. A., 1973, A&A, 24, 337
- Stocke et al. (1991) Stocke, J. T., Morris, S. L., Gioia, I. M., Maccacaro, T., Schild, R., Wolter, A., Fleming, T. A., & Henry, J. P. 1991, ApJS, 76, 813
- Strohmayer & Mushotzky (2003) Strohmayer, T. E., & Mushotzky, R. F. 2003, ApJ, 586, L61
- Strohmayer & Mushotzky (2009) Strohmayer, T. E., & Mushotzky, R. F. 2009, ApJ, 703, 1386
- Swartz et al. (2004) Swartz, D. A., Ghosh, K. K., Tennant, A. F., Wu K. 2004, ApJS, 154, 519.
- Swartz et al. (2009) Swartz, D. A., Tennant, A. F., & Soria, R. 2009, ApJ, 703, 159
- Terashima et al. (2006) Terashima, Y., Inoue, H., & Wilson, A. S. 2006, ApJ, 645, 264
- Vrtilek et al. (1990) Vrtilek, S. D., Raymond, J. C., Garcia, M. R., Verbunt, F., Hasinger, G., & Kurster, M. 1990, A&A, 235, 162