Energy transport by neutral collective excitations at the quantum Hall edge
Abstract
We use the edge of the quantum Hall sample to study the possibility for counter-propagating neutral collective excitations. A novel sample design allows us to independently investigate charge and energy transport along the edge. We experimentally observe an upstream energy transfer with respect to the electron drift for the filling factors 1 and 1/3. Our analysis indicates that a neutral collective mode at the interaction-reconstructed edge is a proper candidate for the experimentally observed effect.
pacs:
73.40.Qv 71.30.+hSince the physics of quantum Hall (QH) effect is largely investigated now, QH regime can be conveniently used to model complicated phenomena from different areas of modern physics. Particularly, gapless collective excitations are of special interest in graphene physics, topological insulators, and quantum computation. In the QH regime the universal low-energy physics is only connected with edge collective modes wen . It was proposed kane , that at some fractional filling factors interaction can lead to an unusual neutral collective mode, which propagates upstream with respect to electron drift and carries only energy.
Neutral modes have not been observed in a direct heat-transport experiment granger , however, they were detected in shot-noise measurements heiblum . This discrepancy might originate from different experimental methods, so an independent investigation in a different experimental configuration is of great interest.
Here, we use the reconstructed edge of the quantum Hall sample to study the possibility of counter-propagating neutral collective excitations. The edge reconstruction is predicted yang to result from the interplay between the smooth edge potential and the Coulomb interaction energy. Experimental arguments for the reconstruction of this type can be found in the capacitance measurements at the edges of plateau, where a so-called negative compressibility was experimentally observed eisen . A novel sample design allows us to independently investigate charge and energy transport along the edge. We experimentally observe an upstream energy transfer with respect to the electron drift for the filling factors 1 and 1/3. Our analysis indicates that a neutral collective mode at the interaction-reconstructed edge is a proper candidate for the experimentally observed effect.
Our samples are fabricated from a molecular beam epitaxially-grown GaAs/AlGaAs heterostructure. It contains a two-dimensional electron gas (2DEG) located 200 nm below the surface. The 2DEG mobility at 4K is cm2/Vs and the carrier density is cm-2.
A novel sample design realizes the theoretically proposed scheme with independent injector and detector rosenow , see Fig. 1, (top). Each sample has two macroscopic () etched regions inside, separated by a distance of 300 m. A split-gate partially encircles the etched areas, leaving uncovered two m wide gate-gap regions, separated by 30 m, at the outer mesa edge. Ohmic contacts are placed along the mesa edges.
In samples with a smooth edge profile, edge states buttiker (ES) are represented by compressible strips of finite width shklovsky , located at the intersections of the Fermi level and filled Landau levels. Every ES is characterized by a definite electrochemical potential, which is constant along ES except for the regions of charge exchange buttiker ; shklovsky . For a bulk filling factor , there are two co-propagating ES in each gate-gap region, separated by the incompressible strip with local filling factor . We deplete the 2DEG under the gate to the same filling factor , so that the incompressible state fully separates the outer and the two inner edges. They are only connected by inter-ES transport in the gate-gap junctions. The maximum junction resistance does not exceed 3 MOhm, where is the ratio between the maximum charge equilibration length mueller and the gate-gap width . Because of finite , one can expect for the electrochemical potentials of two ES in the equilibrium.
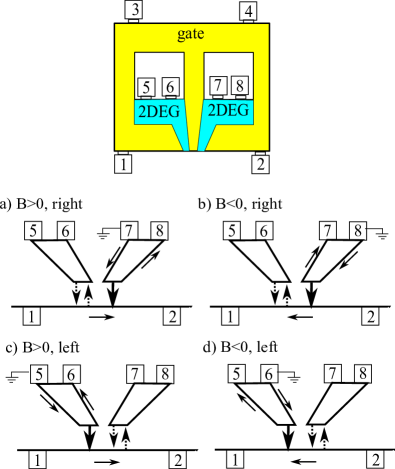
In the present experiment, we enforce inter-ES transport in one gate-gap junction (injector), by applying a dc current between the outer contact, labeled as 3, and one of the inner contacts (the ground), see Fig. 1. It causes energy dissipation in the injector in the form of plasmons, non-equilibrium electrons or phonons. The other gate-gap junction serves as a detector: the energy can be absorbed here by stimulating inter-ES transitions, which would disturb the equilibrium in the detector junction. We monitor the ES potentials by high-impedance electrometers connected to the Ohmic contacts in Fig. 1.
In our setup with co-propagating ES, the normal magnetic field defines the propagation direction for the charged transport along the outer mesa edge. There are four possible experimental configurations, depicted in Fig. 1 (a)-(d), which are labeled by the magnetic field sign ( or ) and by the position (right or left) of the injector gate-gap junction.
The measurements are performed at a temperature of 30 mK. The obtained results for energy transport are independent of the cooling cycle, despite the carrier density differs slightly in different coolings. Standard two-point magnetoresistance is employed to determine the carrier density and to verify the contact quality. Magnetocapacitance measurements are used to find the available filling factors under the gate.
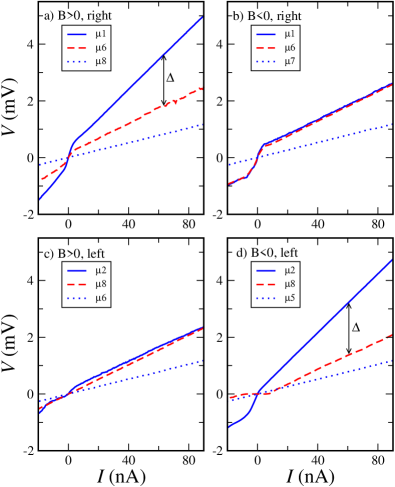
The potentials of different Ohmic contacts are shown in Fig. 2 for integer filling factors for all experimental configurations depicted in Fig. 1. The curves are obtained in a stationary regime, i.e. very slowly (about 3 hours per curve) to complete all the relaxation processes ESreview .
In the detector gate-gap junction, we indeed observe the equilibrium ES electrochemical potential distribution for two experimental configurations, see Fig 2 (b) and (c). The most surprising experimental finding is the fact that in two other cases there is a non-zero difference , see Fig. 2 (a) and (d). It occurs if the detector is situated upstream of the injector, cp. Fig. 1 (a) and (d). The effect is present for both signs of the applied current.
In our set-up, we not only know the direction of the electron drift in Fig 1, but can also obtain it from the experimental curves ESreview . If the contact within the injector is situated so that electrons reach it before the ground, its potential reflects the charge transfer across ES within the injector ESreview . Since we apply a current through the injector junction, we do find this potential to be linear and independent on the experimental configuration in a full current range, see Fig. 2 (blue dots). In contrast, the potentials of the outer contacts demonstrate a clear non-linear behavior, see Fig. 2, because they are sensitive to the transport regime within the injector (see ESreview and discussion below). Charge conservation for the injector junction demands an evident relation between electrochemical potentials ESreview , e.g. for () configuration or for () one for . Since the proper relation is indeed fulfilled for any experimental configuration, we are sure about the current distribution in the sample: the transport current only flows across the injector junction, while electrons drift from the contact 1 to the contact 2 for the field which we denote as positive .
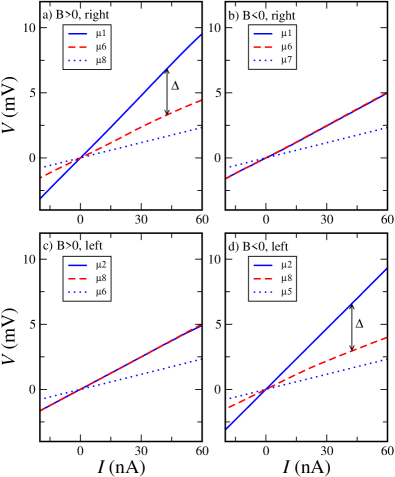
Similar results as those in Fig. 2 are obtained for other bulk fillings with , such as and . Furthermore, we observe the same effect also for transport across fractional . Fig. 3 demonstrates finite for the same two experimental configurations for . The curves are linear even around zero bias, because of the smaller equilibration length ESreview .
We can be sure that the detector is only connected with the injector through the edge. Zero in Fig. 2 (b,c) excludes a parasitic connection through the bulk, which would produce positive of the same order for all four experimental configurations. A similar effect would be produced by a parasitic ground within the detector region appendix . Fig. 3 also confirms the observed effect for an order of magnitude smaller detector resistance .

Since there is no parasitic connection between the injector and the detector, a finite in a stationary regime implies that the equilibrium is dynamic within the detector junction notthoff . The ’forward’ inter-ES transitions, which tend to equilibrate ES, should be compensated by counter ’backward’ ones. The necessary for electron spin flip is easily provided by spin-orbit coupling mueller or by the flip-flop process ESreview , but the energy for backward transitions can only be transferred from the injector. Thus, Figs. 2,3 demonstrate an energy transfer at the edge, which propagates counter to the electron drift.
This upstream energy transfer can only be provided by neutral excitations such as non-equilibrium phonons or neutral collective modes. To distinguish between these two, we start from the transport regimes ESreview across the injector gate-gap junction for integer :
(i) Low imbalance: Here, the ES electrochemical potential imbalance is much smaller than the energy gap in the incompressible strip, see Fig 4 (a). This regime corresponds to a high-resistance observed for small in Fig. 2. Two gate-gap junctions have different resistances because of their different real widths .
(ii) High imbalance: When the electrochemical potential difference reaches the spectral gap (Fig. 4 (b)), electrons can overflow the initial potential barrier, see Fig. 4 (c), so the junction resistance is diminished. Some electrons are transferred elastically with farther relaxation outside the gate-gap junction, while others loss their energy within the junction. This regime corresponds to the linear behavior of and in Fig. 2 at high currents.
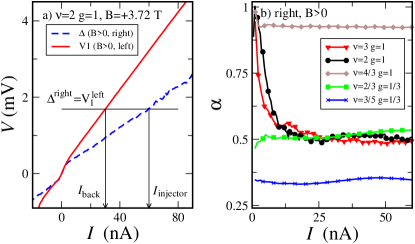
To describe the efficiency for energy transfer, we define the ratio between the ’backward’ current in the detector and the ’forward’ current in the injector. can be obtained from the measured using the non-linear resistance of the detector gate-gap junction. This resistance is solely determined by the ES structure and the gate-gap width, so it can be obtained from the ES imbalance in the injector in a symmetric configuration. We therefore determine as depicted in Fig. 5 (a). It is worth mentioning, that both curves in Fig. 5 (a) change their slopes at the same voltage, in contrast to, e.g., Fig. 2 (a). This is an additional argument that originates from the non-linear resistance of the detector junction.
A value of at low imbalances indicates a low dissipation of energy between the injector and the detector. If the transfer mechanism is the same, at high imbalances should reflect a part of non-elastic inter-ES transitions in the injector, which is confirmed by data in Fig. 5 (b). The data coincide for the filling factors and since the involved ES are separated by the same . Much higher for reflects the fact that efficient elastic transitions are not reachable for the bulk highfrac . For (at and 3/5) is practically independent of the injector current, but differs in a value possibly because of different structure of the bulk ground state. In this regime the linearity of the curves in Fig. 3 confirms ESreview the presence of the gap at , and therefore non-elastic transitions in the injector.
It is very unlikely, that all phonons emitted in the injector at low imbalances would be absorbed in the detector, resulting in . In contrast, collective modes are propagating along the edge, they are characterized by low dissipation, and their dispersion allows to transfer an appropriate energy wen ; rosenow ; kane . In our set-up it is a dipole (neutral) collective excitation which is created by an intra-edge electron transition across the incompressible strip, see Fig. 4 (c). The neutral mode can propagate upstream along the low-density edge of the incompressible strip if the density profile is reconstructed at the edge yang .
In summary, we experimentally observe an upstream energy transfer with respect to the electron drift for the filling factors 1 and 1/3, which seems to be provided by the neutral collective mode at the reconstructed sample edge yang . The excitation of this mode is especially efficient in the overflowing process depicted in Fig. 4 (c), so the regime of high imbalance opens a direct access to the neutral mode. This is the keynote difference of the present experiment from Ref. granger , where a weak electron tunneling to the QH edge should mostly excite a fundamental (charged) mode.
We wish to thank V.T. Dolgopolov, D.E. Feldman, D.G. Polyakov, D. A. Bagrets, and B. I. Halperin for fruitful discussions. We gratefully acknowledge financial support by the RFBR, RAS, the Program “The State Support of Leading Scientific Schools”.
References
- (1) Xiao-Gang Wen, Phys. Rev. B 41, 12838 (1990).
- (2) C. L. Kane, M. P. A. Fisher, and Polchinski, Phys. Rev. Lett. 72, 4129 (1994); D. E. Feldman, F. Li, Phys. Rev. B 78, 161304-161307 (2008); E. Grosfeld, S. Das, Phys. Rev. Lett. 102, 106403 (2009); B. Rosenow and B. I. Halperin, Phys. Rev. B 81, 165313 (2010).
- (3) G. Granger, J. P. Eisenstein, J. L. Reno, Phys. Rev. Lett. 102, 086803 (2009).
- (4) Aveek Bid, Nissim Ofek, Hiroyuki Inoue, Moty Heiblum, Charles Kane, Vladimir Umansky, Diana Mahalu, Nature 466, 585, (2010).
- (5) Xin Wan, E. H. Rezayi, and Kun Yang, Phys. Rev. B 68, 125307 (2003); C. d. C. Chamon and X. G. Wen, Phys. Rev. B 49, 8227 (1994).
- (6) J. P. Eisenstein, L. N. Pfeiffer, and K. W. West, Phys. Rev. Lett. 68, 674 (1992).
- (7) S. Takei, M. Milletarì, and B. Rosenow, Phys. Rev. B 82, 041306(R) (2010).
- (8) M. Büttiker, Phys. Rev. B 38, 9375 (1988).
- (9) D. B. Chklovskii, B. I. Shklovskii, and L. I. Glazman, Phys. Rev. B 46, 4026 (1992).
- (10) A. Würtz, et. al., Phys. Rev. B 65, 075303 (2002). For a review see E. V. Deviatov, A Lorke, phys. stat. sol. (b) 245, 366 (2008).
- (11) G. Müller, et. al., Phys. Rev. B 45, 3932 (1992).
- (12) Even an unbelievable mistake in relative positions of the gate-gap regions would result in antisymmetric with respect to the magnetic field sign.
- (13) C. Notthoff, K. Rachor, D. Heitmann, and A. Lorke, Phys. Rev. B 80, 205320 (2009).
- (14) E. V. Deviatov, A. Lorke, and W. Wegscheider, Phys. Rev. B 78, 035310 (2008).