Surprising lack of magnetism in the conductance channels of Pt atomic chains
Abstract
Pt is known to show spontaneous formation of chains of metal atoms upon breaking a metallic contact. From model calculations these have been predicted to be spin polarized, which is reasonable in view of the Stoner enhanced susceptibility of bulk Pt and the increased density of states due to the reduced dimensionality. Here, we demonstrate that shot noise reveals information on the magnetic state of Pt atomic chains. Against all predictions, we find clear evidence for a non-magnetic ground state for the conductance channels of Pt atomic chains.
pacs:
73.40.Jn, 72.70+m, 73.63.Nm, 61.46.KmAt nanometer size scales one often finds unexpected behavior of matter. A particularly appealing example is the spontaneous formation of chains of metal atoms upon breaking a metallic contact yanson98 ; ohnishi98 . Pt is a metal with a modestly Stoner-enhanced magnetic susceptibility, indicating proximity to a ferromagnetic state. A transition to ferromagnetism can be induced by reducing dimensions, as evidenced by recent work on Pt clusters liu06 . For these reasons, the ferromagnetic order predicted from model calculations for atomic chains delin03 ; fernandez05 ; smogunov08 ; smogunov08a ; thiess09 was not fully unexpected. Experimentally, it is very hard to design a probe that can directly measure the magnetism of atomic chains. Here, we demonstrate that shot noise, the intrinsic noise due to the discrete character of the electronic charge, reveals information on the magnetic state of Pt atomic chains. We find clear evidence for a non-magnetic ground state of the conductance channels for Pt atomic chains.
Shot noise was first discussed for vacuum diodes by Schottky schottky18 , who showed that this current noise is independent of frequency (white noise) up to very high frequencies, and its power spectrum has a value of , with the absolute value of the electron charge, and the average current. In nanoscale conductors, for which the system size is much smaller than the electron scattering length, this noise can be understood as partition noise. In these systems the number of transmission channels available for electrons to cross a conductor is limited and the transmission through each one of the channels is set by the properties of the conductor. When the transmission probability is smaller than 1 the conductor can be viewed as an effective bottleneck causing a random sequence of electron backscattering events, which is observed as current fluctuations or noise. The theory has been elaborated by several groups and has been thoroughly reviewed by Blanter and Büttiker blanter00 . For a nanoscale conductor with conductance channels, each characterized by a transmission probability , the current noise power at an applied bias voltage is given by,
| (1) |
where is Boltzmann’s constant, and is the temperature of the nanoscale conductor. Anticipating spin splitting of the conductance channels we treat conductance channels for each spin direction separately. In equilibrium (at ) equation (1) reduces to the Johnson-Nyquist thermal noise, , describing the current fluctuations that are driven only by the thermal motion of electrons. is the conductance. Again, in the expression for we take the conductance quantum as and sum over spin states. In the low-temperature limit, , equation (1) reduces to , where the Fano factor measures the quantum suppression of Schottky’s classical result,
| (2) |
From this analysis it is apparent that one may obtain information on the transmission probabilities of the conductance channels by measurement of the noise power, and in favorable cases it is even possible to determine the number of conductance channels brom99 . The Fano factor reduces to zero when all conductance channels are either fully blocked (), or fully open (). For a nanowire with a given conductance the noise has a lower bound that is obtained by taking all open channels to have perfect transmission, except for one that takes the remaining fraction of the conductance. This minimum will sensitively depend on whether the spin channels are restricted to be degenerate. It is this property that we exploit when investigating the magnetic state of Pt atomic chains.

Platinum atomic junctions were formed at liquid helium temperatures using mechanically controllable break junctions (MCBJ, for more details see Refs. djukic06 ; agrait03 ; suppl . The electronic circuit for the measurement is shown schematically in Fig 1. The Pt contact was first characterized by recording a conductance histogram smit01 ; suppl . The conductance histogram shows a first peak at a conductance of about ) with very few conductance counts below , as expected for clean Pt point contacts: Pt being an s-d metal has up to 12 conductance channels due to the six s and d orbitals, and spin. Each of the channels has a finite transmission probability and they sum up to a total of about ), in agreement with calculations nielsen02 ; vega04 ; fernandez05 ; smogunov08 . The strong peak at ) reflects the frequent formation of atomic chains in the contact. Chain formation can be demonstrated more explicitly by recording a histogram of the length of the conductance plateaux with conductances in the range of the first conductance peak, between 1.2 and 2 times () yanson98 ; smit01 ; untiedt02 ; suppl .
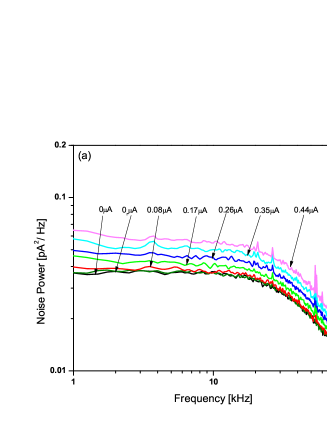
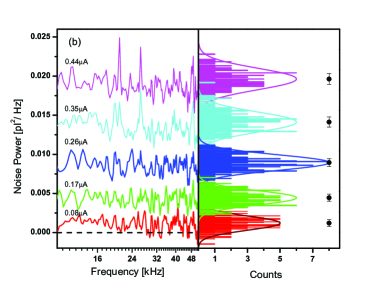
After this preliminary characterization of the junction an atomic chain was made by pulling, starting from a large contact until the conductance drops to a value near ). Measurements of conductance and noise were taken at several points of subsequent stretching starting from here. The corresponding piezo voltages were recorded in order to identify the length in terms of the mean number of atoms forming the chain. The zero-bias differential conductance, , was recorded, which is needed in combination with the noise for the analysis of the conductance channels. The accuracy of the ac conductance measurement is better than 1%, as verified by tests on standard resistors. Fig. 2 shows an example of noise spectra taken in the window from 1kHz to 100kHz for a series of current settings, and illustrates how the noise power is obtained from the data. First, the thermal noise is recorded at zero bias, and after taking noise spectra at several bias settings the zero bias noise is recorded once more (labelled as ) in order to verify that the junction has remained stable. The low-frequency upturn at larger currents is due to 1/f-like noise. At high frequencies there is a roll-off due to the transfer characteristics of the circuit. The thermal noise level corresponds to a temperature of 6.3 K, which agrees within the accuracy of the temperature measurement with a reading of 6.1 K, as obtained from a ruthenium oxide 10k resistance thermometer. For several junction settings conductance measurements were repeated after the shot noise bias sequence in order to detect possible changes in the conductance. Typical changes observed were smaller than 2%. Fig. 2(b) shows that the spectra become white above 10kHz after correction for the roll-off with a single RC time constant. The thermal noise (at zero bias) is subtracted, which explains the negative values in the data fluctuations for the lowest currents. The data points are projected in the form of a histogram, shown at the right, and the level of white noise is obtained from the center of the histogram for each voltage bias. The bullets and error bars at the right indicate the position and accuracy of the noise power as determined from a gaussian fit to the histograms.
Since shot noise and thermal noise are of comparable magnitude in these experiments it is useful to represent the data such that the expected dependence on the applied bias in Eq. (1) is apparent. The voltage dependence in Eq. (1) can be lumped into a single variable that we take to be , with . The reduced excess noise is then defined as,
| (3) |
where is the noise at finite bias, and is the thermal noise, at zero bias. The reduced excess noise is now expected to depend linearly on the control parameter, , from which the Fano factor can be easily obtained.
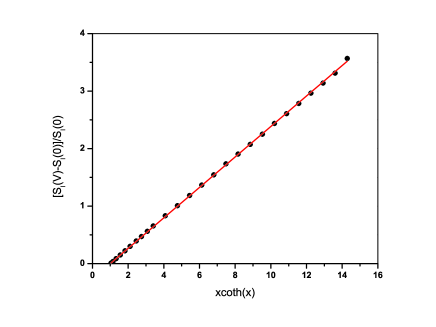
Figure 3 shows a series of measurements on a Pt atomic chain with a conductance of at a short length of 2 atoms in the chain, for 26 settings of the bias voltage in the range from 0mV to 16.6mV (0 to 1.83). The slope of the plot gives a Fano factor . The accuracy for each of the points is 3%, as obtained by a fit to the power spectrum after correction for the roll-off as in Fig. 2. The measurement required about 50 minutes, illustrating the long-term stability of the atomic chains. It shows a very nice agreement with the expected dependence, and the scatter around the linear slope is within the data point accuracy.
We have recorded similar plots for over 500 configurations of Pt atomic chains of various length, for which we took 7 bias voltage points between 0 and 0.44A. When the scatter in the plot of the reduced excess noise was larger than 3%, or the thermal noise at start and end of the measurement differed by more than 2%, we rejected the data. The scatter is mostly due to a large component in the noise spectrum and the contribution of the residual amplifier noise correlations to the spectra. After this selection 119 configurations remain. Figure 4 shows the Fano factors determined from these 119 sets of shot noise measurements.
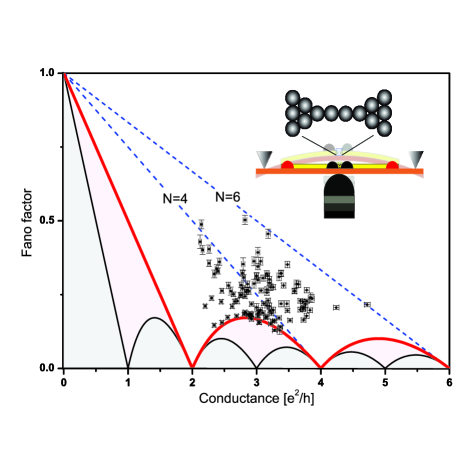
The bold red curve shows the minimum noise curve when spin degeneracy is imposed. Relaxing spin degeneracy results in a minimum noise curve shown by the thin black curve. The blue broken lines show the maximum noise that can be obtained with or (spin) channels. This maximum is obtained by taking all channels to have the same transmission probability , leading to . The measured data points form a diffuse cloud in -space, with its centre of mass near and a spread in the conductance in agreement with the position and width of the first peak in the conductance histogram. A large fraction of the points lie above the line labelled , which represents the maximum Fano factor when only four channels are available. This shows that these Pt atomic chains have at least five conductance channels, in agreement with calculations nielsen02 ; fernandez05 ; smogunov08 . The points below the blue broken line can be explained by four channels, but for the majority of points the only conclusion we can draw is that at least four channels are involved.
The most striking observation, and the central point of this Letter, is that all Fano factors for the Pt chain configurations fall on, or well above, the curve describing the minimum noise for spin-degenerate channels. More than 15% of the measured points are even found to coincide within the error bars with the minimum-Fano curve for spin-degenerate channels, and none of the points are found significantly below it. For spin-split conductance channels the limiting curve is represented by the thin curve in Fig. 4 roche04 ; dicarlo06 . This provides strong evidence that the conductance channels in the Pt atomic chains formed in the experiment are spin degenerate, at variance with results from DFT calculations delin03 ; fernandez05 ; smogunov08 ; smogunov08a ; thiess09 . Most points in Fig. 4 are measured for Pt chains of 3 to 4 atoms in length, occasionally 5 or 6 atoms. We do not find any systematic evolution of the Fano factor with stretching of the chain. While increasing the length of the chain in steps the Fano factor may be seen to jump towards the minimum noise curve, but then it jumps away from the curve to higher values at next steps in increasing the chain length (see suppl ).
A second remarkable observation is the fact that there is a group of 18 points that coincide with the curve describing the minimum noise power for spin-degenerate channels. This is quite unexpected. Whether spin degenerate or spin polarized, all calculations predict that at least six spin channels are involved, and no mechanism is known that would lead to unit transmission for the dominant channels nielsen02 ; vega04 ; fernandez05 ; smogunov08 . The most complete calculations smogunov08 , fully relativistic Density Functional Theory for realistic chain sizes, show that a magnetic moment above 0.4B per atom already appears for a chain only three atoms in length, at equilibrium interatomic distance.
It has been argued calvo09 ; untiedt10 that the zero bias anomalies observed in the differential conductance for Pt atomic chains provide evidence for local magnetic order. Indeed, the differential conductance often shows a pronounced structure near (see suppl . However, this structure is very irregular and may have any sign or structure, which hampers a straight-forward interpretation. If any magnetic order is present for a consistent interpretation we would have to assume such moments would be formed by states that do not participate in the conductance.
In conclusion, we find strong evidence for an absence of magnetic order in the conductance channels for Pt atomic chains. The fact that this observation disagrees with many DFT-based computations suggests that effects beyond the present models, such as electron-electron correlations, may need to be considered.
Acknowledgements.
This work is part of the research programme of the Foundation for Fundamental Research on Matter (FOM), which is financially supported by the Netherlands Organisation for Scientific Research (NWO).References
- (1) A.I. Yanson, G. Rubio Bollinger, H.E. van den Brom, N. Agraït, and J.M. van Ruitenbeek, Nature 395, 783 (1998).
- (2) H. Ohnishi, Y. Kondo, and K. Takayanagi, Nature 395, 780 (1998).
- (3) X. Liu, M. Bauer, H. Bertagnolli, E. Roduner, J. van Slageren, and F. Phillipp, Phys. Rev. Lett. 97, 253401 (2006).
- (4) A. Delin, and E. Tosatti, Phys. Rev. B 68, 144434 (2003).
- (5) J. Fernández-Rossier, D. Jacob, C. Untiedt, and J.J. Palacios, Phys. Rev. B 72, 224418 (2005).
- (6) A. Smogunov, A.D. Corso, and E. Tosatti, Phys. Rev. B 78, 014423 (2008).
- (7) A. Smogunov, A.D. Corso, A. Delin, R. Weht, and E. Tosatti, Nature Nanotechnology 3, 22 (2008).
- (8) A. Thiess, Y. Mokrousov, S. Heinze, and S. Blügel, Phys. Rev. Lett. 103, 217201 (2009).
- (9) W. Schottky, Ann. Phys. (Leipzig) 57, 541 (1918).
- (10) Y.M. Blanter, and M. Büttiker, Phys. Rep. 336, 2 (2000).
- (11) H.E. van den Brom, and J.M. van Ruitenbeek, Phys. Rev. Lett. 82, 1526 (1999).
- (12) D. Djukic, and J.M. van Ruitenbeek, Nano Letters 6, 789 (2006).
- (13) See supplementary information at Electronic Physics Auxiliary Publication Service (EPAPS) http://www.aip.org/pubservs/epaps.html
- (14) N. Agraït, A. Levy Yeyati, and J.M. van Ruitenbeek, Phys. Rep. 377, 81 (2003).
- (15) R.H.M. Smit, C. Untiedt, A.I. Yanson, and J.M. van Ruitenbeek, Phys. Rev. Lett. 87, 266102 (2001).
- (16) S.K. Nielsen, et al. Phys. Rev. Lett. 89, 066804 (2002).
- (17) L. de la Vega, L., A. Martín-Rodero, A. Levy Yeyati, and A. Saúl, Phys. Rev. B 70, 113107 (2004).
- (18) C. Untiedt, et al. Phys. Rev. B 66, 85418 (2002).
- (19) P. Roche, et al. Phys. Rev. Lett. 93, 116602 (2004).
- (20) L. DiCarlo, et al. Phys. Rev. Lett. 97, 036810 (2006).
- (21) M.R. Calvo, J. Fern’andez-Rossier, J.J. Palacios, D. Jacob, D. Natelson, and C. Untiedt, Nature 458, 1150 (2009).
- (22) C. Untiedt, private communications.