Crystal phases of two dimensional assembly of triblock Janus particles
Abstract
Recent experimental work on spherical colloidal particles decorated with two hydrophobic poles separated by an electrically–charged middle band (triblock Janus particles) has documented self–assembly into a Kagome two–dimensional lattice, when particles are confined by gravity at the bottom of the sample holder [Q. Chen et. al., Nature, in press]. Here we assess the ability of a previously proposed simple two–patch effective potential to reproduce the experimental findings. We show that the effective potential is able to reproduce the observed crystallization pathway in the Kagome structure. Based on free energy calculations, we also show that the Kagome lattice is stable at low temperatures and low pressure, but that it transforms into a hexagonal lattice with alternating attractive and repulsive bands on increasing pressure.
Chemical or physical patterning the surface of particles provides an effective way of modulating the interaction between colloidal particles. The possibility of designing particles that interact via a non–spherical potential opens up a wealth of new possibilities as envisioned in the anisotropy axis space by Glotzer and Solomon Glo07a . The challenge faced by physicists, chemical engineers and material scientists is thus to organize these new geometries into structures for functional materials and devices via self–assembly, the spontaneous organization of matter into desired arrangements. The aim is to achieve — via the rational design of elementary building blocks (i.e. the particles) — pre–defined specific, ordered or disordered, structures. Research in this direction is very active Paw10a , even though most of the experimental efforts are still in the direction of acquiring control over the desired distribution of patch widths and number Manoh_03 ; mohwald ; kegel , more than on the collective behavior of the particle themselves (with noteworthy exceptions Glo06a ; oldgranick1 ; oldgranick2 ; gangnature1 ). Self–assembly of patchy particles has been the focus of a large number of theoretical and numerical investigations Glo07a ; bianchiprl ; Hui08a ; Cac06a ; doyepccp ; Rom09a ; Rom10a ; doye1 ; doye2 , which have revealed a wealth of novel physical phenomena, some of which having an analogous counterpart in atomic or molecular systems fsepjb ; russoprl .
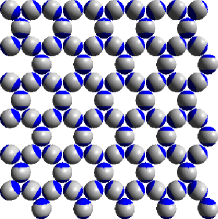
A very recent experimental work based on spherical colloidal particles decorated with two hydrophobic poles of tunable area, separated by an electrically charged middle band (triblock Janus) granicknature provides an excellent example of accurate synthesis of two–patch particles accompanied by a study of the self–assembly of these particles into an ordered structure when deposited on a flat surface. Interestingly, the electric charge of the particles allows for a controlled switch of the interaction via addition of salt, which effectively screens the overall repulsion, offering the possibility to the hydrophobic attraction between patches to express itself. After the addition of the salt, particles organize themselves into a Kagome lattice. The crystallization kinetics can be followed in real space in full details. The width of the patches, of the order of 65 degrees, allows for simultaneous bonding of two particles per patch, stabilizing the locally four–coordinated structure of the Kagome lattice (see Fig. 1). Experiments also show that, when more than one layer of particles sediment, stacked Kagome planes form. As discussed in Ref. granicknature , such alternating Kagome planes could have potential application as selective filters, where selection is potentially controlled by the two different typical sizes of the basic Kagome structure (the triangle and the hexagon) as well as by the different chemical characters of the two holes (hydrophilic and hydrophobic).
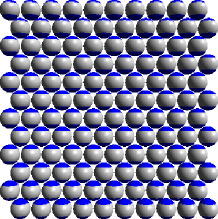
The three–dimensional collective behavior of two–patch particles, modeled via the Kern–Frenkel potential Ker03a , has been studied recently giacometti2 as a function of the patch width, interpolating between the isotropic case, when each patch covers one hemisphere, and the case where each of the two opposite patches can be involved only in one bond, generating a polydisperse distribution of colloidal chains (equilibrium polymers). In the range of angular patch width compatible with only two bonds per patch (the same as the experimental system alluded before), the spontaneous formation of an ordered phase in a fully bonded closely–packed hexagonal lattice with alternating attractive bands (see Fig. 1) was reported. While gravitational effects do not allow a close comparison between experiments and simulations in three dimensions, a theoretical study of the phase diagram of the same model in two dimensions — but retaining the full three–dimensional orientational properties — can provide a valuable test for validating the effective potential as well as for estimating the relative stability field of the possible crystals and of the fluid phase.
In this Letter we study the phase diagram of the two–patch Kern–Frenkel model in two dimensions, for two different values of the patch width, both within the angular width interval that allows for at most two bonds per patch. In full agreement with the experiments, we observe, at comparable pressure and interaction strength, the spontaneous nucleation of Kagome lattice. At larger pressure, spontaneous crystal formation in the dense hexagonal structure is observed. Such easiness to crystallize suggests that in this system crystallization barriers are comparable to the thermal energy at all pressures. Interestingly enough, we find that for this model a (metastable) gas–liquid phase separation can be observed for large patch width.
We study the Kern–Frenkel Ker03a two–patch model where two attractive patches are symmetrically arranged as polar caps on a hard sphere of diameter . Each patch can thus be envisioned as the intersection of the sphere surface with a a cone of semi–amplitude and vertex at the center of the sphere. The model assumes that a bond (with interaction energy ) is established between two particles when their center–to–center distance is less than and the line connecting their centers crosses two arbitrary patches on distinct particles. Reduced units will be used throughout this work, with , temperature in units of , pressure in units of and number density in units of . A precise definition of the model can be found in Ref. Ker03a and in the Supplemetary Informations. The model has been extensively investigated in simulation and theoretical studies of patchy particles Ker03a ; foffi ; giacometti2 ; Giacometti09b ; Liu07a , including integral equation giacometti2 ; Giacometti09b as well as perturbation theories gogelein for anisotropic potentials. Here we focus on the short-range value (comparable to the experimental value) and two values of the patch width: the experimental values and the largest value consistent with the two-bond-per-patch condition, .
The phase diagrams have been calculated following the methodologies reviewed in Ref. vega-review . Specifically, we have calculated the free energy of crystal phases via thermodynamic integration from the Einstein crystal frenkel-ladd , and the free energy of fluid phase via thermodynamic integration from the ideal gas. With these techniques, precise estimates of the chemical potential of the crystal and of the fluid phase can be obtained. The Gibbs–Duhem integration Kofke is then implemented to compute the coexistence line in the pressure-temperature plane. Consistency checks based on direct coexistence Ladd77a have been performed to validate the results of our free energy calculations. The gas–liquid critical point and coexistence densities have been calculated implementing the successive umbrella sampling method sus . We remand to the Supplementary Informations for technical details regarding free energy calculations.
We also perform NPT and NVT Monte Carlo (MC) simulations of a system of 1000 particles for several values of and to gather structural information and to study spontaneous crystallization. MC simulation runs were carried out for at least MC cycles, a third of which were used for equilibration. The translational, rotational and volume trial displacements were calibrated during equilibration to have a global acceptance ratio of 0.5, 0.5 and 0.25 respectively.
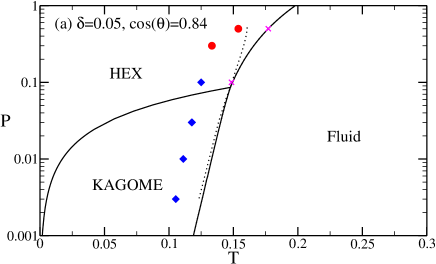
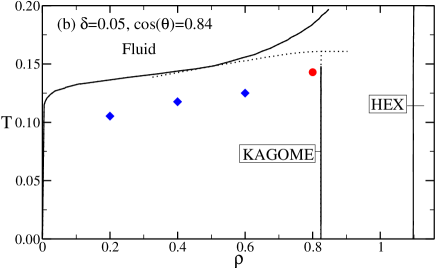
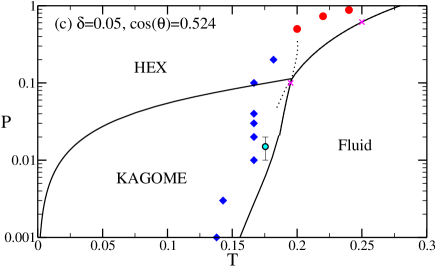
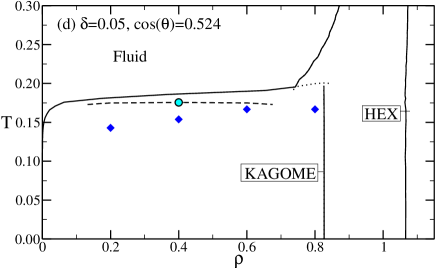
Fig. 2 shows the phase diagram for the two investigated values of . In the investigated range of and , two fully bonded crystals can be predicted to possibly form: the Kagome and the hexagonal lattices (see Fig. 1). The open Kagome structure is stable at low , while the dense hexagonal one at larger values. At large a fluid phase is stable. We note that on increasing beyond the range reported in Fig. 2 , other crystal phases appear, including a plastic hexagonal phase and a dense polymeric phase. The topology of the phase diagram is essentially identical, with the coexistence lines shifted to higher and higher for the larger width, as expected on the basis of the larger bonding volume (which correspondingly reflects a larger virial coefficient). In agreement with the experimental system, the Kagome structure becomes stable when the patch–patch interaction strength becomes five to ten times the thermal energy, a range of values at which bonds can still be thermally broken providing an effective way to escape kinetic traps and accurately sample the phase space.
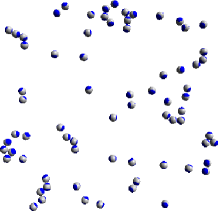
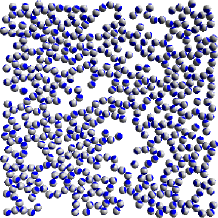
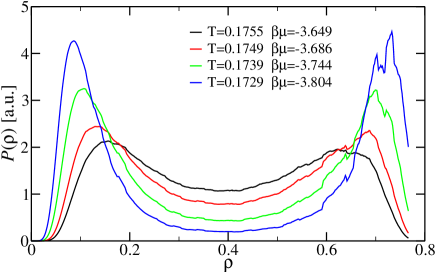
To test if the fluid phase undergoes a gas–liquid phase separation at low , we investigated the behavior of the density fluctuations. Fig. 3 shows that the distribution of the density in the grand canonical (constant volume, and chemical potential ) ensemble sus acquires the typical bimodal shape characteristic of coexisting gas-like and liquid-like regions which characterize the system close to criticality. Typical gas configurations are characterized by isolated clusters, while liquid-like configurations show a percolating network of bonds, with a large fraction of loops of different size (see Fig. 1). The critical point is slightly metastable (see Fig. 2). As noticed in Ref. giacometti2 , the progressive restriction of the bonding angle plays a role analogous to the reduction of the range in spherically interacting attractive colloids Vli00a . Indeed, critical fluctuations can only be observed for the large angular width model. In the case of the small angular width (), the possibility of observing the phase separation is preempted by crystallization. In this small width case, crystal formation is so effective that there is no time for establishing a time–independent metastable liquid state and properly evaluate the density fluctuations. A proper choice of the patch width and interaction range in the experimental system, in which particles can be optically tracked, could thus provide a way of directly observing critical fluctuations in a two–dimensional system in real space.
Fig. 2 also shows the points where spontaneous crystal formation in one of the two crystal forms is observed during a constant– simulation. Interestingly, around , the Kagome crystal develops (as a metastable form) in the region of stability of the denser crystal, consistently with the Ostwald’s rule Ostwald which states that in general it is the least stable polymorph that crystallizes first. In the present case the difference in chemical potential between the hexagonal lattice and the Kagome lattice is only of the order of 0.03 at and hence can not really control the preferential crystallization in the less stable lattice structure. We suggest that the preferential formation of the Kagome structure at is the result of the fluid having a density closer to that of the Kagome lattice than that of the denser lattice.
More relevant for colloidal applications is the phase diagram in the plane. The Kagome structure is stable in a small density window. For the studied model, the Kagome structure can exist only for . In the last inequality, the upper value is controlled by excluded volume, while the lower figure is controlled by the range of the interaction potential.
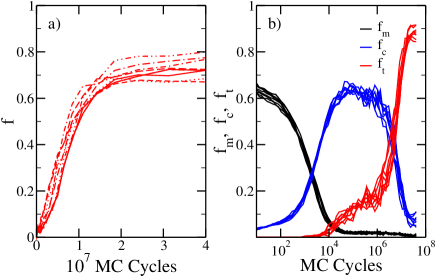
The crystallization kinetics of triblock Janus particles has also been investigated experimentally, by optical microscopy, providing a detailed description of the formation of the Kagome lattice. To provide evidence that the Kern-Frenkel potential is able not only to reproduce the thermodynamic properties, but also the crystallization pathway, we report in Fig. 4 the time evolution of the fraction of crystalline particles as well as the time dependence of the concentration of particular geometrical arrangements of the particles. Specifically, we focus (following Ref. granicknature ) on particles in chains, particles forming triangular bond loops (the unit element of the Kagome lattice), and un-bonded particles. As time grows, the number of un-bonded isolated particles decreases in favor of the formation of chains of oppositely bonded particles which then restructure themselves to form the triangular elements of the ordered lattice. A movie of the crystallization process is available in the Supplementary Informations. Comparing Fig. 4 with Fig. 2 and 3 of Ref. granicknature one sees that indeed the effective potential properly describes the kinetics of crystal formation.
To summarize, particles made by a repulsive core and attractive patches are clearly one of the most promising model systems for generating, via a rational design granicknature , specific structures. The versatility of the method has been already proved for one and two-patch particles, revealing in both cases interesting assembly processes. In the case of one patch, particles aggregates in micelle or in branched linear clusters oldgranick1 ; oldgranick2 . Interestingly, also in the one-patch case, the simple Kern–Frenkel potential has been shown to properly reproduce the experimentally observed structures janusprl . The ability of accurately describing Janus triblock particles with the same model, by only changing the geometry of the patches as in the experimental system, is particularly rewarding and provides a strong support for the use of such model for predicting the self–assembly properties of this class of patchy colloids. The possibility of numerically exploring the sensitivity of the phase diagram to the parameters (patch width and interaction range) entering in the interaction potential provides an important instrument and a guide to the design of these new particles to obtain specif structures by self–assembly.
It is interesting to observe the analogies between the two–dimensional phase diagram of these two–patch two–bonds particles with the three–dimensional phase diagram of tetrahedral particles in which each patch can be only engaged in one bond Rom09a ; Rom10a . In both cases, the phase diagram is characterized by the competition between an open (diamond in 3D, Kagome in 2D) crystal and a denser one (BCC in 3D, hexagonal in 2D). In both cases, smaller angular patches favors crystal formation, completely pre–empting the possibility of forming a metastable liquid state. In both cases, the propensity for crystallization arises from a significant difference in the slope of vs at the melting temperature.
In this contribution we have focused on the two–dimensional phase diagram, showing that the open Kagome structure is stable at low and . An accurate study based on the comparison of the free energy of the different crystal forms of the corresponding three–dimensional system has not been performed so far. Hence, it is not clear if the Kagome structure would still self–assemble even if the system were not confined by gravity on a surface. After the validation of the model reported here, theoretical evaluation can help answering this important question.
I Acknolwdgements
We thank S. Granick for sending us a pre–print of Ref. granicknature prior to publication and C. De Michele for providing us with the program with which the graphic representations were made. We acknowledge support from ERC-226207-PATCHYCOLLOIDS and ITN-234810-COMPLOIDS.
References
- (1) S. C. Glotzer and M. J. Solomon, Nat. Mater. 6, 557 (2007)
- (2) A. B. Pawar and I. Kretzschmar, Macromol. Rapid Comm. 31, 150 (2010)
- (3) V. N. Manoharan, M. T. Elsesser, and D. J. Pine, Science 301, 483 (2003)
- (4) G. Zhang, D. Wang, and H. Möhwald, Angew. Chem. Int. Ed. 44, 7767 (2005)
- (5) D. J. Kraft, J. Groenewold, and W. K. Kegel, Soft Matter 5, 3823 (2009)
- (6) Z. Tang, Z. Zhang, Y. Wang, S. C. Glotzer, and N. A. Kotov, Science 314, 274 (2006)
- (7) S. Jiang, Q. Chen, M. Tripathy, K. S. S. Erik Luijten, and S. Granick, Adv. Mater. 22, 1060 (2010)
- (8) L. Hong, A. Cacciuto, E. Luijten, and S. Granick, Langmuir 24, 621 (2008)
- (9) D. Nykypanchuk1, M. M. Maye, D. van der Lelie, and O. Gang, Nature 451, 549 (2008)
- (10) E. Bianchi, J. Largo, P. Tartaglia, E. Zaccarelli, and F. Sciortino, Phys. Rev. Lett. 97, 168301 (2006)
- (11) B. A. H. Huisman, P. G. Bolhuis, and A. Fasolino, Phys. Rev. Lett. 100, 188301 (May 2008)
- (12) A. Cacciuto and E. Luijten, Nano Lett. 6, 901 (2006)
- (13) J. P. K. Doye, A. A. Louis, I. Lin, L. R. Allen, E. G. Noya, A. W. Wilber, H. C. Kok, and R. Lyus, Phys. Chem. Chem. Phys. 9, 2197 (2007)
- (14) F. Romano, E. Sanz, and F. Sciortino, J. Phys. Chem. B 113, 15133 (2009)
- (15) F. Romano, E. Sanz, and F. Sciortino, J. Chem. Phys 132, 184501 (2010)
- (16) A. W. Wilber, J. P. K. Doye, and A. A. Louis, The Journal of Chemical Physics 131, 175101 (2009)
- (17) A. W. Wilber, J. P. K. Doye, A. A. Louis, and A. C. F. Lewis, The Journal of Chemical Physics 131, 175102 (2009)
- (18) F. Sciortino, Eur. Phys. J. B 64, 505 (2008)
- (19) J. Russo and F. Sciortino, Phys. Rev. Lett. 104, 195701 (2010)
- (20) Q. Chen, S. C. Bae, and S. Granick, in press(2010)
- (21) N. Kern and D. Frenkel, J. Chem. Phys. 118, 9882 (2003)
- (22) A. Giacometti, F. Lado, J. Largo, G. Pastore, and F. Sciortino, J. Chem. Phys. 132, 174110 (2010)
- (23) G. Foffi and F. Sciortino, J. Phys. Chem. B 33, 9702 (2007)
- (24) A. Giacometti, F. Lado, J. Largo, G. Pastore, and F. Sciortino, J. Chem. Phys. 131, 174114 (2009)
- (25) H. Liu, S. K. Kumar, and F. Sciortino, J. Chem. Phys. 127, 084902 (2007)
- (26) C. Gogelein, G. Nagele, R. Tuinier, T. Gibaud, A. Stradner, and P. Schurtenberger, J. Chem. Phys. 129, 085102 (2008)
- (27) C. Vega, E. Sanz, J. L. F. Abascal, and E. G. Noya, J. Phys.: Condens. Matter 20, 153101 (2008)
- (28) D. Frenkel and A. J. C. Ladd, J. Chem. Phys. 81, 3188 (1984)
- (29) D. A. Kofke, Mol. Phys. 78, 1331 (1993)
- (30) A. J. C. Ladd and L. Woodcock, Chem. Phys. Lett. 51, 155 (1977)
- (31) P. Virnau and M. Müller, J. Chem. Phys. 120, 10925 (2004)
- (32) G. A. Vliegenthart and H. N. W. Lekkerkerker, J. Chem. Phys. 112, 5364 (2000)
- (33) W. Ostwald, Z. Phys. Chem. 22, 289330 (1897)
- (34) F. Sciortino, A. Giacometti, and G. Pastore, Phys. Rev. Lett. 103, 237801 (2009)