Cavitating Langmuir Turbulence in the Terrestrial Aurora
Abstract
Langmuir cavitons have been artificially produced in the earth’s ionosphere, but evidence of naturally-occurring cavitation has been elusive. By measuring and modeling the spectra of electrostatic plasma modes, we show that natural cavitating, or strong, Langmuir turbulence does occur in the ionosphere, via a process in which a beam of auroral electrons drives Langmuir waves, which in turn produce cascading Langmuir and ion-acoustic excitations and cavitating Langmuir turbulence. The data presented here are the first direct evidence of cavitating Langmuir turbulence occurring naturally in any space or astrophysical plasma.
pacs:
94.05.Lk, 94.05.Pt, 94.05.Fg, 94.20.wjLangmuir turbulence is known to occur in controlled laboratory Wong and Cheung (1984); Vyacheslavov et al. (2002) and space plasma experiments Sulzer and Fejer (1994); Isham et al. (1999); Rietveld et al. (2000) and is thought to occur naturally in a variety of space and astrophysical plasmas, including pulsar magnetospheres Asseo and Porzio (2006), the solar corona Nulsen et al. (2007), the interplanetary medium Kellogg et al. (1992), planetary foreshocks Robinson and Cairns (1995), the terrestrial magnetosphere Stasiewicz et al. (1996), and the ionosphere Papadopoulos and Coffey (1974); Rowland et al. (1981); Guio and Forme (2006). In its most developed form, this turbulence contains electron Langmuir modes trapped in dynamic density depressions known as cavitons Robinson (1997); DuBois et al. (1991, 1993). Cavitons have been shown to be artificially produced in the earth’s ionosphere during high-power radiowave pumping experiments as deduced from radar spectra containing simultaneously-excited up and down-shifted Langmuir and ion-acoustic lines plus a central peak due to cavitation Sulzer and Fejer (1994); Isham et al. (1999); Rietveld et al. (2000), but evidence of naturally occurring cavitation has until now been elusive.
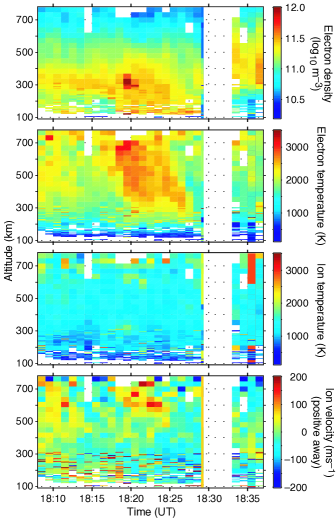
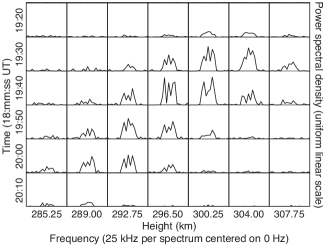
Between 18 and 21 UT on 11 and 12 November 1999 a measurement program designed to detect both ion-acoustic and Langmuir modes was run on the European Incoherent Scatter Scientific Association (EISCAT) 224-MHz radar located near Tromsø in northern Norway (local standard time in Norway is UT plus one hour). The principal objectives were to observe enhanced waves stimulated by high-power radiowave pumping, and, in the event of auroral activity, to gather data on natural energetic waves Rietveld et al. (2002). On both nights conditions were disturbed, and enhanced echoes were detected, the strongest being on 11 November between 18:18:30 and 18:21:30 UT, during the passage of an aurora through the vertically-directed radar beam. Fig. 1 presents parameters derived from the ion-acoustic backscatter between 18:15 and 18:28 UT, during the most intense auroral event. Fig. 2 shows the intensities of Langmuir and ion-acoustic backscatter as a function of height and time. The prominent features occurring between 18:18:30 and 18:20:30 UT and at 18:23:30 UT near 300 and 250 km altitude, respectively, are backscatter associated with the aurora, and are the most energetic natural events observed on either night. Two other events occurred later that evening and two more on the following evening. Weak ion-acoustic enhancements occurred during each event; the Langmuir enhancements, however, are always stronger. Fig. 3 shows up and down-shifted spectral lines, or “shoulders”, which are produced by Doppler-shifted backscatter from the down and up-going ion-acoustic waves, respectively. The shoulders are strongly enhanced indicating that the waves are nonlinearly amplified. In addition, there is a strong central peak, a feature not present in thermal-level spectra.

The results of a computation made for plasma parameters matching those which occurred during this observation are shown in Fig. 4. A numerical code incorporating a one-dimensional periodic version of the Zakharov equations was used Zakharov (1972); Guio and Forme (2006), capable of producing the full range of cascading (sometimes called weak), coexistence (transitional), and cavitating (strong) Langmuir turbulence. Energy was supplied by a downward-going flux, or beam, of electrons Williams et al. (2006), which excites a Langmuir “pump” wave via the bump-on-tail instability. In the cascading turbulence scenario Forme (1999), the Langmuir wave then undergoes parametric decay into daughter Langmuir and ion-acoustic waves. These waves however exist only within two relatively narrow bands of wave numbers: the Langmuir band defined by the driving beam (see caption to Fig. 4) and the ion-acoustic band at about twice that value. Furthermore, a radar sees only the wave number that matches the Bragg scattering condition for the radar wavelength. This means that, for beam-driven cascading turbulence, a radar will see either enhanced Langmuir waves or enhanced ion-acoustic waves, but both may be seen simultaneously only when the velocity spread of the beam is sufficiently broad, approaching the absolute velocity of the beam itself. Cavitating turbulence is different in that enhanced wave modes cover a range of space which extends broadly on both sides of the wave number of the pump wave irrespective of the beam velocity breadth. In the coexistence or transitional case the wave number spectrum extends below the pump wave number to zero, but dies out rapidly for Langmuir wave numbers greater than the Langmuir pump and for ion-acoustic wave numbers greater than twice the Langmuir pump.
In the simulations presented in Fig. 4 several different beam energies are modeled, each capable of producing cavitating turbulence, and the spectra are those which would be seen by a radar of the same wavelength as was used for the observations; however, the beam parameters were chosen so that the Langmuir and ion-acoustic wave numbers for cascading turbulence would not match that of the radar. The coincident enhancement in space and time of both ion-acoustic and Langmuir backscatter at a single radar wave number is a prediction characteristic of cavitating Langmuir turbulence, and constitutes critical evidence for its occurrence Robinson (1997); Guio and Forme (2006).

A second key feature of this observation lies in the shape of the ion-acoustic spectra, which consists of enhanced up and downshifted “shoulders” and an enhanced central peak, shown in Fig. 3. The observed spectra match the computed spectra in Fig. 4 very well. Enhanced shoulders are a standard feature of all past observations of naturally-enhanced ion-acoustic backscatter Sedgemore-Schulthess and St.-Maurice (2001), but only one past result shows an enhanced ion-acoustic spectrum with a central peak Forme et al. (1995). The appearance of the non-Doppler-shifted central peak indicates the presence of meter-scale, non-propagating density wells known as cavitons. A central peak is not a necessary feature of cavitating turbulence but will occur when the spacing between the cavitons matches the Bragg condition of the radar. The spacing, in turn, is roughly proportional to the inverse square root of the energy density of the primary Langmuir waves, or, in turn, of the pump beam (Shen and Nicholson, 1987; Guio and Forme, 2006). This is not likely to be seen in all observations, both because of the matching requirement and because a relatively high beam energy density is required, which is most likely to be observable using long wavelengths such as in the observations reported here and previously Forme et al. (1995).
Many other features of the observations may also be explained by the cavitating turbulence model. (1) Six events were observed, four on the 11th and two on the 12th, and both Langmuir and ion-acoustic enhancements exist in all cases, but in all events the ion-acoustic enhancement is weaker. This agrees with the computed examples. (2) The measured backscatter intensity in the down-going Langmuir channels is weaker than the up-going. Similar differences can be seen in the computed spectra. For the case of 18 eV, the radar sees down-going Langmuir modes at a wave number corresponding to the negative, or damping, slope of the velocity distribution function of the down-going beam, and heavy damping is seen. For wave numbers on the positive slope of the beam the opposite will occur. (3) In five of our cases the ion-acoustic enhancement disappears before, or at the same time as, the Langmuir enhancements (within the 10-s time resolution of the observations). However, in our strongest event, at 18:18:30 on the 11th, enhanced ion-acoustic backscatter is seen before and after the enhanced Langmuir backscatter. In this case it is possible that the turbulence develops from coexistence to cavitating and back again as the driving beam grows and then decays. In the coexistence regime Langmuir mode wavenumbers are cut off at a value roughly half that of the ion-acoustic mode, so the radar may see only the ion-acoustic enhancement until the cavitating turbulence is fully developed. A strong event would also cause greater electron heating, reducing damping of ion-acoustic modes and contributing to a longer ion-acoustic enhancement. (4) The relationship between beam energy and ion-acoustic damping can also account for the relatively strong ion-acoustic enhancement after 18:20:00 UT: the electrons had been heated during the event and the ion-acoustic damping rate reduced, allowing the ion-acoustic backscatter to remain strong even as the drive began to weaken.
A significant feature in the computed Langmuir spectrum at 170 eV, and very weakly at 42 and 75 eV, is the appearance of a broad spectrum at and near the cold plasma frequency. This feature, which is not resolvable in the radar measurements presented here, is due to Langmuir waves trapped in cavitons. It appears after a sufficient period of pumping at a sufficiently high level. The central peak and the broad spectrum, both due to cavitation, may be seen under somewhat different circumstances: The central peak requires a beam energy density that allows the caviton spacing to match the radar Bragg condition, while the broad spectrum requires a fixed electron density with a beam velocity high enough and beam duration long enough to allow formation of trapped Langmuir waves matching the radar Bragg condition. Both are seen in high-power radiowave experiments Rietveld et al. (2000), in which a fixed pump frequency substitutes for a fixed electron density.
The data presented here provide the first direct evidence of naturally occurring cavitating Langmuir turbulence, thought to be important in space and astrophysical plasmas as varied as pulsar magnetospheres and the Earth’s ionosphere Robinson (1997); Asseo and Porzio (2006); Nulsen et al. (2007); Kellogg et al. (1992); Robinson and Cairns (1995); Stasiewicz et al. (1996); Papadopoulos and Coffey (1974); Rowland et al. (1981); Guio and Forme (2006). Further observations of Langmuir turbulence in the ionosphere may yield advances in our understanding of supra-thermal electron distributions Matthews et al. (1976), naturally-enhanced ion-acoustic waves Forme (1999); Guio and Forme (2006), natural ionospheric radio emissions Hughes and LaBelle (2001), anomalous resistivity Papadopoulos and Coffey (1974); Rowland et al. (1981), and auroral currents and dark aurora Grydeland et al. (2004).
Acknowledgements.
EISCAT is supported by research organizations in China, Finland, France, Germany, Japan, Norway, Russia, Sweden, Ukraine, and the UK. Support for B.I. and M.T.R. was provided in part, respectively, by U.S. Army Research Office contract W911NF-07-1-0016 and by the Max-Planck-Institute for Aeronomy. Some of the calculations were performed on facilities provided by the Miracle Consortium, part of the DiRAC project funded by the UK Science and Technology Facilities Council. We thank César La Hoz for helping to arrange observation time on the EISCAT radar system, and we thank César La Hoz, Jim LaBelle, Kristina Lynch, Iver Cairns, Gerhard Haerendal, and two anonymous referees for constructive and helpful comments.References
- Wong and Cheung (1984) A. Y. Wong and P. Y. Cheung, Phys. Rev. Lett., 52, 1222 (1984).
- Vyacheslavov et al. (2002) L. N. Vyacheslavov, V. S. Burmasov, I. V. Kandaurov, E. P. Kruglyakov, O. I. Meshkov, S. S. Popov, and A. L. Sanin, Plasma Phys. Control. Fusion, 44, B279+ (2002).
- Sulzer and Fejer (1994) M. P. Sulzer and J. A. Fejer, J. Geophys. Res., 99, 15035 (1994).
- Isham et al. (1999) B. Isham, C. La Hoz, M. T. Rietveld, T. Hagfors, and T. B. Leyser, Phys. Rev. Lett., 83, 2576 (1999).
- Rietveld et al. (2000) M. T. Rietveld, B. Isham, H. Kohl, C. La Hoz, and T. Hagfors, J. Geophys. Res., 105, 7429 (2000).
- Asseo and Porzio (2006) E. Asseo and A. Porzio, Mon. Not. R. Astr.Soc, 369, 1469 (2006).
- Nulsen et al. (2007) A. L. Nulsen, I. H. Cairns, and P. A. Robinson, J. Geophys. Res., 112, 5107 (2007).
- Kellogg et al. (1992) P. J. Kellogg, K. Goetz, R. L. Howard, and S. J. Monson, Geophys. Res. Lett., 19, 1303 (1992).
- Robinson and Cairns (1995) P. A. Robinson and I. H. Cairns, Geophys. Res. Lett., 22, 2657 (1995).
- Stasiewicz et al. (1996) K. Stasiewicz, B. Holback, V. Krasnoselskikh, M. Boehm, R. Boström, and P. M. Kintner, J. Geophys. Res., 101, 21515 (1996).
- Papadopoulos and Coffey (1974) K. Papadopoulos and T. Coffey, J. Geophys. Res., 79, 674 (1974a).
- Rowland et al. (1981) H. L. Rowland, J. G. Lyon, and K. Papadopoulos, Phys. Rev. Lett., 46, 346 (1981a).
- Guio and Forme (2006) P. Guio and F. Forme, Phys. Plasmas, 13, (122902 (2006).
- Robinson (1997) P. A. Robinson, Rev. Mod. Phys., 69, 507 (1997).
- DuBois et al. (1991) D. F. DuBois, H. A. Rose, and D. Russell, Phys. Rev. Lett., 66, 1970 (1991).
- DuBois et al. (1993) D. F. DuBois, A. Hanssen, H. A. Rose, and D. Russell, Phys. Fluids, B5, 2616 (1993).
- Rietveld et al. (2002) M. T. Rietveld, B. Isham, T. Grydeland, C. La Hoz, T. B. Leyser, F. Honary, H. Ueda, M. Kosch, and T. Hagfors, Adv. Space Res., 29, 1363 (2002).
- Grydeland et al. (2004) T. Grydeland, E. M. Blixt, U. P. Løvhaug, T. Hagfors, C. L. Hoz, and T. S. Trondsen, Ann. Geophysicae, 22, 1115 (2004).
- Blixt et al. (2005) E. M. Blixt, T. Grydeland, N. Ivchenko, T. Hagfors, C. L. Hoz, B. S. Lanchester, U. P. Løvhaug, and T. S. Trondsen, Ann. Geophysicae, 23, 3 (2005).
- Zakharov (1972) V. E. Zakharov, Sov. Phys. JETP (English transl.), 35, 908 (1972).
- Williams et al. (2006) J. D. Williams, E. MacDonald, M. McCarthy, L. Peticolas, and G. K. Parks, Ann. Geophysicae, 24, 1829 (2006).
- Forme (1999) F. R. E. Forme, Ann. Geophysicae, 17, 1172 (1999).
- Sedgemore-Schulthess and St.-Maurice (2001) F. Sedgemore-Schulthess and J.-P. St.-Maurice, Sur. Geophys., 22, 55 (2001).
- Forme et al. (1995) F. R. E. Forme, D. Fontaine, and J. E. Wahlund, J. Geophys. Res., 100, 14625 (1995).
- Shen and Nicholson (1987) M. Shen and D. R. Nicholson, Phys. Fluids, 30, 1096 (1987).
- Matthews et al. (1976) D. L. Matthews, M. Pongratz, and K. Papadopoulos, J. Geophys. Res., 81, 123 (1976).
- Hughes and LaBelle (2001) J. M. Hughes and J. LaBelle, J. Geophys. Res., 106, 21157 (2001).
- Papadopoulos and Coffey (1974) K. Papadopoulos and T. Coffey, J. Geophys. Res., 79, 1558 (1974b).
- Rowland et al. (1981) H. L. Rowland, K. Papadopoulos, and P. J. Palmadesso, Geophys. Res. Lett., 8, 1257 (1981b).