Multicolor Photometry Study of the Galaxy Cluster A2589: Dynamics, Luminosity Function and Star Formation History
Abstract
Smooth X-ray morphology and non-detection of radio source at center indicate that A2589 is a typical case of well-relaxed regular galaxy cluster. In this paper we present a multicolor photometry for A2589 () with 15 intermediate bands in the Beijing-Arizona-Taiwan-Connecticut (BATC) system which covers an optical wavelength range from 3000 Å to 10000 Å. The spectral energy distributions (SEDs) for more than 5000 sources are achieved down to V 20 mag in about 1 deg2 field. A2589 has been also covered by the Sloan Digital Sky Survey (SDSS) in photometric mode only. A cross-identification of the BATC-detected galaxies with the SDSS photometric catalog achieves 1199 galaxies brighter than mag, among which 68 member galaxies with known spectroscopic redshifts are found. After combining the SDSS five-band photometric data and the BATC SEDs, the technique of photometric redshift is applied to these galaxies for selecting faint member galaxies. The color-magnitude relation is taken as a further restriction of early-type cluster galaxies. As a result, 106 galaxies are newly selected as member galaxies. Spatial distribution of member galaxies shows a north-south elongation which agrees with the X-ray brightness profile and the orientation of central cD galaxy, NGC 7647. No substructures are detected on the basis of positions and radial velocities of cluster galaxies, indicating that A2589 is a well-relaxed system. The luminosity function of A2589 exhibits a peak at mag and a dip at mag. The low-density outer regions are the preferred habitat of faint galaxies. With the evolutionary population synthesis model, PEGASE, the environmental effect on the star formation properties for 68 spectroscopically confirmed member galaxies is studied. The outlier faint galaxies tend to have longer time scales of star formation, shorter mean stellar ages, and lower metallicities of interstellar medium, which can be interpreted in the context of hierarchical cosmological scenario.
1 Introduction
As the largest gravitationally bound systems in the universe, galaxy clusters play a central role in cosmological studies, such as the baryon content of the universe, formation of large-scale structure, and the density parameters in cosmological models (Bahcall, 1996). For instance, the distribution of cluster velocity dispersions and mass-to-light ratios might provide limits on the amplitude of primordial density fluctuations in hierarchical clustering scenarios (Evrard, 1989; Frenk et al., 1990). In the cold dark matter models, galaxy clusters are complex multicomponent systems where galaxies, hot gas, and dark matter evolve in a tightly coupled way (Frenk et al., 1996), and they are driven by accreting these components along filaments (Bekki, 2001; Roettiger et al., 1996; Navarro & White, 1994; Cen & Ostriker, 1994). Therefore, cluster of galaxies has been regarded as a powerful laboratory for studying the evolution of the galaxies in a dense environment where the physical properties of galaxies might have been influenced by many different mechanisms, including strong galaxy-galaxy interaction (Mihos, 2004), harassment (Moore, Lake & Katz, 1998), ram pressure stripping (Quilis et al., 2000), and strangulation (Bower & Balogh, 2004, also known as starvation, or suffocation).
According to the hierarchical clustering scenario, galaxy clusters continue to be assembled, and relaxation is not yet complete in most clusters. It is widely appreciated that a regular cluster with no detectable substructure both in spatial distribution and in velocity space is at the most evolved stage. However, significant substructures have been revealed in a large number of rich galaxy clusters with the X-ray imaging and optical spectroscopic surveys (Rhee & Latour, 1991; Forman & Jones, 1982; Beers et al., 1991; Sarazin et al., 1992; Henry & Briel, 1993; Burns et al., 1994). Numerical simulation of the evolution of galaxy clusters indicates that at least 50% of apparently relaxed clusters contain significant substructures (Salvador-Sole et al., 1993). Very few clusters with single central dominant cD galaxy are found to be spherically symmetric in distributions of galaxies and hot gas. Even for the Coma cluster that was once regarded as an exemplar of regular and well-relaxed cluster, the projected distributions of galaxies and the X-ray-emitting gas also show convincing evidence of significant substructures on large and small scales (Colless & Dunn, 1996; White et al., 1993; Neumann et al., 2003). Recently, a deep spectroscopic survey for the faint galaxies in the central region of Coma cluster has confirmed previously identified substructures, and found three new substructures (Adami et al., 2009). Despite shortage of well-relaxed cD galaxy clusters, for a better understanding of the evolution of galaxies, the clusters at the final evolution stage are worthwhile to be extensively investigated with multiwavelength data. In addition, the well-relaxed clusters of galaxies are important laboratories for studying the dark matter in clusters. Because hot gas in the core regions of such clusters is undisturbed by interactions with the central radio source, it is relatively straightforward to resolve the spatial distribution of the gravitation matter which is dominated by the dark matter (Buote & Lewis, 2004).
The regular cluster of galaxies A2589 (z=0.0414), located at 23h24m00s.5, +16°49′29″.0 (J2000.0), with Abell richness R=0 (Abell 1958) and BM type I (Bautz & Morgan, 1970), is particularly well suited for such analysis. It appears remarkably relaxed and does not show any obvious signs of ongoing mergers. According to the ROSAT images, A2589 is a cluster with a smooth X-ray morphology (Buote & Tsai, 1996), and the ROSAT PSPC observation reveals a cool gas temperature ( keV) and a high X-ray luminosity ( ergs s-1) for the central region of A2589, defined by a radius of 0.5 Mpc (David et al., 1996). The image with higher spatial resolution shows no substantial morphological disturbance and no cooling flow in the core of A2589 (Buote & Lewis, 2004). Mccarthy et al. (2004) supposed an entropy injection mechanism to explain the relaxed status of the “non-cooling flow” cluster A2589. Additionally, no bright radio source is detected at the cluster center by the NRAO VLA Sky Survey (NVSS) (Bauer et al., 2000).
Previous optical studies of the galaxies in A2589 also show no evidence supporting the presence of subclusters (Beers et al., 1991). It is still a tough task to spectroscopically cover all the dwarf galaxies with low surface brightness (Kambas et al., 2000). As mentioned above, A2589 is not a rich cluster. Abell (1958) appraised its richness as R=0, which means less than 50 member galaxies within the magnitude range to (where is the magnitude of the third brightest galaxy). The multicolor optical photometry therefore becomes an alternative way for picking up faint member galaxies in a cluster. According their spectral energy distributions (SEDs), the redshifts of galaxies can be estimated by the technique of photometric redshift. The Beijing-Arizona-Taiwan-Connecticut (BATC) photometric survey is designed for such purpose, and allows us to study the properties of member galaxies in nearby () clusters (Yuan et al., 2001, 2003; Yang et al., 2004; Zhang et al., 2010).
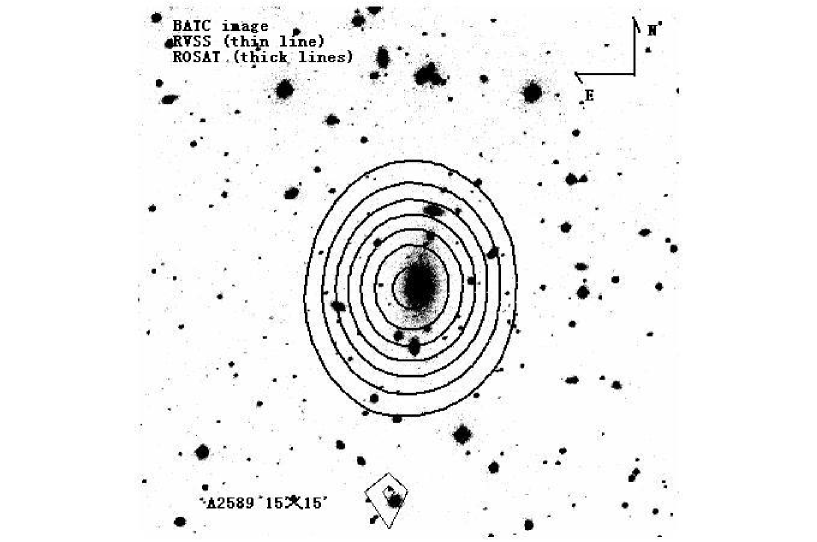
The relaxed and structureless appearance of A2589 can be well shown by Figure 1, which presents the smoothed contours of the ROSAT All-Sky Survey (RASS) image in soft X-ray band (0.1-2.4keV) and of the NVSS map at 1.4 GHz, superimposed on optical image of 15′ 15′in the BATC band. In this paper we will present a multicolor photometric study of the relaxed cluster A2589, using 15 intermediate filters of the BATC system which covers an optical wavelength region from 3000 to 10000 Å. The paper is organized as follows. In Section 2, we describe the BATC observation and data reduction. The SED selection of faint cluster galaxies is given in Section 3. In Section 4, we will show the main results about spatial distribution, dynamics, luminosity function, and star formation properties of cluster galaxies. Finally, summary and perspective will be given in Section 5. Throughout this paper we adopt the CDM cosmology model with H0=70 km s-1 Mpc-1, =0.3 and =0.7.
2 Observations and Data Reduction
2.1 BATC Observation
The observations of A2589 were carried out with the BATC filter system which includes 15 intermediate-band filters, namely, , and , covering the whole optical wavelength range. These intermediate filters are specifically designed to avoid most of the known bright night-sky emission lines (Yan et al., 2000), and they are mounted on the 60/90 cm f/3 Schmidt Telescope at the Xinglong station, National Astronomical Observatories of China (NAOC). Before October 2006, the BATC system was equipped with an old 2048 2048 Ford CCD camera. The field of view was about 1 square degree, and the spatial scale was 1.7″per pixel. For pursuing a better spatial resolution and a higher sensitivity in blue bands, a new E2V 4096 4096 CCD is now put into service. This CCD has a quantum efficiency of 92.2% at 4000 Å and a spatial scale of 1.35″per pixel. The field of view is extended to 92′92′. The pixel sizes for the old and new CCD cameras are 15 and 12 m, respectively, corresponding to a pixel size ratio of 5:4. The details of the telescope, camera, and data-acquisition system can be found elsewhere (Zhou et al., 2001; Yan et al., 2000). For distinguishing explicitly between the SDSS and BATC filter names, in this paper, we refer to the SDSS filters and magnitudes as u’, g’, r’, i’, z’, with their central wavelengths of 3560, 4680, 6180, 7500 and 8870Å. The transmissions of the BATC and SDSS filters can be seen in Yuan et al. (2003).
From September 2002 to November 2005, only 12 BATC filters, from d to p, were taken to target A2589 with the old CCD, discontinuously. Since 2006, the exposures in a, b, c bands have been completed with new CCD camera. In total, we have made 169 images with more than 54 hr of exposure, which were selected to be combined. The details of A2589 observation are given in Table 1.
| No. | Filter | FWHM | Exposure | Seeingb | Completeness | Indival Exposure | frames | |
|---|---|---|---|---|---|---|---|---|
| name | (Å) | (Å) | (s) | (arcsec) | magnitude | (s) | ||
| 01 | 3369.4 | 277.6 | 32400 | 3.99 | 20.5 | 1200 | 27 | |
| 02 | 3921.3 | 265.5 | 19200 | 3.70 | 20.5 | 1200 | 16 | |
| 03 | 4205.6 | 288.5 | 13800 | 3.76 | 20.5 | 900 | 14 | |
| 600 | 2 | |||||||
| 04 | 4528.9 | 370.6 | 12000 | 5.45 | 21.0 | 1200 | 20 | |
| 05 | 4884.7 | 372.4 | 13200 | 5.01 | 21.0 | 1200 | 11 | |
| 06 | 5225.1 | 333.8 | 9600 | 5.08 | 21.0 | 1200 | 8 | |
| 07 | 5793.8 | 284.5 | 7200 | 4.07 | 20.0 | 1200 | 6 | |
| 08 | 6093.6 | 310.4 | 6000 | 4.24 | 20.0 | 1200 | 5 | |
| 09 | 6093.6 | 310.4 | 5101 | 4.41 | 19.5 | 1200 | 4 | |
| 301 | 1 | |||||||
| 10 | 7032.3 | 163.0 | 6000 | 4.38 | 19.5 | 1200 | 5 | |
| 11 | 7539.5 | 197.2 | 9000 | 4.29 | 19.0 | 1200 | 7 | |
| 300 | 2 | |||||||
| 12 | 8012.7 | 286.6 | 12000 | 4.21 | 19.0 | 1200 | 10 | |
| 13 | 8509.5 | 168.2 | 11414 | 4.35 | 19.0 | 1200 | 9 | |
| 614 | 1 | |||||||
| 14 | 9172.9 | 248.4 | 18000 | 3.97 | 18.5 | 1200 | 15 | |
| 15 | 9740.7 | 272.0 | 19200 | 3.85 | 18.5 | 1200 | 16 |
a Central wavelengths of the filters; b This column lists the seeings of the combined images.
2.2 Data Reduction
The bias substraction and dome flat-field correction were done on the CCD images by using Pipeline I (Fan et al., 1996; Zhou et al., 2001) , the automatic data reduction code for the BATC survey. The cosmic-ray and bad pixel effects were corrected by comparing the images. Before combination, the images were recentered, and the position calibration was performed by using the Guide Star Catalog (GSC) (Jenkner et al., 1990).
For detecting sources and measuring the source fluxes within a given aperture in the combined BATC images, Pipeline II, a photometry package developed on the basis of DAOPHOT (Stetson, 1987) kernel (Zhou et al., 2003), is taken to perform aperture photometry. The objects with signal-to-noise ratio greater than the threshold 3.5 in , , and bands will be detected. Considering the pixel size ratio of 5:4 between the old and the new CCDs, we take an aperture radius of 4 pixels (i.e. =1.″74=6.″8) for the images in 12 bands ( to ), and a radius of 5 pixels (i.e., =1″.355=6.″8) for the images in a,b,c bands. Flux calibration in the BATC system is performed by using four Oke-Gunn standard stars (HD 19445, HD 84937, BD+262606 and BD+17 4708) (Gunn & Stryker, 1983), whose fluxes have been slightly corrected by further BATC observations during photometric nights (Zhou et al., 2001). To check the results of flux calibration via standard stars, we then perform the model calibration on the basis of the stellar SED library (Zhou et al., 1999). The flux measurements derived by these two calibration methods are in accordance with each other for most filters. As a result, the SEDs of 3465 sources are achieved down to within our field of view.
For assessing the measurement errors in specified magnitude, we compared the errors using different subgroups of magnitudes with an interval of 0.5 mag. We find that magnitude error in each filter becomes larger at fainter depth. Errors in the bands are found to be less than 0.02 mag for stars with , and more than 0.05 mag for stars with .
3 Selection of faint member galaxies in A2589
3.1 Combing the BATC and SDSS SEDs
Owing to low spatial resolution of the BATC images, it is difficult to make star-galaxy separation via the surface brightness profiles of detected sources. Alternatively, the color-color diagram is a powerful tool for morphological classification. Fortunately, A2589 has been covered by the SDSS photometric survey, and the star-galaxy classification of all sources down to has been performed via their light profiles. After a cross-identification of these 3465 sources detected by the BATC photometry with the SDSS photometric catalog, we obtain a list of 1199 galaxies brighter than within the BATC field of . For checking the completeness of the BATC detection of galaxies, we compare the SDSS galaxies down to a same brightness depth (i.e., 19.5) in the same region. Within central region with a radius of 0.5 degree, there are 555 SDSS-detected galaxies among which 537 galaxies are detected by the BATC, corresponding to a completeness of BATC detection of 96.8%. Spacial scale at cluster redshift is 0.818 kpc/arcsec, the typical seeing of combined images in the BATC bands is about 4.2 arcsec, corresponding to 3.4 kpc, which is smaller than the size of a typical spiral galaxy. With the photometric catalog of SDSS galaxies, a cross-identification of the 1199 galaxies with i19.5 is performed for estimating the percentage of object blending due to the seeing effect. A searching circle with a radius of 4.3 arcsec centered at BATC galaxies is adopted, and 27 galaxies are found to have more than one counterpart within the searching circle. The overall blending percentage is about 2.25%. We divide the BATC galaxies into 4 subsamples with the -band magnitude interval of 1.0 mag, ranging from 15.5 to 19.5, the blending percentage are 2.63%, 4.21%, 2.08%, 2.03%, respectively.
Furthermore, we take use of the NASA/IPAC Extragalactic Database (NED) to extract available observational information of the bright galaxies on the list. There are 81 galaxies having known spectroscopic redshifts. Note that A2589 has not been covered by the SDSS spectroscopic survey, the available spectroscopic redshifts of galaxies are contributed by relevant literature (Bothun & Schombert, 1988; Capelato et al., 1991; Wegner et al., 1999; Smith et al., 2004; Haynes et al., 1997). Majority of spectroscopic redshifts were obtained by Smith et al. (2004), and their selection criteria for spectroscopy are: and . For estimating completeness of spectroscopic sample, we apply the same criteria to the SDSS photometric data. By using the equations in Lupton (2005), the SDSS magnitudes can be transformed into and magnitudes. As a result, 111 SDSS galaxies are found to satisfy the criteria. Figure 2 shows the histograms of these 111 SDSS galaxies and 81 galaxies with known spectroscopic redshifts. The overall spectroscopic completeness down to should be about . Since only 30% of the faint galaxies with are spectroscopically covered, the overall completeness down to decreases to .

For a given galaxy detected by the SDSS imaging observation, two models were used to fit the observed surface brightness profile: (1) the de Vaucouleurs model, and (2) the exponential model. For measuring unbiased colors of galaxies, we use the dereddened SDSS model magnitudes which are measured by their flux through equivalent apertures in all SDSS bands. The model (exponential or de Vaucouleurs) of higher likelihood in the r filter is chosen, and then applied (i.e., allowing only the amplitude to vary) in the other SDSS bands after convolving with the appropriate PSF in each band. Because the resulting model magnitudes are calculated using the best-fit parameters in the band, the light is measured consistently through the same aperture in all SDSS bands.
Figure 3(a) shows the relative SDSS and BATC SEDs of the central cD galaxy in A2589, NGC 7647. It is clear that there is a systematic offset between two SEDs which is called zero point. A method of interpolation is applied to derive the zero point. Due to a larger magnitude error in the band, the magnitude offsets for other four SDSS filters are calculated by the interpolation algorithm on the basis of the BATC magnitudes in neighboring bands, and then take the average of the second and third largest offsets as the SED zero point. Figure 3(b) gives the combined SED of NGC 7647 after zero point correction. The zero point distribution for all the galaxies is presented in Figure 4. It can be seen that the peak of the zero point is mag, indicating that the aperture of is large enough to hold the majority of galaxies and to make different seeing effect negligible. For the most extended central cD galaxy, NGC 7647, our aperture just covers its core region, which leads to a large zero point of nearly 2.0 mag. After zero point correction, the combined 20-band SEDs for 2101 galaxies detected by BATC and SDSS photometry are achieved.


3.2 Sample of spectroscopically-confirmed member galaxies
Figure 5 shows the distribution of spectroscopic redshifts for 81 galaxies, with the bin size 0.001. The bulk of the spectroscopic redshifts is concentrated between 0.03 and 0.06, corresponding to A2589. In order to eliminate the background galaxies, we convert the spectroscopic redshifts () for the galaxies with into rest-frame velocities () by , where c is the light speed, is the cluster redshift with respect to the cosmic background radiation. We take the NED-given cluster redshift of for A2589 (Struble & Rood, 1999). A Gaussian fit is then applied to the distribution of rest-frame velocities, and a dispersion of =751 km s-1 is derived. With the prevalent selection criterium of 3 clipping, 68 galaxies with , corresponding to the zsp range from 0.034 to 0.048, are selected as member galaxies, to which we refer as “sample I”. Table 2 lists the SDSS-given celestial coordinate in degrees and the spectroscopic redshift in literature for these 68 member galaxies in sample I, in order by right ascension. The embedded panel of Figure 5 shows the histogram of rest-frame velocities for sample I with Gaussian fit.

| No. | R.A. | Decl. | Ref. | No. | R.A. | Decl | Ref. | ||
|---|---|---|---|---|---|---|---|---|---|
| 1 | 350.62835693 | 16.51060104 | 0.037286 | (4) | 35 | 350.99468994 | 16.79987144 | 0.040638 | (1) |
| 2 | 350.64688110 | 16.70728493 | 0.040188 | (4) | 36 | 350.99569702 | 16.87491226 | 0.044764 | (3) |
| 3 | 350.65444946 | 16.48854637 | 0.037256 | (4) | 37 | 350.99636841 | 16.81119919 | 0.042606 | (3) |
| 4 | 350.65954590 | 17.08135414 | 0.039137 | (4) | 38 | 350.99871826 | 16.87028122 | 0.040695 | (4) |
| 5 | 350.72991943 | 17.12408638 | 0.039671 | (4) | 39 | 351.00134277 | 16.82041550 | 0.034737 | (1) |
| 6 | 350.74523926 | 16.82660675 | 0.041102 | (4) | 40 | 351.00775146 | 16.81094170 | 0.035578 | (4) |
| 7 | 350.76705933 | 16.88853836 | 0.039070 | (4) | 41 | 351.01373291 | 16.77923775 | 0.041235 | (1) |
| 8 | 350.79455566 | 16.91345406 | 0.041068 | (3) | 42 | 351.02078247 | 16.87013626 | 0.041295 | (3) |
| 9 | 350.79602051 | 16.43208885 | 0.044357 | (4) | 43 | 351.02178955 | 16.66199303 | 0.040985 | (4) |
| 10 | 350.83938599 | 16.94395256 | 0.043143 | (4) | 44 | 351.02416992 | 16.79190254 | 0.041689 | (4) |
| 11 | 350.85235596 | 17.02542877 | 0.039898 | (4) | 45 | 351.02755737 | 16.54348183 | 0.040064 | (4) |
| 12 | 350.87240601 | 16.86256027 | 0.043313 | (4) | 46 | 351.03936768 | 17.11158180 | 0.039734 | (4) |
| 13 | 350.87268066 | 16.38849258 | 0.043523 | (4) | 47 | 351.03942871 | 16.66924858 | 0.044077 | (4) |
| 14 | 350.88140869 | 17.15295792 | 0.043557 | (4) | 48 | 351.04479980 | 16.53371620 | 0.039234 | (4) |
| 15 | 350.88894653 | 16.66280174 | 0.039150 | (2) | 49 | 351.05325317 | 17.10195732 | 0.044361 | (4) |
| 16 | 350.90270996 | 16.43026352 | 0.039961 | (4) | 50 | 351.06170654 | 16.73438454 | 0.037609 | (4) |
| 17 | 350.90341187 | 16.56361008 | 0.044487 | (4) | 51 | 351.06555176 | 16.78513336 | 0.041382 | (2) |
| 18 | 350.92968750 | 16.81964874 | 0.038477 | (4) | 52 | 351.07147217 | 16.92798424 | 0.041732 | (4) |
| 19 | 350.94128418 | 16.64007378 | 0.040208 | (4) | 53 | 351.08148193 | 16.73162270 | 0.044461 | (3) |
| 20 | 350.94842529 | 16.85229111 | 0.041812 | (3) | 54 | 351.08395386 | 16.55175018 | 0.043470 | (4) |
| 21 | 350.94931030 | 16.75221825 | 0.035171 | (3) | 55 | 351.09353638 | 17.04872704 | 0.041415 | (4) |
| 22 | 350.95083618 | 16.76874352 | 0.047183 | (4) | 56 | 351.09497070 | 17.19940758 | 0.042426 | (4) |
| 23 | 350.95123291 | 16.70607948 | 0.042019 | (4) | 57 | 351.09564209 | 16.80035019 | 0.042386 | (4) |
| 24 | 350.96112061 | 16.69865799 | 0.039157 | (4) | 58 | 351.13067627 | 16.86814690 | 0.035628 | (5) |
| 25 | 350.96188354 | 16.89692116 | 0.040441 | (4) | 59 | 351.13531494 | 17.10596466 | 0.040848 | (4) |
| 26 | 350.96264648 | 16.52305412 | 0.042426 | (4) | 60 | 351.14495850 | 16.68141174 | 0.040405 | (3) |
| 27 | 350.96414185 | 16.64476776 | 0.034701 | (3) | 61 | 351.17916870 | 17.13553810 | 0.041292 | (4) |
| 28 | 350.96905518 | 16.87223816 | 0.042670 | (2) | 62 | 351.19665527 | 16.94142342 | 0.043236 | (4) |
| 29 | 350.97305298 | 16.88004684 | 0.044984 | (4) | 63 | 351.24346924 | 16.53924561 | 0.042186 | (4) |
| 30 | 350.97683716 | 16.68067169 | 0.045195 | (3) | 64 | 351.30581665 | 16.40709877 | 0.039030 | (4) |
| 31 | 350.98266602 | 16.91675758 | 0.041212 | (4) | 65 | 351.30831909 | 16.82109833 | 0.043984 | (4) |
| 32 | 350.98645020 | 16.75003433 | 0.038326 | (4) | 66 | 351.33325195 | 17.02133942 | 0.041022 | (4) |
| 33 | 350.98931885 | 16.77722740 | 0.041118 | (3) | 67 | 351.33901978 | 16.68581009 | 0.041722 | (4) |
| 34 | 350.99304199 | 16.75839233 | 0.041949 | (4) | 68 | 351.39672852 | 16.54359245 | 0.041722 | (4) |
With only 26 member galaxies in cluster A2589, Capelato et al. (1991) derived a Gaussian velocity distribution with and . Based on 30 member galaxies, Beers et al. (1991) characterized the distribution of measured galaxy velocities by using the ROSTAT software. Two resistant and robust estimators (namely, the biweight location CBI and scale SBI), analogous to the velocity mean and standard deviation, are defined to characterize the velocity distribution (Beers et al., 1990). Beers et al. (1991) found CBI=12475 and SBI=624 . For 68 spectroscopically confirmed member galaxies, we use the ROSTAT software to calculate the biweight location and scale, and achieve CBI=12122 90 and SBI=737 85 . Comparatively, the biweight location in our statistics is smaller, and the biweight scale is larger with smaller uncertainties. In addition, the ROSTAT statistics for the velocity distribution shows that the number of big gaps is 0, which means the A2589 might be a virialized system.
3.3 Photometric Redshift Technique
It is well known that the technique of photometric redshift can be used to estimated the redshifts of galaxies on the basis of the SED information given by multicolor photometric surveys. With the development of large and deep field survey, this technique has been widely applied (Lanzetta et al., 1996; Arnouts et al., 1999; Furusawa et al., 2000). Based on the standard SED-fitting code called HYPERZ (Bolzonella et al., 2000), the procedures for estimating the photometric redshifts have been developed especially for the BATC multicolor photometric system (Yuan et al., 2001; Xia et al., 2002). For a given object, the photometric redshift, zph, corresponds to the best fit (in the -sense) between its photometric SED and the template SED. The SED templates for the normal galaxies are generated by convolving the galaxy spectra in template library with the transmission curves of the BATC and SDSS filters. In our SED fitting, we take the templates of normal galaxies in the GISSEL98 (Galaxy Isochore Synthesis Spectral Evolution Library) (Bruzual & Charlot, 1993). The dust extinction with a reddening law of Milky Way (Allen, 1976) is adopted, and the AV is flexible in a range from 0.0 to 0.5, in steps of 0.05. As a test, we firstly let the photometric redshift vary in a wide range from 0.0 to 1.0, with a step of 0.01. Only five galaxies are found to have . Then we search the values for 1199 galaxies brighter than in a range from 0.0 to 0.5, with a smaller step of 0.005.
During performing the HYPERZ, we develop an iterative method to discard the bad magnitudes in the observed SED. For a given galaxy, the first running of the HYPERZ gives the best-fit template SED, and the observed magnitude at a specified filter with the maximum deviation from the best-fit SED is selected. If its maximum deviation excesses 5 times of magnitude error, we will discard this magnitude in the observed SED, and search for the best SED fitting again. In the worst case, three magnitudes in an observed SED are allowed to be discarded in order to obtain a more accurate photometric redshift.
As a result, we obtain the photometric redshifts for 1199 galaxies brighter than , including the 81 galaxies with known values. Figure 6(a) shows the redshift comparison for these 81 galaxies. It is obvious that our estimate is basically consistent with the values. For the 68 member galaxies, the mean photometric redshift is 0.0393, and the standard deviation is 0.0077. The solid line denotes to =, and the dash lines indicate deviations (i.e., ) in the estimate, and the error bar of zph corresponds to 68 confidence level in our determination. Considering the selection algorithm of 3 clipping in the space, 66 (about 97%) of 68 member galaxies have their values between 0.016 and 0.062 (i.e., ), only two spectroscopically confirmed member galaxies are missed out. This range (shown in Figure 6(b) with the dashed lines) is taken as a selection criterium to select the member candidates from the remaining 1118 () galaxies without values. Figure 7(a) shows the average as a function of the BATC i-band magnitude. The four magnitude bins are defined as 15.5, 15.516.0, 16.016.5, and 16.5. The standard errors of are 0.0066, 0.0041, 0.0027, 0.0135, respectively. A similar statistics of uncertainties for 1199 galaxies is given in Figure 7(b), indicating that the uncertainty given by the SED-fitting code HYPERZ also depends upon the magnitude. The four magnitutde bins are defined as 15.5 16.5, 16.517.5, 17.518.5, 18.519.5, and their standard errors are 0.0011, 0.0018, 0.0037, 0.0104, respectively. For the faint galaxies with greater magnitude errors, the degree of SED fitting tends to be worse, which results in larger uncertainties.


After applying the -technique to the combined SEDs of 1118 galaxies, 110 faint galaxies (including 73 early-type galaxies and 37 late-types) are found as member galaxies candidates of A2589. Figure 8 shows the zph histograms for the galaxies in different detection depths. Panel (a) gives the distribution for the 171 bright galaxies with , and panel (b) is for the 1199 galaxies with . The dash lines are denoted as the photometric redshift range of cluster member candidates. At the detection depth of , corresponding to the limit of the SDSS spectroscopy, the peak at (contributed by cluster A2589) is very prominent. As the magnitude limit goes to the faint end, the peak of A2589 is still remarkable though a large number of background galaxies are detected, which demonstrates the reliability of our method of combining the BATC and SDSS photometric data and the SED-fitting procedure.
3.4 The Color-Magnitude Correlation
A correlation between color and absolute magnitude for early-type galaxies, the so-called CM relation, has been found for many rich galaxy clusters (Bower et al., 1992, and references therein). For early-type galaxies in a cluster, the brighter galaxies tend to have colors redder than the fainter galaxies do. This relation can be used for verifying the membership selection of the early-type galaxies within the BATC field (Yuan et al., 2001). In order to select the member early-type galaxies, we take the Hubble types of the best-fit SED templates as morphology classifications. Figure 9 presents the correlation between the color index versus -magnitude for the known and new early-type member candidates. The open circles denote newly selected early-types and the filled circles denote the known early-types. The solid line denotes the least-square fit for the linear relation with 65 known early-type galaxies:. The dashed lines represent deviation. Taking all photometric early-types into account, an horizontal line, , seems to be also a good model of the red sequence, which means red galaxies in A2589 might have a typical color. It is noticed that the good CM relation might be artificial because red galaxies are likely to be classified as early-types by the HYPERZ code.
As shown in Figure 9, most of early-type candidates agree with the CM correlation derived by the known early-type galaxies. There are 8 early-type candidates with colors beyond the deviation of intercept that have probably been misclassified. Taking only the templates of late-type galaxies, we apply the SED-fitting procedures again on these 8 candidates. As a result, 4 of them are found to have the best-fit template SEDs of Sa galaxies with redshifts between 0.016 and 0.062, and they are therefore regarded as late-type member galaxies. The remaining 4 candidates are excluded from the list of member galaxies.

Finally, we obtain a list of 106 () newly-selected member galaxies. Combined with the 68 spectroscopically confirmed member galaxies, we have obtained an enlarged sample of 174 member galaxies which includes 130 early-type galaxies and 44 late-type galaxies. We refer to this sample as “sample II” hereafter. Table 3 presents the catalog of SED information for the 106 newly-selected members, including the ID number, the SDSS-given celestial coordinate in degrees, photometric redshift, morphological class of the best-fit template, and combined SED information. The classification indices in a range from 1 to 7 are defined to denote E, S0, Sa, Sb, Sc, Sd and Im galaxies, respectively. The magnitude of 99.00 means non-detection in the specified band.
| No. | R.A. | Decl. | ||||||||||||||||||||||
|---|---|---|---|---|---|---|---|---|---|---|---|---|---|---|---|---|---|---|---|---|---|---|---|---|
| 1 | 350.52581787 | 16.92402267 | 0.048 | 1 | 19.97 | 20.47 | 19.79 | 19.14 | 18.77 | 18.73 | 18.37 | 18.22 | 18.02 | 17.91 | 99.00 | 17.92 | 17.96 | 17.65 | 17.31 | 21.28 | 19.12 | 17.71 | 17.96 | 17.71 |
| 2 | 350.53906250 | 16.87807274 | 0.056 | 2 | 18.81 | 18.14 | 17.90 | 17.46 | 17.11 | 16.89 | 16.64 | 16.51 | 16.29 | 16.21 | 16.21 | 16.02 | 15.90 | 15.83 | 15.65 | 18.90 | 17.37 | 16.55 | 16.12 | 15.81 |
| 3 | 350.53964233 | 16.80180168 | 0.025 | 7 | 19.67 | 18.74 | 18.76 | 18.87 | 18.76 | 18.78 | 18.73 | 18.59 | 18.59 | 18.46 | 18.61 | 18.57 | 18.41 | 18.95 | 18.30 | 20.28 | 18.78 | 18.83 | 18.64 | 17.51 |
| 4 | 350.54162598 | 16.67333031 | 0.033 | 3 | 17.46 | 17.12 | 16.89 | 16.80 | 16.70 | 16.64 | 16.63 | 16.59 | 16.27 | 16.29 | 16.56 | 16.42 | 16.43 | 16.32 | 16.44 | 17.64 | 16.83 | 16.59 | 16.38 | 16.31 |
| 5 | 350.54580688 | 17.26466942 | 0.044 | 1 | 18.43 | 18.17 | 17.35 | 16.98 | 16.61 | 16.48 | 16.12 | 16.05 | 15.82 | 15.84 | 15.83 | 15.58 | 15.48 | 15.41 | 15.29 | 18.65 | 16.88 | 16.08 | 15.71 | 15.40 |
| 6 | 350.55383301 | 16.42631340 | 0.030 | 4 | 99.00 | 17.89 | 17.36 | 17.30 | 17.17 | 17.09 | 17.01 | 16.94 | 16.64 | 16.68 | 16.78 | 16.67 | 16.62 | 16.51 | 16.42 | 18.28 | 17.38 | 16.91 | 16.72 | 16.53 |
| 7 | 350.56356812 | 16.40281296 | 0.057 | 1 | 99.00 | 19.14 | 18.76 | 18.34 | 17.92 | 17.67 | 17.50 | 17.38 | 17.12 | 17.11 | 17.02 | 16.83 | 16.74 | 16.65 | 16.59 | 20.31 | 18.26 | 17.32 | 16.91 | 16.70 |
| 8 | 350.58166504 | 16.80896950 | 0.046 | 3 | 99.00 | 19.30 | 19.08 | 19.27 | 19.09 | 19.00 | 18.84 | 18.76 | 18.47 | 18.42 | 18.83 | 18.39 | 18.20 | 17.90 | 18.04 | 27.70 | 19.21 | 18.70 | 18.44 | 18.47 |
| 9 | 350.59280396 | 16.95937729 | 0.027 | 2 | 21.58 | 20.38 | 20.05 | 20.26 | 19.60 | 19.54 | 19.30 | 19.37 | 19.17 | 19.00 | 19.23 | 19.09 | 18.62 | 18.73 | 18.58 | 21.78 | 19.96 | 19.39 | 19.01 | 18.84 |
| 10 | 350.59347534 | 17.01498795 | 0.061 | 1 | 18.23 | 18.19 | 17.76 | 17.08 | 16.59 | 16.36 | 16.04 | 15.92 | 15.67 | 15.61 | 15.56 | 15.34 | 15.28 | 15.19 | 15.02 | 18.86 | 16.91 | 15.98 | 15.53 | 15.21 |
| 11 | 350.59823608 | 17.03547859 | 0.060 | 4 | 18.41 | 18.12 | 17.76 | 17.67 | 17.47 | 17.34 | 17.20 | 17.13 | 17.01 | 16.74 | 17.01 | 16.81 | 16.77 | 16.76 | 16.68 | 18.65 | 17.63 | 17.17 | 16.84 | 16.73 |
| 12 | 350.60241699 | 17.10379982 | 0.049 | 1 | 19.14 | 18.44 | 17.81 | 17.45 | 17.06 | 16.95 | 16.61 | 16.51 | 16.30 | 16.28 | 16.26 | 16.04 | 15.95 | 15.88 | 15.78 | 19.16 | 17.34 | 16.55 | 16.17 | 15.87 |
| 13 | 350.61746216 | 16.42463112 | 0.023 | 1 | 99.00 | 20.87 | 23.37 | 21.43 | 20.31 | 20.35 | 19.81 | 19.77 | 19.44 | 19.95 | 19.31 | 19.61 | 19.63 | 18.89 | 19.21 | 21.89 | 20.76 | 19.95 | 19.44 | 19.11 |
| 14 | 350.63101196 | 16.37726974 | 0.048 | 1 | 99.00 | 20.15 | 20.43 | 18.97 | 19.07 | 19.17 | 18.84 | 18.77 | 18.34 | 18.68 | 99.00 | 18.76 | 18.60 | 18.93 | 18.08 | 21.33 | 20.02 | 18.94 | 18.48 | 18.07 |
| 15 | 350.63424683 | 16.78801537 | 0.017 | 1 | 19.89 | 19.24 | 20.16 | 19.33 | 18.95 | 18.87 | 18.54 | 18.42 | 18.16 | 18.04 | 17.96 | 17.83 | 17.70 | 17.72 | 17.48 | 20.93 | 19.24 | 18.43 | 17.92 | 17.62 |
| 16 | 350.63787842 | 16.44768906 | 0.034 | 1 | 99.00 | 18.21 | 18.07 | 17.93 | 17.80 | 17.77 | 17.71 | 17.68 | 17.49 | 17.48 | 17.61 | 17.59 | 17.45 | 17.26 | 17.38 | 19.08 | 17.91 | 17.62 | 17.52 | 17.63 |
| 17 | 350.66183472 | 16.35647392 | 0.053 | 1 | 99.00 | 18.22 | 19.08 | 18.75 | 18.23 | 18.05 | 17.84 | 17.77 | 17.48 | 17.38 | 17.45 | 17.31 | 17.12 | 17.09 | 17.09 | 20.48 | 18.57 | 17.74 | 17.35 | 17.08 |
| 18 | 350.66513062 | 16.86167526 | 0.024 | 3 | 17.74 | 17.16 | 16.55 | 16.31 | 16.00 | 15.89 | 15.59 | 15.48 | 15.21 | 15.20 | 15.11 | 15.00 | 14.85 | 14.73 | 14.68 | 17.75 | 16.24 | 15.47 | 15.06 | 14.74 |
| 19 | 350.68112183 | 16.36630630 | 0.037 | 1 | 99.00 | 18.48 | 18.64 | 18.42 | 18.31 | 18.25 | 18.14 | 18.03 | 17.87 | 17.76 | 18.11 | 17.87 | 17.75 | 17.87 | 17.70 | 19.81 | 18.33 | 18.05 | 17.81 | 17.88 |
| 20 | 350.74844360 | 17.16712379 | 0.043 | 1 | 18.98 | 18.49 | 17.84 | 17.45 | 17.04 | 16.91 | 16.57 | 16.48 | 16.28 | 16.25 | 16.19 | 15.97 | 15.91 | 15.79 | 15.74 | 19.21 | 17.31 | 16.51 | 16.12 | 15.82 |
| 21 | 350.75390625 | 16.79937553 | 0.024 | 2 | 19.40 | 17.97 | 17.70 | 17.55 | 17.37 | 17.32 | 17.22 | 17.13 | 16.90 | 16.86 | 16.93 | 16.86 | 16.79 | 16.66 | 16.61 | 18.74 | 17.49 | 17.09 | 16.85 | 16.73 |
| 22 | 350.75997925 | 17.14521217 | 0.039 | 3 | 19.86 | 19.90 | 19.73 | 20.21 | 19.71 | 19.59 | 19.28 | 19.20 | 18.92 | 19.17 | 18.94 | 18.87 | 18.52 | 18.41 | 18.72 | 21.14 | 19.85 | 19.22 | 18.91 | 18.76 |
| 23 | 350.76577759 | 16.54315758 | 0.049 | 1 | 20.30 | 20.17 | 20.00 | 19.01 | 18.83 | 18.77 | 18.41 | 18.44 | 18.28 | 18.27 | 18.29 | 18.16 | 18.24 | 18.04 | 18.40 | 20.72 | 19.24 | 18.01 | 18.31 | 18.09 |
| 24 | 350.77868652 | 17.10724640 | 0.024 | 1 | 20.60 | 19.35 | 19.24 | 19.50 | 19.68 | 19.58 | 19.74 | 19.38 | 19.15 | 19.26 | 19.36 | 19.24 | 18.96 | 18.83 | 18.27 | 20.94 | 19.65 | 19.26 | 19.09 | 19.02 |
| 25 | 350.78274536 | 16.53175163 | 0.044 | 1 | 18.69 | 17.89 | 16.86 | 15.96 | 15.78 | 15.60 | 15.09 | 14.93 | 14.69 | 14.55 | 14.42 | 14.30 | 14.22 | 14.11 | 14.08 | 17.71 | 15.79 | 14.75 | 14.54 | 15.16 |
| 26 | 350.79830933 | 16.60096359 | 0.043 | 1 | 21.28 | 20.15 | 19.27 | 19.26 | 19.10 | 19.09 | 18.99 | 18.93 | 18.85 | 18.82 | 19.27 | 18.91 | 18.58 | 18.54 | 19.00 | 21.02 | 19.26 | 18.85 | 18.62 | 18.75 |
| 27 | 350.80563354 | 16.58921432 | 0.031 | 1 | 18.68 | 18.03 | 17.76 | 17.80 | 17.64 | 17.56 | 17.55 | 17.48 | 17.24 | 17.24 | 17.33 | 17.26 | 17.14 | 17.26 | 17.15 | 18.95 | 17.79 | 17.48 | 17.28 | 17.13 |
| 28 | 350.82449341 | 16.66783524 | 0.049 | 1 | 20.62 | 19.83 | 19.37 | 19.16 | 18.85 | 18.71 | 99.00 | 18.54 | 18.33 | 18.26 | 18.43 | 18.27 | 18.22 | 18.15 | 17.70 | 20.33 | 19.10 | 18.59 | 18.35 | 18.10 |
| 29 | 350.82653809 | 17.22652817 | 0.039 | 2 | 18.35 | 18.39 | 17.60 | 17.49 | 17.24 | 17.10 | 16.78 | 16.71 | 16.49 | 16.47 | 16.45 | 16.25 | 16.18 | 16.08 | 16.02 | 18.79 | 17.39 | 16.71 | 16.34 | 16.12 |
| 30 | 350.82934570 | 16.66695786 | 0.042 | 1 | 99.00 | 19.18 | 22.12 | 21.04 | 20.26 | 19.84 | 19.63 | 19.42 | 19.39 | 19.38 | 19.75 | 19.36 | 18.77 | 18.94 | 18.26 | 21.60 | 20.64 | 19.74 | 19.32 | 18.99 |
| 31 | 350.83618164 | 16.79516220 | 0.044 | 2 | 18.94 | 18.48 | 18.03 | 17.98 | 17.76 | 17.69 | 17.57 | 17.51 | 17.31 | 17.34 | 17.34 | 17.24 | 17.16 | 17.15 | 17.20 | 19.11 | 17.95 | 17.53 | 17.28 | 17.10 |
| 32 | 350.85662842 | 16.77861404 | 0.026 | 4 | 19.63 | 19.39 | 19.17 | 19.20 | 19.10 | 19.08 | 18.82 | 18.77 | 18.67 | 18.67 | 18.45 | 18.57 | 18.13 | 18.28 | 18.15 | 20.28 | 19.18 | 18.71 | 18.46 | 18.30 |
| 33 | 350.87145996 | 16.61509132 | 0.030 | 1 | 99.00 | 21.13 | 21.10 | 19.81 | 19.79 | 19.72 | 19.44 | 19.09 | 18.92 | 19.01 | 19.11 | 19.02 | 18.78 | 18.99 | 18.28 | 21.46 | 19.95 | 19.30 | 18.94 | 18.74 |
| 34 | 350.87319946 | 16.90993500 | 0.048 | 5 | 18.74 | 17.81 | 17.28 | 17.19 | 17.00 | 16.93 | 16.74 | 16.67 | 16.38 | 16.39 | 16.55 | 16.40 | 16.33 | 16.26 | 16.18 | 18.01 | 17.12 | 16.71 | 16.53 | 16.03 |
| 35 | 350.87722778 | 16.76000595 | 0.031 | 1 | 20.83 | 19.47 | 18.77 | 18.22 | 17.91 | 17.83 | 17.53 | 17.46 | 17.20 | 17.12 | 17.13 | 17.00 | 16.84 | 16.76 | 16.81 | 19.82 | 18.19 | 17.42 | 17.07 | 16.79 |
| 36 | 350.88580322 | 17.04202461 | 0.059 | 3 | 99.00 | 20.15 | 19.62 | 19.63 | 19.33 | 19.19 | 18.86 | 18.66 | 18.42 | 18.42 | 18.61 | 18.18 | 18.24 | 18.16 | 18.08 | 21.35 | 19.19 | 18.80 | 18.40 | 22.37 |
| 37 | 350.89169312 | 16.81429672 | 0.050 | 3 | 20.64 | 99.00 | 19.21 | 19.50 | 19.07 | 18.98 | 18.75 | 18.59 | 18.03 | 18.36 | 18.32 | 18.21 | 18.01 | 18.14 | 17.76 | 20.76 | 19.36 | 18.63 | 18.28 | 18.07 |
| 38 | 350.89550781 | 16.77338600 | 0.023 | 1 | 19.77 | 19.65 | 18.79 | 18.77 | 18.44 | 18.39 | 18.15 | 17.99 | 17.82 | 17.80 | 17.67 | 17.67 | 17.49 | 17.35 | 17.53 | 20.36 | 18.68 | 17.97 | 17.63 | 17.39 |
| 39 | 350.90295410 | 16.65809059 | 0.034 | 1 | 19.60 | 18.60 | 18.01 | 17.57 | 17.16 | 17.07 | 16.79 | 16.69 | 16.48 | 16.47 | 16.41 | 16.25 | 16.10 | 16.07 | 15.95 | 19.16 | 17.46 | 16.70 | 16.34 | 16.04 |
| 40 | 350.90997314 | 17.03512764 | 0.044 | 4 | 20.55 | 19.23 | 20.50 | 20.07 | 19.66 | 19.58 | 19.49 | 19.47 | 19.30 | 19.37 | 19.41 | 19.05 | 18.89 | 18.43 | 19.26 | 21.03 | 19.95 | 19.41 | 19.07 | 18.88 |
| 41 | 350.91564941 | 17.15081024 | 0.024 | 4 | 99.00 | 19.85 | 19.81 | 19.91 | 19.96 | 19.89 | 19.78 | 19.61 | 19.29 | 19.39 | 19.48 | 19.46 | 19.15 | 19.57 | 18.51 | 20.45 | 20.02 | 19.47 | 19.14 | 20.33 |
| 42 | 350.92758179 | 16.63711929 | 0.038 | 1 | 99.00 | 21.10 | 19.45 | 18.70 | 18.50 | 18.36 | 18.15 | 17.99 | 17.71 | 17.69 | 17.66 | 17.54 | 17.33 | 17.31 | 17.10 | 20.44 | 18.71 | 17.91 | 17.54 | 17.35 |
| 43 | 350.93566895 | 16.57441330 | 0.056 | 1 | 19.92 | 19.62 | 19.04 | 18.54 | 18.12 | 18.04 | 17.80 | 17.68 | 17.42 | 17.34 | 17.40 | 17.20 | 17.10 | 17.16 | 16.93 | 20.17 | 18.46 | 17.69 | 17.34 | 17.03 |
| 44 | 350.94158936 | 16.53168869 | 0.018 | 1 | 99.00 | 20.07 | 20.71 | 21.04 | 19.87 | 20.02 | 19.49 | 19.44 | 18.90 | 19.61 | 18.81 | 18.88 | 18.96 | 18.52 | 18.77 | 21.69 | 20.28 | 19.41 | 18.99 | 18.63 |
| 45 | 350.94189453 | 16.83019829 | 0.043 | 1 | 19.53 | 18.82 | 18.11 | 17.73 | 17.31 | 17.21 | 16.91 | 16.78 | 16.57 | 16.51 | 16.53 | 16.30 | 16.17 | 16.04 | 16.02 | 19.43 | 17.59 | 16.75 | 16.35 | 16.08 |
| 46 | 350.94229126 | 16.98780251 | 0.028 | 4 | 19.98 | 19.84 | 20.99 | 19.90 | 19.57 | 19.54 | 19.20 | 19.47 | 19.32 | 19.30 | 19.21 | 19.18 | 19.03 | 18.43 | 19.84 | 20.88 | 19.91 | 19.34 | 18.95 | 18.75 |
| 47 | 350.95550537 | 17.13400650 | 0.040 | 1 | 20.20 | 19.64 | 19.98 | 19.63 | 19.49 | 19.50 | 19.22 | 19.04 | 18.86 | 18.90 | 18.90 | 18.62 | 18.50 | 18.74 | 18.44 | 21.48 | 19.73 | 19.14 | 18.78 | 18.45 |
| 48 | 350.95840454 | 16.35474205 | 0.053 | 1 | 20.36 | 20.85 | 21.16 | 20.08 | 19.73 | 19.67 | 19.17 | 19.66 | 19.24 | 18.83 | 19.62 | 19.04 | 18.93 | 19.11 | 18.84 | 21.15 | 20.14 | 19.62 | 19.16 | 19.02 |
| 49 | 350.96127319 | 16.79039574 | 0.053 | 2 | 19.94 | 21.01 | 19.55 | 21.15 | 20.47 | 20.73 | 20.44 | 20.40 | 19.45 | 19.56 | 19.72 | 19.51 | 19.46 | 19.79 | 19.08 | 22.11 | 21.00 | 20.14 | 19.80 | 19.44 |
| 50 | 350.96603394 | 16.67181778 | 0.045 | 1 | 20.55 | 19.06 | 18.82 | 18.18 | 17.82 | 17.72 | 17.45 | 17.30 | 17.11 | 17.09 | 17.03 | 16.85 | 16.75 | 16.66 | 16.79 | 19.93 | 18.12 | 17.32 | 16.95 | 16.64 |
| 51 | 350.96640015 | 17.02894592 | 0.026 | 3 | 19.82 | 19.08 | 19.00 | 18.88 | 18.63 | 18.58 | 18.36 | 18.37 | 18.24 | 18.14 | 18.20 | 18.16 | 18.15 | 17.83 | 18.14 | 20.05 | 18.76 | 18.53 | 18.06 | 17.97 |
| 52 | 350.96762085 | 16.92559433 | 0.053 | 1 | 22.61 | 19.19 | 18.74 | 18.29 | 17.92 | 17.81 | 17.47 | 17.39 | 17.20 | 17.23 | 17.07 | 16.92 | 16.85 | 16.77 | 16.68 | 20.24 | 18.25 | 17.09 | 17.09 | 16.80 |
| 53 | 350.97122192 | 16.77782631 | 0.046 | 1 | 22.02 | 99.00 | 18.92 | 18.75 | 18.30 | 18.23 | 17.96 | 17.80 | 17.69 | 17.48 | 17.53 | 17.41 | 17.28 | 17.15 | 17.14 | 20.27 | 18.62 | 17.81 | 17.42 | 17.17 |
| 54 | 350.97134399 | 16.73224449 | 0.036 | 3 | 20.68 | 99.00 | 20.16 | 19.77 | 19.69 | 19.56 | 19.49 | 19.35 | 19.41 | 18.94 | 19.12 | 18.96 | 18.85 | 18.66 | 18.91 | 21.10 | 19.82 | 19.28 | 18.95 | 18.81 |
| 55 | 350.97305298 | 16.64459801 | 0.045 | 3 | 22.17 | 99.00 | 20.97 | 20.47 | 19.80 | 20.08 | 20.28 | 19.58 | 19.32 | 19.46 | 20.45 | 19.37 | 19.84 | 18.82 | 18.59 | 23.03 | 20.17 | 19.60 | 19.32 | 19.23 |
| 56 | 350.97525024 | 16.46105576 | 0.053 | 1 | 99.00 | 20.26 | 20.66 | 19.56 | 19.05 | 18.75 | 18.52 | 18.39 | 18.17 | 18.07 | 18.15 | 17.90 | 17.71 | 17.54 | 17.92 | 21.26 | 19.35 | 18.37 | 17.96 | 17.63 |
| 57 | 350.97549438 | 16.53599358 | 0.046 | 1 | 99.00 | 20.10 | 19.03 | 18.94 | 18.59 | 18.47 | 18.19 | 18.08 | 17.90 | 17.80 | 17.79 | 17.66 | 17.53 | 17.48 | 17.54 | 20.27 | 18.81 | 18.10 | 17.75 | 17.50 |
| 58 | 350.99014282 | 16.72022820 | 0.052 | 1 | 21.11 | 20.54 | 20.19 | 20.41 | 20.04 | 19.83 | 19.66 | 19.26 | 19.25 | 19.02 | 19.64 | 18.89 | 18.71 | 19.04 | 18.41 | 21.44 | 20.16 | 19.42 | 19.12 | 19.03 |
| 59 | 351.00198364 | 16.89023781 | 0.060 | 2 | 19.89 | 19.15 | 20.41 | 19.69 | 19.18 | 19.08 | 18.74 | 18.83 | 18.55 | 18.87 | 18.73 | 18.31 | 18.27 | 18.25 | 18.29 | 21.27 | 19.50 | 18.81 | 18.47 | 18.25 |
| 60 | 351.00668335 | 17.24337769 | 0.046 | 7 | 19.61 | 19.78 | 19.50 | 19.50 | 19.58 | 19.54 | 19.48 | 19.29 | 19.32 | 18.99 | 19.80 | 19.10 | 19.53 | 18.56 | 18.72 | 20.64 | 19.50 | 19.32 | 19.09 | 19.51 |
| No. | R.A. | Decl. | ||||||||||||||||||||||
|---|---|---|---|---|---|---|---|---|---|---|---|---|---|---|---|---|---|---|---|---|---|---|---|---|
| 61 | 351.00845337 | 16.75835037 | 0.021 | 1 | 20.54 | 99.00 | 18.60 | 18.87 | 18.46 | 18.36 | 18.09 | 17.94 | 17.76 | 17.75 | 17.61 | 17.54 | 17.40 | 17.24 | 17.35 | 20.46 | 18.73 | 17.96 | 17.61 | 17.29 |
| 62 | 351.01538086 | 16.60781860 | 0.058 | 1 | 21.07 | 19.52 | 18.94 | 18.65 | 18.25 | 18.12 | 17.87 | 17.75 | 17.54 | 17.45 | 17.46 | 17.25 | 17.21 | 17.11 | 17.00 | 20.48 | 18.61 | 17.45 | 17.47 | 17.14 |
| 63 | 351.01727295 | 16.77843475 | 0.024 | 3 | 20.25 | 19.79 | 99.00 | 19.56 | 19.27 | 19.35 | 19.02 | 18.93 | 18.68 | 18.71 | 18.65 | 18.68 | 18.43 | 18.67 | 18.49 | 25.43 | 19.59 | 18.92 | 18.59 | 18.56 |
| 64 | 351.02890015 | 16.76558304 | 0.020 | 1 | 20.00 | 22.55 | 20.23 | 19.93 | 19.76 | 19.77 | 19.47 | 19.31 | 18.71 | 19.26 | 18.88 | 18.92 | 18.80 | 19.19 | 18.37 | 21.94 | 20.02 | 19.23 | 18.91 | 18.68 |
| 65 | 351.03451538 | 16.70536232 | 0.035 | 3 | 99.00 | 18.89 | 20.16 | 20.05 | 19.87 | 19.88 | 19.71 | 19.35 | 19.21 | 19.51 | 19.07 | 19.08 | 18.55 | 18.87 | 18.28 | 21.10 | 20.01 | 19.31 | 19.08 | 18.77 |
| 66 | 351.03710938 | 16.74093056 | 0.023 | 2 | 23.21 | 19.34 | 19.10 | 19.17 | 18.77 | 18.71 | 18.39 | 18.26 | 18.15 | 18.14 | 18.04 | 17.89 | 17.85 | 17.67 | 17.53 | 20.59 | 19.08 | 18.37 | 17.91 | 17.68 |
| 67 | 351.05773926 | 17.07377625 | 0.042 | 3 | 20.37 | 99.00 | 19.75 | 20.35 | 19.93 | 20.02 | 20.09 | 19.51 | 19.24 | 19.22 | 20.10 | 19.33 | 18.87 | 19.21 | 17.99 | 21.51 | 20.19 | 19.51 | 19.16 | 19.09 |
| 68 | 351.05862427 | 16.73395157 | 0.039 | 2 | 20.61 | 19.17 | 18.44 | 18.03 | 17.71 | 17.64 | 17.36 | 17.23 | 17.07 | 17.08 | 16.98 | 16.86 | 16.64 | 16.56 | 16.57 | 19.48 | 17.91 | 17.20 | 16.93 | 16.70 |
| 69 | 351.06436157 | 16.63640594 | 0.030 | 4 | 19.44 | 18.88 | 19.31 | 18.93 | 18.71 | 18.66 | 18.38 | 18.44 | 18.26 | 18.23 | 18.29 | 18.08 | 18.03 | 17.76 | 17.92 | 20.03 | 18.89 | 18.43 | 18.09 | 17.84 |
| 70 | 351.07086182 | 16.99158096 | 0.024 | 1 | 99.00 | 20.32 | 19.20 | 19.63 | 19.40 | 19.30 | 18.90 | 18.90 | 18.77 | 18.77 | 18.69 | 18.66 | 18.44 | 18.34 | 18.28 | 21.00 | 19.61 | 18.89 | 18.59 | 18.36 |
| 71 | 351.07095337 | 16.57386208 | 0.044 | 1 | 19.72 | 19.19 | 18.01 | 17.58 | 17.19 | 17.06 | 16.79 | 16.67 | 16.47 | 16.43 | 16.38 | 16.22 | 16.10 | 15.99 | 15.91 | 19.23 | 17.46 | 16.68 | 16.28 | 16.00 |
| 72 | 351.07333374 | 17.14213371 | 0.049 | 4 | 19.34 | 18.67 | 18.68 | 18.73 | 18.49 | 18.29 | 18.31 | 18.24 | 17.95 | 17.77 | 18.06 | 17.91 | 17.85 | 17.98 | 17.91 | 19.72 | 18.69 | 18.30 | 17.97 | 17.78 |
| 73 | 351.08377075 | 16.50154114 | 0.048 | 1 | 19.22 | 19.18 | 19.89 | 19.37 | 19.31 | 19.35 | 19.23 | 19.10 | 18.81 | 18.54 | 19.12 | 18.79 | 18.97 | 19.08 | 19.04 | 20.57 | 19.52 | 19.15 | 18.94 | 18.91 |
| 74 | 351.08947754 | 17.21441841 | 0.017 | 3 | 20.79 | 21.03 | 20.33 | 20.30 | 19.88 | 20.04 | 19.59 | 19.61 | 19.30 | 19.23 | 19.33 | 19.16 | 19.05 | 19.37 | 19.14 | 21.53 | 20.25 | 19.62 | 19.25 | 18.87 |
| 75 | 351.09808350 | 16.88235664 | 0.057 | 1 | 19.18 | 19.37 | 19.29 | 18.75 | 18.43 | 18.26 | 18.02 | 17.90 | 17.71 | 17.73 | 17.64 | 17.46 | 17.35 | 17.42 | 17.32 | 20.40 | 18.63 | 17.87 | 17.71 | 17.23 |
| 76 | 351.11566162 | 16.69385719 | 0.047 | 1 | 19.95 | 19.04 | 18.35 | 18.00 | 17.59 | 17.47 | 17.23 | 17.10 | 16.87 | 16.87 | 16.80 | 16.62 | 16.48 | 16.46 | 16.35 | 19.61 | 17.89 | 17.10 | 16.71 | 16.43 |
| 77 | 351.11795044 | 16.47721481 | 0.023 | 3 | 19.64 | 21.00 | 20.46 | 20.28 | 19.91 | 20.04 | 19.73 | 19.37 | 19.21 | 19.47 | 19.24 | 19.00 | 18.83 | 18.61 | 19.61 | 21.22 | 20.05 | 19.43 | 19.09 | 18.86 |
| 78 | 351.12063599 | 16.41191292 | 0.060 | 3 | 19.79 | 19.44 | 19.54 | 19.19 | 18.93 | 18.75 | 18.57 | 18.52 | 18.25 | 18.18 | 18.31 | 18.07 | 17.85 | 17.89 | 17.78 | 20.45 | 19.19 | 18.42 | 18.19 | 17.93 |
| 79 | 351.12286377 | 17.11305428 | 0.048 | 3 | 99.00 | 19.32 | 20.58 | 19.98 | 19.77 | 19.77 | 19.66 | 19.32 | 19.38 | 19.04 | 19.26 | 18.92 | 18.64 | 19.10 | 18.72 | 21.28 | 20.00 | 19.36 | 19.06 | 18.91 |
| 80 | 351.12655640 | 16.86726189 | 0.050 | 3 | 19.86 | 18.40 | 17.88 | 17.72 | 17.60 | 17.59 | 17.54 | 17.48 | 17.17 | 17.26 | 17.34 | 17.25 | 17.16 | 17.31 | 17.31 | 17.09 | 17.57 | 17.53 | 17.53 | 16.89 |
| 81 | 351.13357544 | 16.66821671 | 0.042 | 1 | 19.57 | 19.08 | 18.33 | 17.97 | 17.67 | 17.60 | 17.34 | 17.20 | 17.01 | 16.95 | 16.95 | 16.77 | 16.67 | 16.59 | 16.54 | 19.50 | 17.92 | 17.22 | 16.82 | 16.57 |
| 82 | 351.16860962 | 16.48097610 | 0.056 | 4 | 19.08 | 19.39 | 18.77 | 18.76 | 18.49 | 18.43 | 18.27 | 18.16 | 17.88 | 17.88 | 17.93 | 17.67 | 17.71 | 17.54 | 17.48 | 19.97 | 18.69 | 18.12 | 17.81 | 17.60 |
| 83 | 351.17163086 | 16.57984734 | 0.048 | 3 | 21.16 | 20.21 | 20.15 | 19.50 | 19.25 | 19.19 | 18.87 | 18.84 | 18.74 | 18.41 | 18.43 | 18.32 | 18.20 | 18.11 | 18.37 | 20.77 | 19.48 | 18.74 | 18.41 | 18.16 |
| 84 | 351.21090698 | 17.24355888 | 0.060 | 2 | 18.82 | 20.16 | 19.54 | 19.82 | 19.45 | 19.15 | 18.99 | 19.05 | 18.80 | 18.59 | 18.87 | 18.61 | 18.81 | 18.13 | 18.34 | 20.96 | 19.72 | 18.91 | 18.79 | 18.52 |
| 85 | 351.21206665 | 16.90178680 | 0.048 | 1 | 21.39 | 19.59 | 19.38 | 19.17 | 18.73 | 18.62 | 18.33 | 18.22 | 18.03 | 17.91 | 17.89 | 17.79 | 17.67 | 17.55 | 17.29 | 20.60 | 19.01 | 18.05 | 17.89 | 17.62 |
| 86 | 351.21966553 | 16.53191757 | 0.059 | 3 | 19.22 | 20.53 | 19.63 | 19.52 | 19.03 | 19.04 | 19.05 | 18.67 | 18.57 | 18.56 | 18.40 | 18.33 | 18.17 | 18.28 | 18.47 | 24.55 | 19.46 | 18.71 | 18.36 | 18.12 |
| 87 | 351.22222900 | 16.40045166 | 0.017 | 1 | 19.30 | 99.00 | 19.30 | 19.94 | 19.47 | 19.41 | 19.31 | 19.02 | 18.90 | 18.56 | 18.72 | 18.73 | 18.60 | 18.16 | 18.12 | 22.09 | 19.75 | 19.01 | 18.69 | 18.38 |
| 88 | 351.24563599 | 16.71162224 | 0.047 | 3 | 20.25 | 19.46 | 18.89 | 18.53 | 18.23 | 18.14 | 17.91 | 17.86 | 17.61 | 17.62 | 17.55 | 17.47 | 17.40 | 17.09 | 17.14 | 19.66 | 18.42 | 17.82 | 17.50 | 17.35 |
| 89 | 351.24801636 | 17.16534615 | 0.024 | 1 | 23.67 | 20.18 | 19.45 | 19.96 | 19.62 | 19.56 | 19.20 | 19.13 | 18.91 | 18.95 | 18.70 | 18.55 | 18.52 | 18.26 | 17.96 | 21.47 | 19.93 | 19.07 | 18.62 | 18.38 |
| 90 | 351.26184082 | 16.57231903 | 0.023 | 3 | 18.84 | 20.03 | 20.31 | 20.80 | 20.38 | 20.48 | 19.75 | 19.87 | 19.41 | 19.58 | 19.46 | 19.47 | 18.72 | 19.29 | 99.00 | 21.78 | 20.48 | 19.83 | 19.44 | 19.17 |
| 91 | 351.26245117 | 16.52570343 | 0.024 | 1 | 99.00 | 99.00 | 21.90 | 21.17 | 20.25 | 20.81 | 20.70 | 19.87 | 19.49 | 20.36 | 19.56 | 19.69 | 19.63 | 99.00 | 19.79 | 21.82 | 20.60 | 19.96 | 19.81 | 19.55 |
| 92 | 351.27828979 | 16.76721191 | 0.044 | 1 | 19.06 | 18.34 | 17.96 | 17.76 | 17.63 | 17.57 | 17.44 | 17.36 | 17.19 | 17.24 | 17.24 | 17.11 | 17.04 | 16.98 | 17.24 | 19.02 | 17.72 | 17.33 | 17.13 | 17.03 |
| 93 | 351.28054810 | 16.81988525 | 0.029 | 1 | 19.76 | 21.59 | 19.68 | 19.32 | 19.33 | 19.17 | 18.97 | 19.06 | 18.78 | 19.34 | 18.74 | 18.81 | 18.52 | 19.08 | 19.11 | 20.63 | 19.61 | 19.02 | 18.82 | 18.59 |
| 94 | 351.30871582 | 16.44901848 | 0.024 | 2 | 18.91 | 19.99 | 19.60 | 19.39 | 19.18 | 19.07 | 18.98 | 18.66 | 18.48 | 18.47 | 18.37 | 18.25 | 18.15 | 17.96 | 18.00 | 19.73 | 19.32 | 18.69 | 18.27 | 18.02 |
| 95 | 351.31192017 | 16.55031013 | 0.017 | 1 | 19.12 | 20.74 | 19.24 | 18.62 | 18.41 | 18.37 | 17.88 | 17.83 | 17.64 | 17.57 | 17.59 | 17.47 | 17.42 | 17.29 | 17.33 | 20.57 | 18.61 | 17.81 | 17.50 | 17.33 |
| 96 | 351.36566162 | 17.25617027 | 0.048 | 7 | 99.00 | 20.54 | 21.00 | 20.06 | 19.55 | 19.86 | 19.31 | 19.08 | 19.26 | 19.51 | 19.51 | 19.36 | 18.81 | 19.88 | 19.17 | 20.47 | 19.86 | 19.60 | 19.51 | 19.08 |
| 97 | 351.40484619 | 17.24501801 | 0.037 | 2 | 20.47 | 20.04 | 19.57 | 19.46 | 19.07 | 19.01 | 18.73 | 18.61 | 18.37 | 18.26 | 18.23 | 17.94 | 17.97 | 18.00 | 18.11 | 21.97 | 19.22 | 18.56 | 18.25 | 18.03 |
| 98 | 351.41052246 | 16.57383156 | 0.048 | 3 | 20.84 | 20.53 | 20.54 | 19.65 | 19.35 | 19.23 | 99.00 | 18.92 | 18.79 | 18.55 | 18.84 | 99.00 | 18.38 | 18.14 | 18.30 | 20.70 | 19.60 | 18.88 | 18.54 | 18.24 |
| 99 | 351.41250610 | 17.13726997 | 0.045 | 3 | 20.05 | 19.68 | 19.11 | 19.24 | 18.84 | 18.54 | 18.43 | 18.31 | 18.14 | 18.18 | 17.83 | 17.90 | 17.80 | 17.93 | 17.88 | 26.46 | 19.04 | 18.33 | 17.97 | 17.69 |
| 100 | 351.42208862 | 16.75362396 | 0.029 | 1 | 19.70 | 20.91 | 20.45 | 19.74 | 19.97 | 19.86 | 19.42 | 19.17 | 19.08 | 19.25 | 18.85 | 99.00 | 18.47 | 18.67 | 19.07 | 21.26 | 20.19 | 19.20 | 18.86 | 18.47 |
| 101 | 351.42596436 | 16.77386093 | 0.039 | 4 | 19.45 | 19.22 | 20.35 | 19.36 | 19.23 | 19.17 | 18.87 | 19.01 | 18.88 | 18.52 | 18.62 | 99.00 | 18.30 | 18.49 | 18.30 | 20.22 | 19.36 | 18.88 | 18.56 | 18.54 |
| 102 | 351.42956543 | 16.78918457 | 0.046 | 3 | 19.33 | 23.81 | 20.52 | 20.13 | 19.69 | 19.60 | 19.31 | 19.47 | 19.41 | 19.18 | 19.42 | 99.00 | 18.68 | 18.80 | 19.43 | 21.38 | 20.04 | 19.38 | 18.97 | 18.86 |
| 103 | 351.43093872 | 16.47374535 | 0.048 | 3 | 19.44 | 23.05 | 20.24 | 19.95 | 19.51 | 19.50 | 19.02 | 19.08 | 18.80 | 18.71 | 18.94 | 99.00 | 18.46 | 18.86 | 18.50 | 21.30 | 19.84 | 19.16 | 18.86 | 18.53 |
| 104 | 351.45364380 | 16.79960823 | 0.018 | 2 | 99.00 | 99.00 | 19.24 | 19.30 | 19.18 | 19.10 | 18.81 | 18.77 | 18.66 | 18.29 | 18.40 | 99.00 | 18.18 | 17.97 | 17.96 | 20.85 | 19.39 | 18.67 | 18.35 | 18.08 |
| 105 | 351.45440674 | 16.41203117 | 0.029 | 7 | 19.82 | 19.38 | 19.05 | 19.26 | 19.08 | 18.99 | 18.90 | 19.03 | 18.79 | 18.89 | 18.90 | 99.00 | 18.67 | 18.62 | 18.37 | 21.07 | 19.22 | 18.97 | 18.79 | 18.68 |
| 106 | 351.46267700 | 16.88102722 | 0.058 | 3 | 99.00 | 20.35 | 20.28 | 19.93 | 19.58 | 19.59 | 19.24 | 19.39 | 19.26 | 19.57 | 19.22 | 99.00 | 18.70 | 19.15 | 19.89 | 23.66 | 19.82 | 19.35 | 19.09 | 19.06 |
4 Physical Properties of Regular Cluster A2589
4.1 Spatial Distribution
The X-ray images obtained in the ROSAT (Buote & Tsai, 1996) and (Buote & Lewis, 2004) observations support a picture that A2589 has a smooth X-ray morphology and no sign of ongoing merger. The optical map of cluster galaxies also shows no evidence of subclusters in A2589 (Beers et al., 1991). The projected distribution of the 68 member galaxies in sample I is given in Figure 10(a). In order to show the overall morphology of galaxy two-dimension distribution, we superpose the contour map of the surface density that has been smoothed by a Gaussian window with =3. It is easy to find that A2589 concentration is rather compact: more than 50% of bright known member galaxies are located within a small circular region with Mpc. The contour profiles tend to be more asymmetric at larger radius, but no detached clumps (i.e. substructures) of galaxies are detected. Figure 10(a) shows an elongation along the north-south direction, which seems to agree with the X-ray brightness profile and the orientation of central cD galaxy.
For the 174 member galaxies in sample II, the projected distribution is also given in Figure 10(b). We superpose the contour map of the spatial distribution that has been smoothed by a Gaussian window with . The filled circles denote the 68 member galaxies with known spectroscopic redshifts, and the open circles denote the 103 newly-selected member galaxies. Though the sample size increases by nearly 150%, the profile of surface density does not change a lot, with the same orientation and shape in central region, and no discrete substructure is detectable at a low surface density level of 0.14 arcmin-2.


4.2 Localized Velocity Structure
Projected distribution of galaxies appears smooth and relaxed, which might be due to projection effect. A true substructure should be verified in the line-of-sight velocity space. The -test has been commonly used for this purpose, which was developed by Colless & Dunn (1996) for quantifying localized variation in velocity distribution. A test statistic is defined to characterize the local deviation on the scale of the groups of n nearest neighbors based on the Kolmogorov-Smirnov test (KS-test). Larger means greater possibility that the local velocity distribution differs from the whole distribution. The probability that is larger than the observed value, P(), can be estimated by Monte Carlo simulations by randomly shuffling velocities. Table 4 gives the results of the -test for samples I and II, and the 103 simulations are made for all cases. A limit of P() for substructure detection is 5%, corresponding to the significance. For the 68 member galaxies in sample I, the probability P() is found to be about 80% (much more than the limit 5%) in a wide range of neighbor size, which strongly supports non-detection of substructure. Even for the enlarged sample of 174 member galaxies, the probability P() is still over 16% which is greater by two times than the limit 5%. No substructures are detected at more than significance on the basis of sample II.
Figure 11 shows the bubble plots of the localized velocity variation, using the neighbor size for both samples. The bubble size for each galaxies is proportional to log[PKS(DDobs)]. Therefore, the larger bubbles indicate a greater difference between local and overall velocity distributions. There is no prominent bubble clustering in the core region of A2589. For the 68 spectroscopic galaxies in sample I, the central bubbles are very tiny, indicating that the local velocity distribution is in well accordance with the overall one. Even for the enlarged sample II, bubble clustering at center is still neglectable. A close comparison between the projected distribution (in Figure 10) and bubble plot (in Figure 11) shows that A2589 is a well-relaxed cluster with no dynamic substructures detected both in 2-d mapping and in radial velocity space.
An elongation along the north-south direction has been unveiled in Figure 10. To make certain of whether there exists a substructure located about 10 arcmin south to the main concentration, we further apply a currently favored technique of mixture modeling, namely the KMM algorithm, to the samples I and II. The KMM is a maximum-likelihood algorithm which assigns objects into groups and assesses the improvement in fitting a multi-group over a single group model (Ashman et al. 1994). Based on the three-dimension data (i.e., projected positions and radial velocities of member galaxies), we set the initial positions: (0.0, 0.0) for the main concentration and (-2.0, -11.0) for the possible substructure, and the initial mean velocities are 12050 for two clumps. The KMM algorithm gives following optimum two-group solutions: only three galaxies in sample I are assigned as the members of southern substructure, and only five galaxies in sample II are allocated to the substructure. This means the southern anormal feature in projected mapping is not a significant substructure, which supports the conclusion drawn by the -test that no significant dynamic substructures are found in A2589.


| Neighbor size | Sample I | Sample II |
|---|---|---|
| () | () | |
| 6……… | 84.8% | 17.8% |
| 7……… | 85.9% | 21.4% |
| 8……… | 81.9% | 13.8% |
| 9……… | 87.8% | 14.5% |
| 10……. | 85.2% | 21.7% |
| 11……. | 85.9% | 31.2% |
| 12……. | 79.9% | 49.2% |
4.3 Luminosity Function
The luminosity function (LF) is a fundamental tool to analyze the properties of galaxies in a cluster. Usually, a Gaussian function can be used to describe the LF of bright galaxies with (Binggeli et al., 1988) , where is the characteristic absolute magnitude, and is the dispersion. For the faint galaxies with , a Schechter function is needed to give a better fit (Schechter, 1976): , where , , and are the normalization parameter, the characteristic absolute magnitude, and the slope at faint end, respectively. For the cluster galaxies, a single Schechter function can not give a perfect description for the LFs (Driver et al., 1994; Mohr et al., 1996; Trentham & Tully, 2002; Yang et al., 2004). Ferguson & Sandage (1991) performed a LF fitting with these two functions.
For comparing with previous results, the BATC magnitudes are converted into the conventional Kron-Cousins magnitudes via the equations in Zhou et al. (2003). The magnitudes in sample II cover a range from to mag, and a turn-off point at is found in magnitude distribution. We use the combination of above two functions to describe the LFs of galaxies in A2589: a Gaussian function for the bright galaxies, and a Schechter function for the faint galaxies. The fitting results in a Gaussian function with , =, and a Schechter function with , . The combination of two functions gives a good description for the LFs of A2589 (see Figure 12).
Though the uncertainty in member selection might be larger for faint galaxies, the LF peak at and dip at might be real because the BATC photometry is capable for detecting the galaxies brighter than 19.5 mag. With the clear peak at , the bright part LF of A2589 looks similar with the LF of rich clusters, which have a bump in bright part (Biviano et al., 1995). Our turn-off magnitude is similar to the LFs in A963 (Driver et al., 1994), Coma (Thompson & Gregory, 1993), and A2554 (Smith et al., 1997). For the LF slope at faint parameter , A2589 has a flat slope than many rich clusters, which might be due to the incompleteness in selection of faint members.
Following the definition of dwarf-to-giant ratio in Driver et al. (1998), we define the faint-to-bright ratio (FBR) as the count ratio of faint galaxies to bright galaxies, = . The overall is about 0.84. It is found that the varies with clustercentric radius: in central region (0.5Mpc), and in outer region ( 0.5Mpc). The increasing tendency of the FBR along radial distance is presented in Figure 13. Obviously, the LF faint end is dominated by faint/dwarf galaxies, which can be interpreted by the ‘dwarf population density’ relation (Phillipps et al., 1998): dwarves are more common in the low density environment. This segregation may originate from initial conditions of formation of dwarf galaxies, where low luminosity galaxies are only now in-falling into clusters (Croton et al., 2005), or the galaxies may have suffered the processes internal to clusters, such as tidal disruption and galaxy harassment (Mastropietro et al., 2005; Aguerri, 2004, 2005), consequently dimmed.


4.4 Star Formation Properties of Cluster Galaxies
The star formation histories of the member galaxies can provide important clues for understanding the evolution of their host cluster. For a cluster galaxy, both the cluster-scale gravity environment and the galaxy-scale interaction may have influenced the physical processes concerning star formation. Therefore, it is interesting to observe the systematic tendency of the star formation properties for the galaxies in a cluster.
With an evolution synthesis model, PEGASE (version 2.0, Fioc & Rocca-Volmerange (1997, 1999)), the star formation properties of A2589 are investigated. We assume a Salpeter (1955) initial mass function (IMF) and a star formation rate (SFR) in exponentially decreasing form, , where the time scale ranges from 0.5 to 30.0 Gyr. To avoid the degeneracy between age and metallicity in the model, we use the same age of 12.86 Gyr for all the member galaxies in A2589, responding to the age of the first generation stars at =0.0414. A zero initial metallicity of interstellar medium (ISM) is assumed. Firstly, a series of rest-frame modeled spectra at z=0 with various star formation histories are generated by running the PEGASE code. Then we shift them to the observer’s frame for a given redshift, and then convolve with the transmission functions of the BATC and SDSS filters. As a result, we obtain the template SED library containing the BATC and SDSS photometric bands.
Based on the template SED library, we search for the minimal fit of the observed SEDs of 68 bright member galaxies with known spectroscopic redshifts. The SFR time scale (), mean ISM metallicity (ZISM), and the mean stellar age () weighted by mass and light can be achieved.
Figure 14 shows the star formation properties as a function of the projected radius (R) for 68 member galaxies in sample I. The dash lines denote the best linear fitting results. Panel (a) shows that the SFR time scale is shorter in the inner region than that in the outer region. This result agrees with the morphology-density relation pointed out by Dressler (1980), which can be well explained in the context of hierarchical cosmological scenario (Poggianti, 2004). Panel (b) presents that the outlier galaxies have higher probability to have a lower metallicity, which is consistent with the pictures that more massive galaxies form fractionally more stars in a Hubble time than the low-mass counterparts, and metals are selectively lost from the faint galaxies with shallow potential wells via galactic winds (Tremonti et al., 2004). Panels (c) and (d) show that the galaxies in the core region tend to possess older stellar population with longer mean stellar ages weighted by either mass or light. Comparison between panels (c) and (d) shows that the gradient of the light-weighted stellar age is steeper. After the evolution of galaxies, stellar mass are dominated by old stellar population with dimmed light. On the other hand, current star formation rate in a cluster is mainly contributed by the late-type galaxies in the outer region, and younger stellar population has a greater weight in mean age calculation. It is reasonable that the stellar ages weighted by bolometric luminosity tend to be younger for the outlier galaxies.

Figure 15 gives the SFR time scale and the ISM metallicities as a function of absolute magnitude (MR). The high luminosity galaxies tend to have shorter time scales. For the bright and massive cluster galaxies in the core region of A2589, their star formation activities might have been reduced by many different physical process via environmental effects, such as galaxy-galaxy interaction, harassment, gas stripping, strangulation (Poggianti, 2004; Yuan et al., 2005), which results in a short time scale of star formation.


5 Summary
We present our multicolor optical photometry for the nearby regular cluster of galaxies A2589, based on the BATC 15-intermediate bands system and SDSS photometric data. The SEDs in 15 bands are obtained for more than 5000 sources detected from 1 deg2 of the BATC images. After cross-identifying the BATC sources with the SDSS photometric catalog, 1199 galaxies are extracted. An interpolation method is performed to make zero-point correction, the combined 20-band SEDs for 1199 galaxies are archived. Then, a photometric redshift technique and the CM relation of early-type galaxies are applied to select fainter member galaxies. As a result, 106 galaxies are selected as the faint member galaxies. Combining 68 member galaxies with known spectroscopic redshifts (i.e., sample I) , we obtain an enlarged sample of 174 member galaxies (i.e., sample II).
The projected distribution shows no prominent clumps. The contour of surface density shows an north-south elongation, which agrees with the X-ray brightness profile and the orientation of central cD galaxy, NGC 7647. Subsequential -test also indicates no substructure in the galaxy cluster A2589, which agrees with the X-ray images by (Buote & Tsai, 1996) and Chandra (Buote & Lewis, 2004). Our conclusion is that A2589 is a well-virialized and relaxed system.
The luminosity function of member galaxies in A2589 shows a peak at and a dip at MR . Compared with other clusters, the turn-off point seems to be independent on the richness and dynamic stage. The faint-bright-ratio (FBR) increases monotonously along clustercentric distance, indicating that the faint and dwarf galaxies tend to be located in the outer region of cluster.
The star formation properties of cluster galaxies unveils an environmental influence on evolution of A2589. Bright and massive galaxies in the core region are found to have shorter SFR time scales, longer mean stellar ages, and higher mean ISM metallicities, while the outlier galaxies are likely to have smaller stellar ages, and longer SFR time scales. These results can be well interpreted by the existing correlations, such as the morphology-density relation, the luminosity-metallicity relation, and the mass-metallicity relation.
References
- Abell (1958) Abell, G. O. 1958, ApJS, 3, 211
- Adami et al. (2009) Adami, C., et al. 2009, A&A, 507, 1225
- Aguerri (2004) Aguerri, J. A. L., Iglesias-Paramo, J., Vilchez, J. M., & Muñoz-Tuñón, C. 2004, AJ, 127, 1344
- Aguerri (2005) Aguerri, J. A. L., Gerhard, O. E., Arnaboldi, M., Napolitano, N. R., Castro-Rodriguez, N., & Freeman, K. C. 2005, AJ, 129, 2585
- Allen (1976) Allen, D. A. 1976, MNRAS, 174, 29P
- Arnouts et al. (1999) Arnouts, S., et al. 1999, MNRAS, 310, 540
- Ashman et al. (1994) Ashman, K. M., Bird, C. M., & Zept, S. E. 1994, AJ, 108, 2348
- Bahcall (1996) Bahcall, N. A. 1996, arXiv:astro-ph/9612046
- Bauer et al. (2000) Bauer, F. E., Condon, J. J., Thuan, T. X., & Broderick, J. J. 2000, ApJS, 129, 547
- Bautz & Morgan (1970) Bautz, L. P., & Morgan, W. W. 1970, ApJ, 162, L149
- Beers et al. (1990) Beers, T. C., Flynn, K., & Gebhardt, K. 1990, AJ, 100, 32
- Beers et al. (1991) Beers, T. C., Gebhardt, K., Forman, W., Huchra, J. P., & Jones, C. 1991, AJ, 102, 1581
- Bekki (2001) Bekki, K. 2001, Ap&SS, 276, 1033
- Binggeli et al. (1988) Binggeli, B., Sandage, A., & Tammann, G. A. 1988, ARA&A, 26, 509
- Biviano et al. (1995) Biviano, A., Durret, F., Gerbal, D., Le Fevre, O., Lobo, C., Mazure, A., & Slezak, E. 1995, A&A, 297, 610
- Bolzonella et al. (2000) Bolzonella, M., Miralles, J.-M., & Pelló, R. 2000, A&A, 363, 476
- Bothun & Schombert (1988) Bothun, G. D., & Schombert, J. M. 1988, ApJ, 335, 617
- Bower et al. (1992) Bower, R. G., Lucey, J. R., & Ellis, R. S. 1992, MNRAS, 254, 589
- Bower & Balogh (2004) Bower, T. C., Balogh, M. L., 2004, in Clusters of Galaxies: probe of cosmological structure and galaxy evolution, p.326. eds. J. S. Mulchaey, A. Dressler, A. Oemler, Cambridge University press
- Bruzual & Charlot (1993) Bruzual A., G., & Charlot, S. 1993, ApJ, 405, 538
- Buote & Lewis (2004) Buote, D. A., & Lewis, A. D. 2004, ApJ, 604, 116
- Buote & Tsai (1996) Buote, D. A., & Tsai, J. C. 1996, ApJ, 458, 27
- Burns et al. (1994) Burns, J. O., Rhee, G., Owen, F. N., & Pinkney, J. 1994, ApJ, 423, 94
- Capelato et al. (1991) Capelato, H. V., Mazure, A., Proust, D., Vanderriest, C., Lemonnier, J. P., & Sodre, L., Jr. 1991, A&AS, 90, 355
- Cen & Ostriker (1994) Cen, R., & Ostriker, J. 1994, ApJ, 429, 4
- Colless & Dunn (1996) Colless, M., & Dunn, A. M. 1996, ApJ, 458, 435
- Croton et al. (2005) Croton, D. J., et al. 2005, MNRAS, 356, 1155
- David et al. (1996) David, L. P., Jones, C., & Forman, W. 1996, ApJ, 473, 692
- Dressler (1980) Dressler, A. 1980, ApJS, 42, 565
- Driver et al. (1994) Driver, S. P., Phillipps, S., Davies, J. I., Morgan, I., & Disney, M. J. 1994, MNRAS, 268, 393
- Driver et al. (1998) Driver, S. P., Couch, W. J., & Phillipps, S. 1998, MNRAS, 301, 369
- Evrard (1989) Evrard, A. E. 1989, ApJ, 341, L71
- Fan et al. (1996) Fan, X., et al. 1996, AJ, 112, 628
- Ferguson & Sandage (1991) Ferguson, H. C., & Sandage, A. 1991, AJ, 101, 765
- Fioc & Rocca-Volmerange (1997) Fioc, M., & Rocca-Volmerange, B. 1997, A&A, 326, 950
- Fioc & Rocca-Volmerange (1999) Fioc, M., & Rocca-Volmerange, B. 1999, A&A, 351, 869
- Forman & Jones (1982) Forman, W., & Jones, C. 1982, ARA&A, 20, 547
- Frenk et al. (1990) Frenk, C. S., White, S. D. M., Efstathiou, G., & Davis, M. 1990, ApJ, 351, 10
- Frenk et al. (1996) Frenk, C. S., et al. 1996, ApJ, 472, 146
- Furusawa et al. (2000) Furusawa, H., Shimasaku, K., Doi, M., & Okamura, S. 2000, ApJ, 534, 624
- Gunn & Stryker (1983) Gunn, J. E., & Stryker, L. L. 1983, ApJS, 52, 121
- Haynes et al. (1997) Haynes, M. P., Giovanelli, R., Herter, T., Vogt, N. P., Freudling, W., Maia, M. A. G., Salzer, J. J., & Wegner, G. 1997, AJ, 113, 1197
- Henry & Briel (1993) Henry, J. P., & Briel, U. G. 1993, Advances in Space Research, 13, 191
- Jenkner et al. (1990) Jenkner, H., Lasker, B. M., Sturch, C. R., McLean, B. J., Shara, M. M., & Russel, J. L. 1990, AJ, 99, 2082
- Kambas et al. (2000) Kambas, A., Davies, J. I., Smith, R. M., Bianchi, S., & Haynes, J. A. 2000, AJ, 120, 1316
- Lanzetta et al. (1996) Lanzetta, K. M., Yahil, A., & Fernández-Soto, A. 1996, Nature, 381, 759
- Lupton (2005) Lupton, R. 2005, http://www.sdss.org/dr5/algorithms/sdssUBVRITransform.html
- Mastropietro et al. (2005) Mastropietro, C., Moore, B., Mayer, L., Debattista, V. P., Piffaretti, R., & Stadel, J. 2005, MNRAS, 364, 607
- Mccarthy et al. (2004) McCarthy, I. G., Balogh, M. L., Babul, A., Poole, G. B., & Horner, D. J. 2004, ApJ, 613, 811
- Mihos (2004) Mihos, J. C., 2004, in Cluster of Galaxies: probe of cosmological structure and galaxy evolution, p.278, eds. J. S. Mulchaey, A. Dressler, A. Oemler, Cambridge University press
- Mohr et al. (1996) Mohr, J. J., Geller, M. J., Fabricant, D. G., Wegner, G., Thorstensen, J., & Richstone, D. O. 1996, ApJ, 470, 724
- Moore, Lake & Katz (1998) Moore, B., Lake, G., & Katz, N. 1998, ApJ, 495, 139
- Navarro & White (1994) Navarro, J. F., & White, S. D. M. 1994, MNRAS, 267, 401
- Neumann et al. (2003) Neumann, D. M., Lumb, D. H., Pratt, G. W., & Briel, U. G. 2003, A&A, 400, 811
- Phillipps et al. (1998) Phillipps, S., Driver, S. P., Couch, W. J., & Smith, R. M. 1998, ApJ, 498, L119
- Poggianti (2004) Poggianti, B. 2004, Proceedings of “Baryons in Dark Matter Halos”. Novigrad Croatia, 5-9 Oct 2004. Editors: R. Dettmar, U. Klein, P. Salucci. Published by SISSA, Proceeding of Science, p.104.1
- Quilis et al. (2000) Quilis, V., Moore, B., & Bower, R. 2000, Science, 288, 1617
- Rhee & Latour (1991) Rhee, G. F. R. N., & Latour, H. J. 1991, A&A, 243, 38
- Roettiger et al. (1996) Roettiger, K., Burns, J. O., & Loken, C. 1996, ApJ, 473, 651
- Salpeter (1955) Salpeter, E. E. 1955, ApJ, 121, 161
- Salvador-Sole et al. (1993) Salvador-Sole, E., Gonzalez-Casado, G., & Solanes, J. M. 1993, ApJ, 410, 1
- Sarazin et al. (1992) Sarazin, C. L., O’Connell, R. W., & McNamara, B. R. 1992, ApJ, 397, L31
- Schechter (1976) Schechter, P. 1976, ApJ, 203, 297
- Smith et al. (1997) Smith, R. M., Driver, S. P., & Phillipps, S. 1997, MNRAS, 287, 415
- Smith et al. (2004) Smith, R. J., et al. 2004, AJ, 128, 1558
- Stetson (1987) Stetson, P. B. 1987, PASP, 99, 191
- Struble & Rood (1999) Struble, M. F., & Rood, H. J. 1999, ApJS, 125, 35
- Thompson & Gregory (1993) Thompson, L. A., & Gregory, S. A. 1993, AJ, 106, 2197
- Tremonti et al. (2004) Tremonti, C. A., et al. 2004, ApJ, 613, 898
- Trentham & Tully (2002) Trentham, N., & Tully, R. B. 2002, MNRAS, 335, 712
- Wegner et al. (1999) Wegner, G., Colless, M., Saglia, R. P., McMahan, R. K., Davies, R. L., Burstein, D., & Baggley, G. 1999, MNRAS, 305, 259
- White et al. (1993) White, S. D. M., Briel, U. G., & Henry, J. P. 1993, MNRAS, 261, L8
- Xia et al. (2002) Xia, L., et al. 2002, PASP, 114, 1349
- Yan et al. (2000) Yan, H., et al. 2000, PASP, 112, 691
- Yang et al. (2004) Yang, Y, et al. 2004, AJ, 600, 141
- Yuan et al. (2001) Yuan, Q., et al. 2001 AJ, 122, 1718
- Yuan et al. (2003) Yuan, Q., Zhou, X., & Jiang, J. 2003, ApJS, 149, 53
- Yuan et al. (2005) Yuan, Q., Zhao, L., & Yang, Y., et al. 2005, AJ, 130, 255
- Zhang et al. (2010) Zhang, L., Yuan, Q., & Zhou, X., et al. 2010, RAA, 10,1
- Zhou et al. (1999) Zhou, X., et al. 1999, PASP, 111, 909
- Zhou et al. (2001) Zhou, X., et al. 2001, Chinese J. Astron. Astrophys., 1, 372
- Zhou et al. (2003) Zhou, X., et al. 2003, A&A, 397, 361