The near-infrared broad emission line region of active galactic nuclei – II. The one-micron continuum
Abstract
We use quasi-simultaneous near-infrared (near-IR) and optical spectroscopy from four observing runs to study the continuum around 1 m in 23 well-known broad-emission line active galactic nuclei (AGN). We show that, after correcting the optical spectra for host galaxy light, the AGN continuum around this wavelength can be approximated by the sum of mainly two emission components, a hot dust blackbody and an accretion disc. The accretion disc spectrum appears to dominate the flux at m, which allows us to derive a relation for estimating AGN black hole masses based on the near-IR virial product. This result also means that a near-IR reverberation programme can determine the AGN state independent of simultaneous optical spectroscopy. On average we derive hot dust blackbody temperatures of K, a value close to the sublimation temperature of silicate dust grains, and relatively low hot dust covering factors of . Our preliminary variability studies indicate that in most sources the hot dust emission responds to changes in the accretion disc flux with the expected time lag, however, a few sources show a behaviour that can be attributed to dust destruction.
keywords:
galaxies: active – galaxies: nuclei – infrared: galaxies – quasars: general1 Introduction
The broad emission line region (BELR) of active galactic nuclei (AGN) is one of the most direct tracers of the immediate environment of supermassive black holes. However, despite decades of intensive optical and ultraviolet (UV) spectrophotometric studies its geometry and kinematics remain ill-defined (see, e.g., review by Sulentic et al., 2000). Our current, limited knowledge of its physical condition and scale was gained primarily through the application of photoionisation models (see, e.g., review by Ferland, 2003) and through reverberation mapping studies (see, e.g., review by Peterson, 1993). We have started to extend these studies to near-infrared (near-IR) wavelengths. In Landt et al. (2008, hereafter Paper I) we outlined the rationale of our programme, presented the observations of the first three epochs and addressed briefly some of the important issues regarding the physics of the most prominent broad emission lines. Here we present the fourth epoch of observation and investigate the continuum around the 1 m inflection point.
The AGN spectral continuum region around the rest-frame wavelength of m is believed to sample simultaneously two important emission components, namely, the accretion disc (e.g., Malkan & Sargent, 1982; Malkan, 1983) and the hottest part of the putative dusty torus (e.g., Barvainis, 1987; Neugebauer et al., 1987). However, although it is assumed to be understood, it has not yet been sampled spectroscopically in its entirety. By probing the long-wavelength end of the accretion disc spectrum (Kishimoto et al., 2005; Kishimoto et al., 2008) such an investigation has the potential to solve the discrepancy often found between theoretical models and observations (see, e.g., review by Koratkar & Blaes, 1999). Furthermore, since the accretion disc most likely illuminates directly the inner parts of the dust structure, monitoring the change in spectral flux and slope of these two emission components relative to each other can constrain the location and geometry of the obscurer. So far, only few sources have been observed in dust reverberation programmes (e.g., Glass, 1992; Nelson, 1996; Oknyanskij et al., 1999; Glass, 2004; Minezaki et al., 2004; Suganuma et al., 2006; Koshida et al., 2009).
The paper is organised as follows. In Section 2 we briefly introduce the sample and discuss the observations. In Section 3 we derive pure AGN continuum spectral energy distributions (SEDs), based on which we constrain the individual continuum components (Section 4). The variability of these components is disussed in Section 5. Finally, in Section 6 we summarize our main results and present our conclusions. Throughout this paper we have assumed cosmological parameters km s-1 Mpc-1, , and .
2 The observations
| Object Name | observation | exposure | airmass | continuum S/N | telluric standard star | ||||
| date | [sec] | J | H | K | name | distance | airmass | ||
| [deg] | |||||||||
| (1) | (2) | (3) | (4) | (5) | (6) | (7) | (8) | (9) | (10) |
| Mrk 335 | 2007 Jan 25 | 32x120 | 1.431 | 33 | 110 | 272 | HD1160 | 16.1 | 1.977 |
| Mrk 590 | 2007 Jan 24 | 58x120 | 1.214 | 37 | 122 | 143 | HD13936 | 10.2 | 1.697 |
| Ark 120 | 2007 Jan 26 | 48x120 | 1.162 | 187 | 226 | 436 | HD34317 | 1.8 | 1.054 |
| Mrk 79 | 2007 Jan 25 | 48x120 | 1.334 | 97 | 202 | 448 | HD45105 | 12.6 | 1.128 |
| PG 0844349 | 2007 Jan 24 | 48x120 | 1.138 | 99 | 170 | 259 | HD71906 | 4.2 | 1.271 |
| Mrk 110 | 2007 Jan 26 | 48x120 | 1.449 | 61 | 148 | 452 | HD71906 | 17.8 | 1.368 |
| NGC 3227 | 2007 Jan 25 | 16x120 | 1.339 | 57 | 94 | 146 | HD89239 | 7.6 | 1.122 |
| NGC 4151 | 2007 Jan 24 | 8x120 | 1.446 | 15 | 54 | 113 | HD109615 | 4.9 | 1.398 |
| 3C 273 | 2007 Jan 25 | 40x120 | 1.060 | 123 | 343 | 347 | HD109309 | 11.6 | 1.199 |
| HE 1228013 | 2007 Jan 25 | 48x120 | 1.370 | 40 | 101 | 274 | HD109309 | 10.7 | 1.242 |
| NGC 4593 | 2007 Jan 24 | 8x120 | 1.446 | 43 | 123 | 191 | HD112304 | 10.8 | 1.540 |
| NGC 5548 | 2007 Jan 24 | 16x120 | 1.319 | 57 | 73 | 145 | HD131951 | 14.0 | 1.299 |
| Mrk 817 | 2007 Jan 26 | 40x120 | 1.509 | 98 | 224 | 323 | HD121409 | 7.8 | 1.480 |
The columns are: (1) object name; (2) observation date; (3) exposure time; (4) average airmass; S/N in the continuum over Å measured at the central wavelength of the (5) J, (6) H, and (7) K band; for the star used to correct for telluric absorption (8) name, (9) distance from the source, and (10) average airmass.
| Object Name | IRTF | observation | exposure | airmass | cloud |
|---|---|---|---|---|---|
| observation | date | [sec] | condition | ||
| date | |||||
| (1) | (2) | (3) | (4) | (5) | (6) |
| Mrk 335 | 2007 Jan 25 | 2007 Jan 24 | 2x300 | 1.38 | clear |
| Mrk 590 | 2007 Jan 24 | 2007 Jan 24 | 2x720 | 1.21 | clear |
| Ark 120 | 2007 Jan 26 | 2007 Feb 08 | 2x480 | 1.18 | cirrus |
| Mrk 79 | 2007 Jan 25 | 2007 Jan 22 | 2x480 | 1.12 | clear |
| PG 0844349 | 2007 Jan 24 | 2007 Jan 22 | 2x480 | 1.03 | clear |
| Mrk 110 | 2007 Jan 26 | 2007 Jan 22 | 2x420 | 1.08 | clear |
| NGC 3227 | 2007 Jan 25 | 2007 Jan 22 | 2x180 | 1.02 | clear |
| NGC 4151 | 2007 Jan 24 | 2007 Feb 12 | 2x 90 | 1.07 | cloudy |
| 3C273 | 2007 Jan 25 | 2007 Feb 12 | 2x300 | 1.25 | cloudy |
| HE 1228013 | 2007 Jan 25 | 2007 Feb 12 | 2x480 | 1.30 | cloudy |
| NGC 4593 | 2007 Jan 24 | 2007 Feb 17 | 2x270 | 1.27 | cirrus |
| NGC 5548 | 2007 Jan 24 | 2007 Feb 17 | 2x270 | 1.02 | cirrus |
| Mrk 817 | 2007 Jan 26 | 2007 Feb 17 | 2x360 | 1.13 | cirrus |
The columns are: (1) object name; (2) IRTF observation date (reproduced from Table 1); (3) Tillinghast UT observation date; (4) exposure time; (5) average airmass; and (6) cloud condition.
The target selection, observational strategy, and data reduction procedures have been described in detail in Paper I. In short, we obtained for a sample of 23 well-known relatively nearby () and bright ( mag) broad-emission line AGN during four observing runs contemporaneous (within two months) near-IR and optical spectroscopy. The observations were carried out between 2004 May and 2007 January with a single object being typically observed twice within this period.
In the near-IR we used the SpeX spectrograph (Rayner et al., 2003) at the NASA Infrared Telescope Facility (IRTF), a 3 m telescope on Mauna Kea, Hawai’i. We chose the short cross-dispersed mode (SXD, m) and a short slit of . The optical spectra were obtained with the FAST spectrograph (Fabricant et al., 1998) at the Tillinghast 1.5 m telescope on Mt. Hopkins, Arizona, using the 300 l/mm grating and a long-slit, resulting in a wavelength coverage of Å.
3 AGN spectral energy distributions


Our aim is to study the spectral shape of the AGN continuum over the entire observed frequency range and how it changes as the AGN flux varies. For this purpose we need to isolate the spectrum of the pure AGN and ensure an acceptable relative photometry between epochs. In practice this means that we need to subtract the flux of the underlying host galaxy and correct the individual spectra for flux calibration errors (e.g., varying weather conditions, aperture and seeing effects). In the absence of short-term variability, these steps should yield an alignment between the AGN optical and near-IR spectral parts.
In principle, accurate (within a few per cent) relative photometry of the spectra can be achieved a posteriori by using the fact that the narrow emission line fluxes of AGN are constant over several years (Peterson, 1988, 1993). However, this requires that the observations were performed under similar conditions, i.e., using the same aperture and slit position angle and having the same seeing. In general, these requirements were not met for our optical observations, which were obtained in service-mode under widely varying weather conditions. On the other hand, the near-IR spectra were obtained uniformly during four separate epochs, with one of them (2006 June) having photometric weather conditions throughout. In addition, the much better seeing achieveable in the near-IR relative to the optical band allowed us to use a relatively small slit for these spectra, which minimized the contamination by host galaxy light.
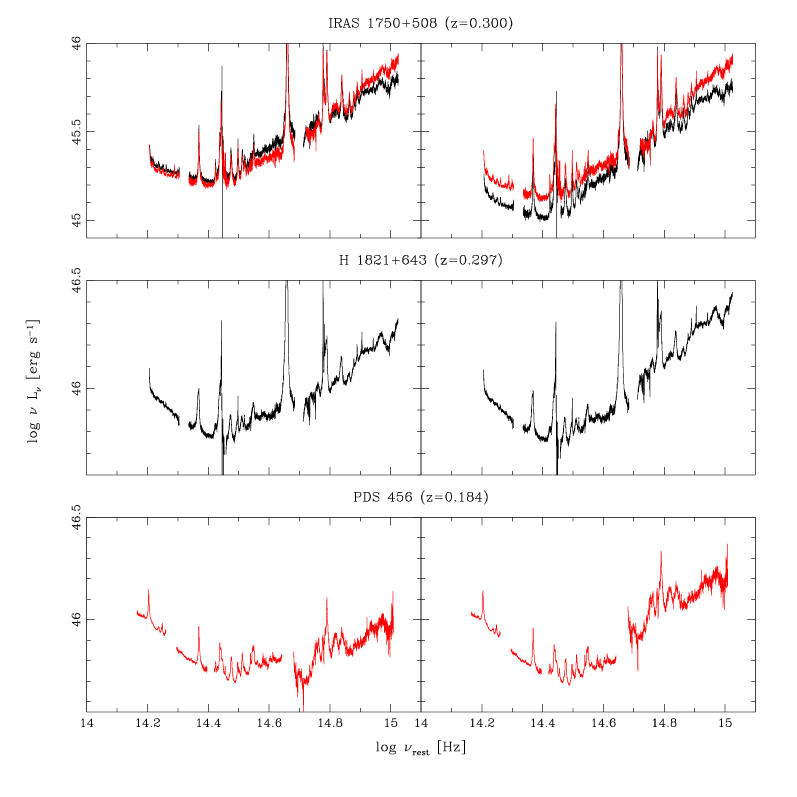
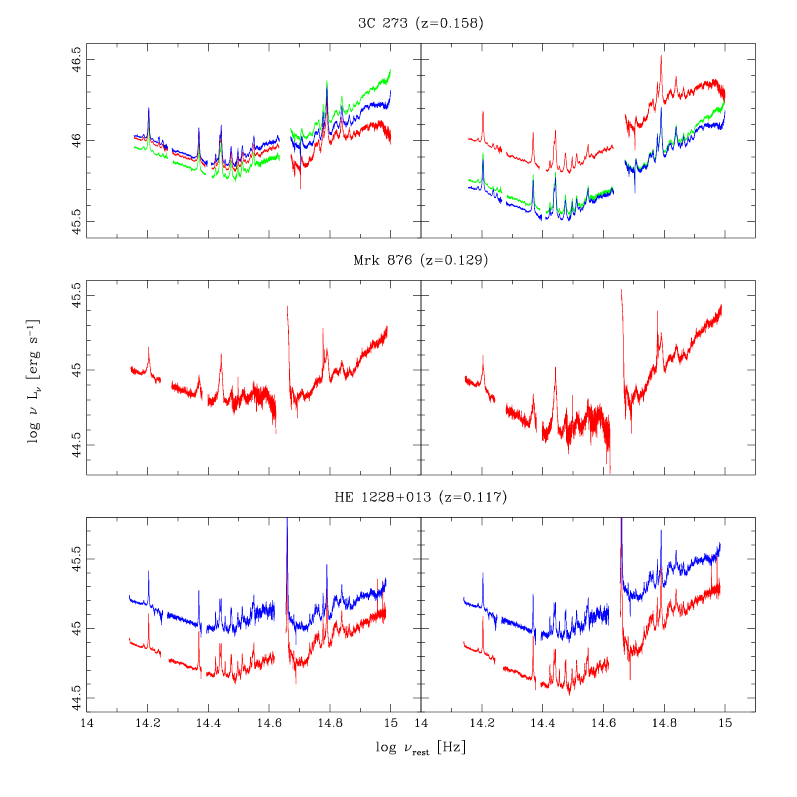
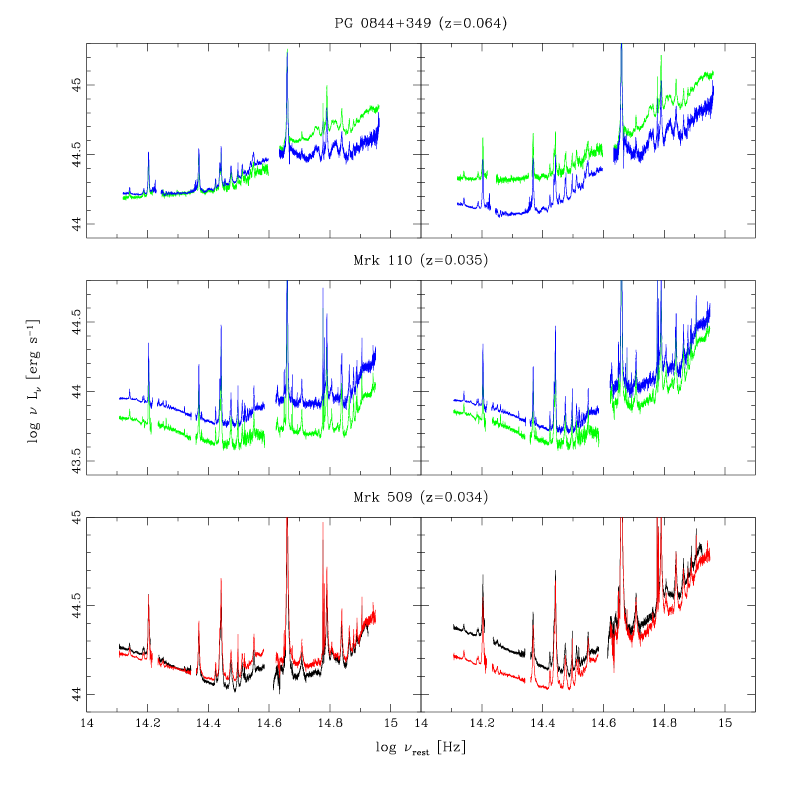
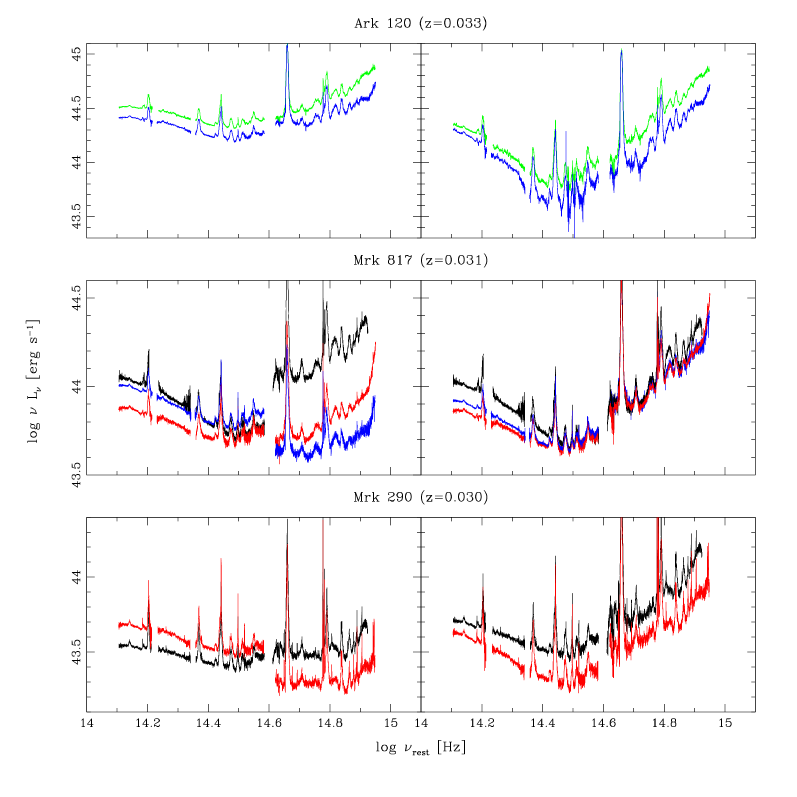
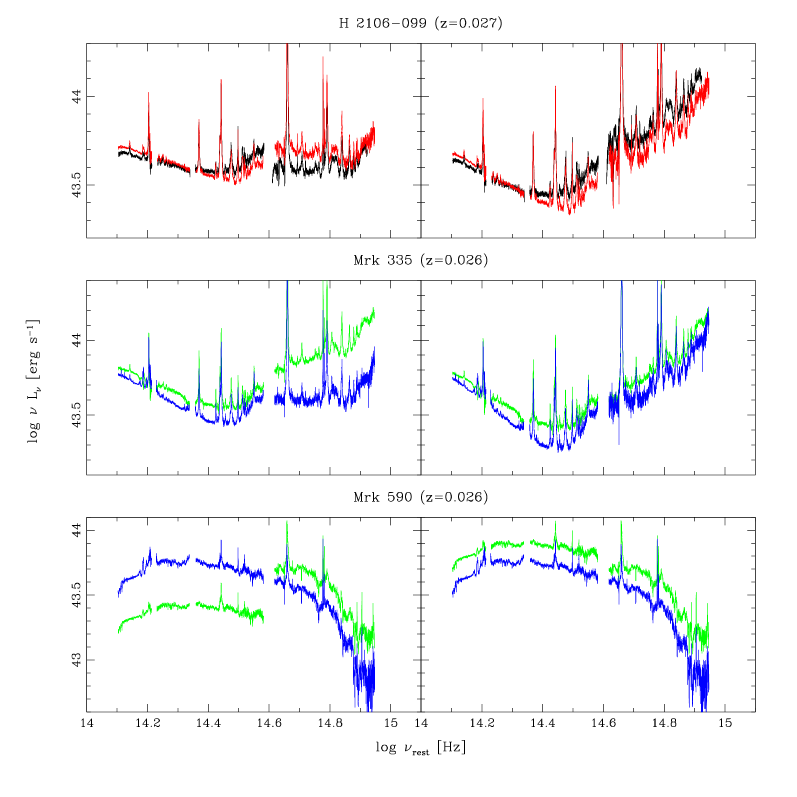
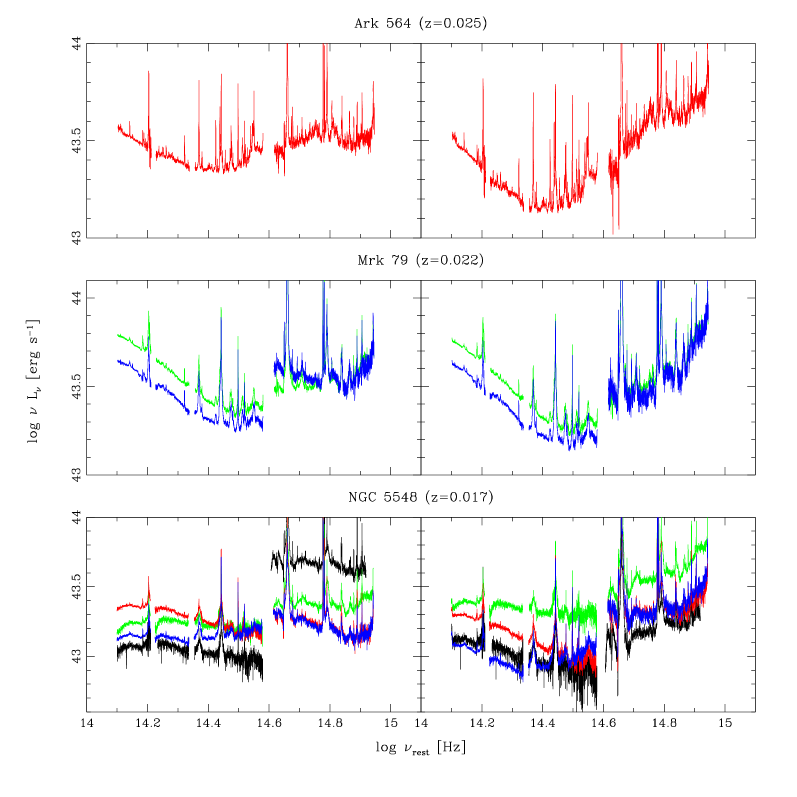
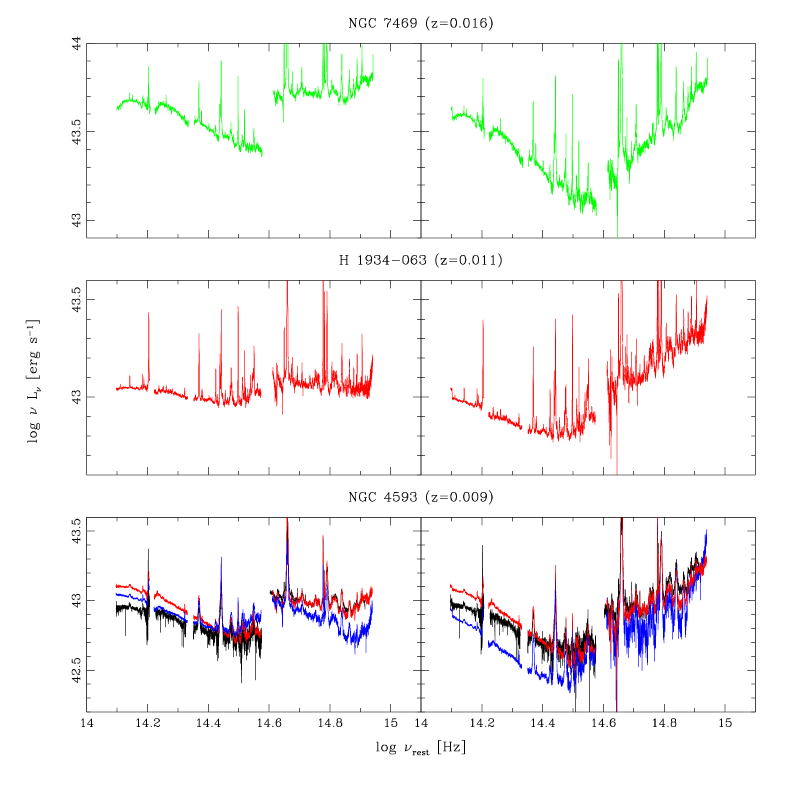
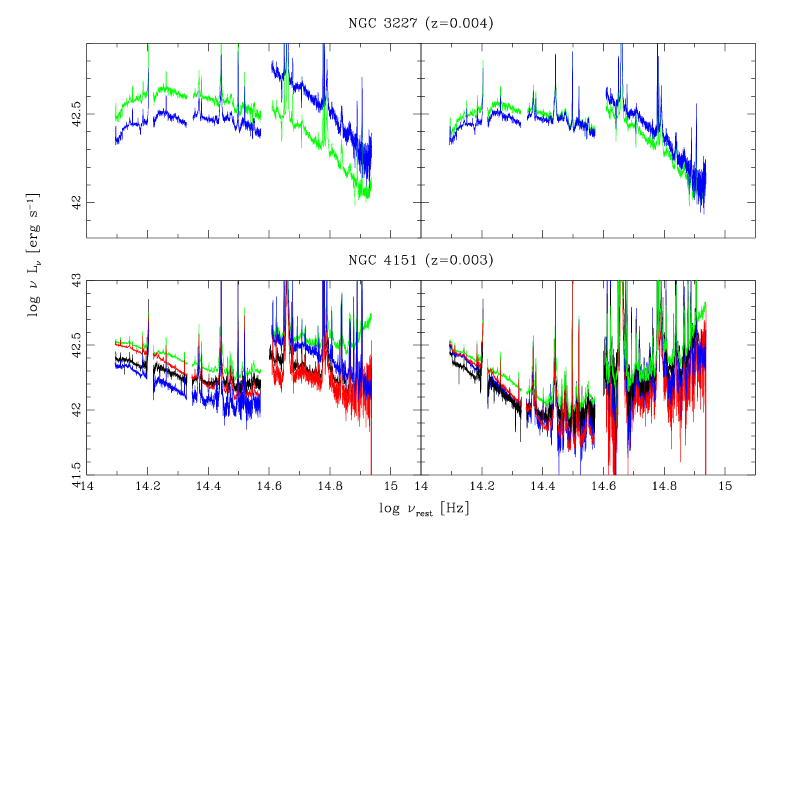
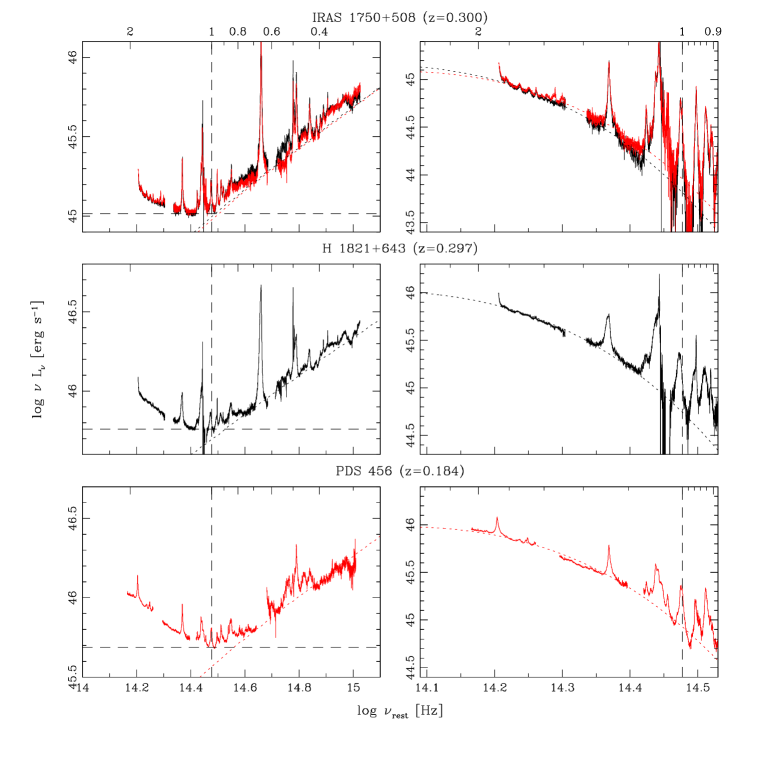
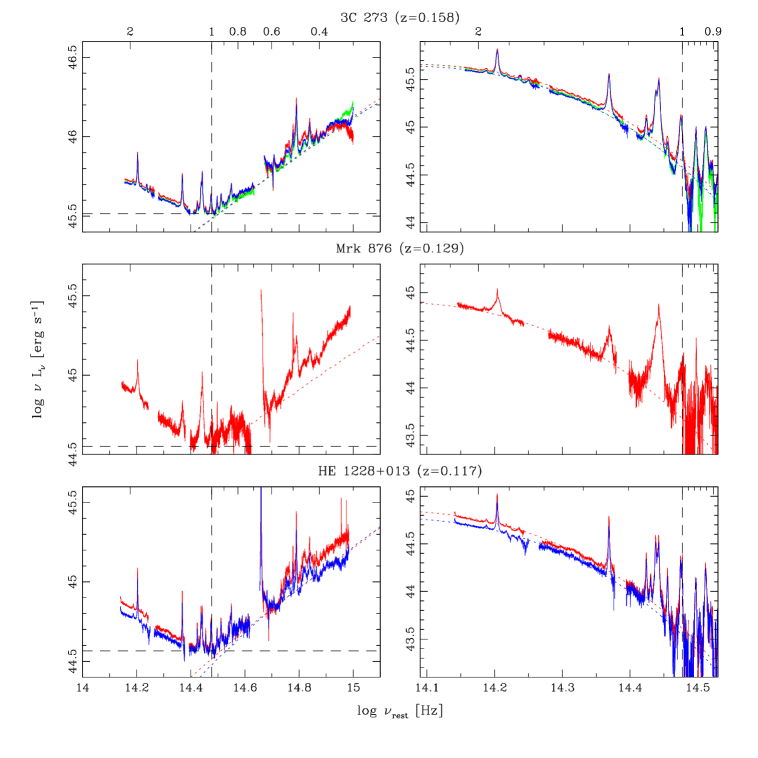
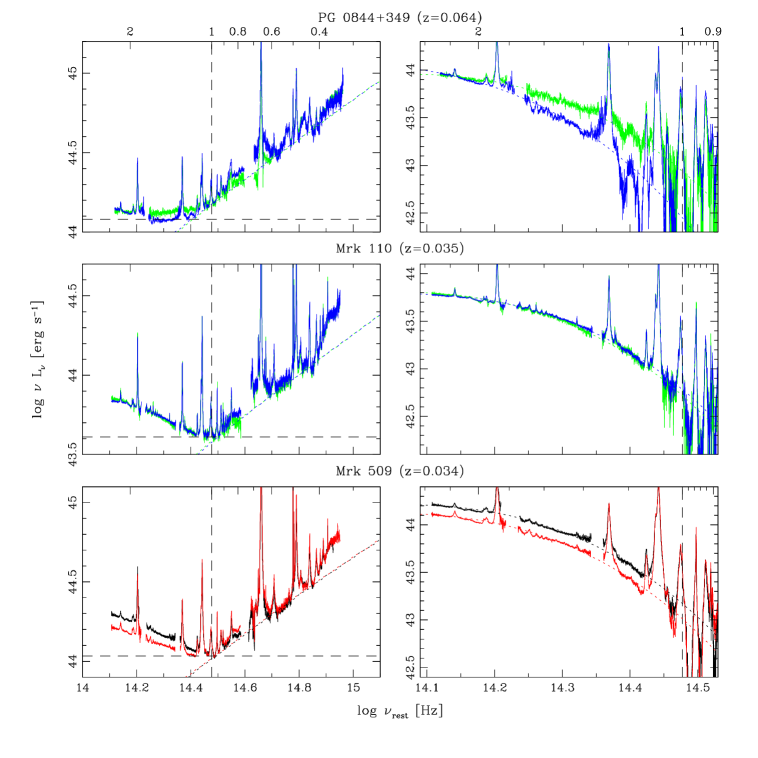
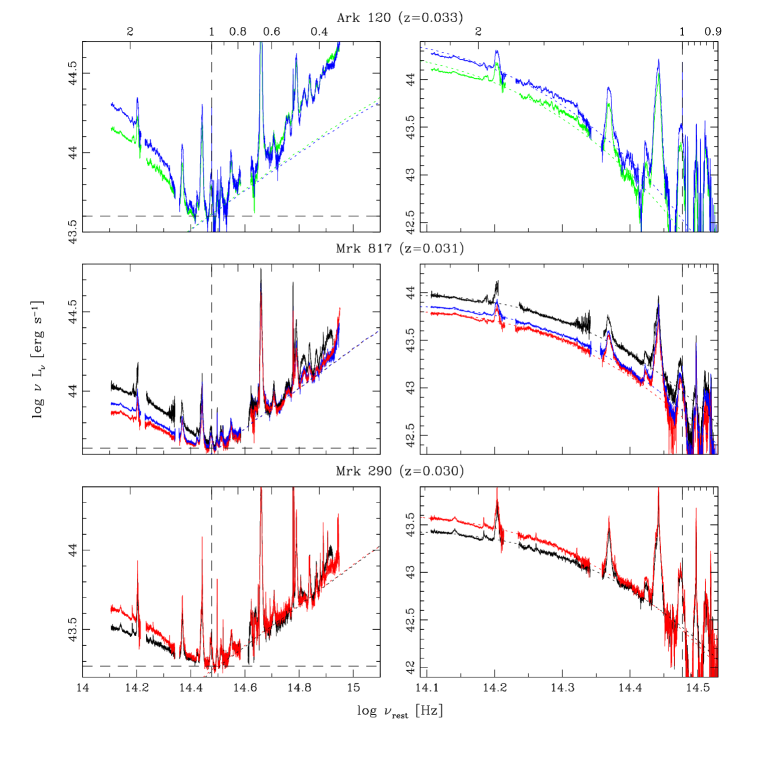
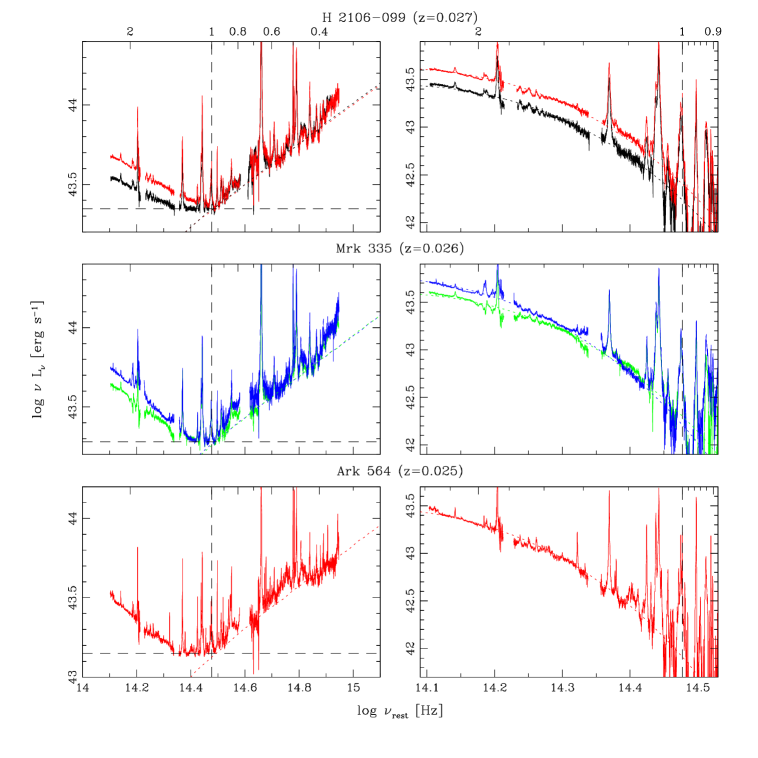
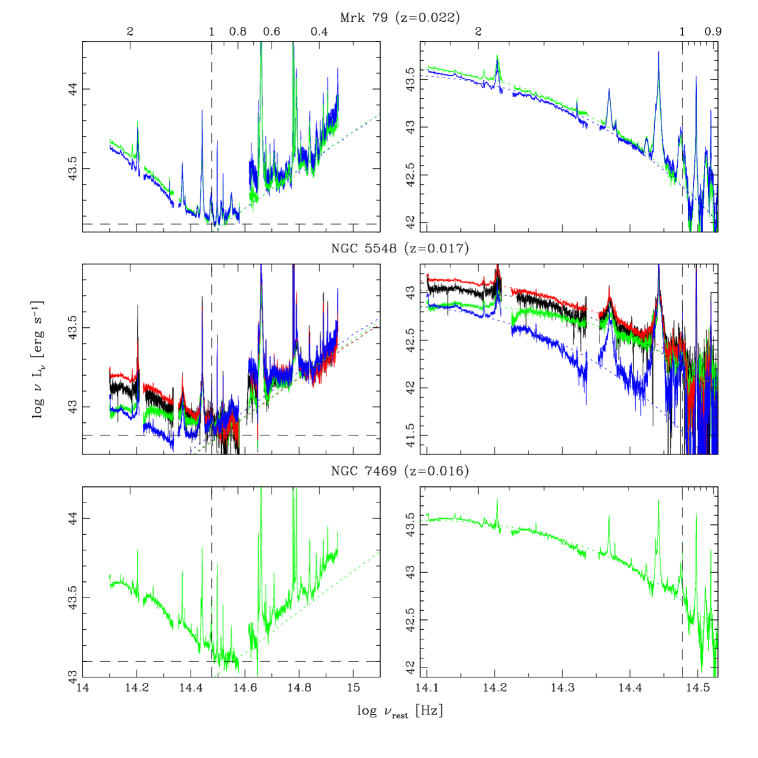
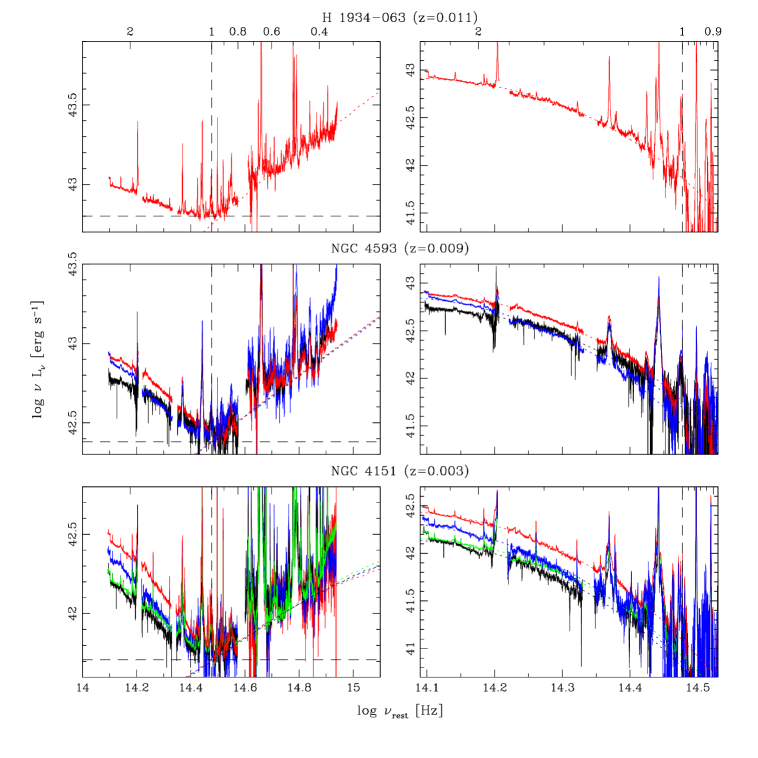
Given these considerations, we chose the following approach to obtain pure AGN continuum SEDs with acceptable relative photometry. Firstly, we performed relative photometry of the near-IR spectra using the flux of the strong narrow emission line [S III] with the epoch observed under the best weather conditions (usually 2006 June or 2007 January) as a reference. We have measured the emission line fluxes as described in Paper I and list them in Table 3. We note that [S III] is not observed for the source HE 1228013, and therefore, no adjustment of the near-IR spectra was made in this case. Secondly, we subtracted the host galaxy flux from the (adjusted) near-IR spectra. Finally, we corrected the flux scale of the optical spectra by requiring that after the subtraction of the (optical) host galaxy contribution the optical and near-IR AGN spectral parts align. In Fig. 14 we show the original data (left panels) and the data after host galaxy subtraction and spectral alignment were applied (right panels).
We have estimated the host galaxy contribution in the apertures of both the near-IR and optical spectra using the Hubble Space Telescope (HST) images of Bentz et al. (2006b) and Bentz et al. (2009) and following their approach. The observed HST fluxes were transformed to a rest-frame wavelength of 5100 Å by applying a color correction factor based on the model bulge galaxy template of Kinney et al. (1996) and were corrected for Galactic extinction using values derived from the hydrogen column densities of Dickey & Lockman (1990). The unabsorbed rest-frame 5100 Å fluxes were then used to scale the galaxy template from Mannucci et al. (2001) of the appropriate Hubble type, which was subsequently subtracted from the (rest-frame) spectrum. Details of our host galaxy flux estimates are given in Tables 3 and 4 for the near-IR and optical spectra, respectively. As expected, the relatively small aperture used in the near-IR includes significantly less host galaxy flux than the optical aperture, on average a factor of .
For 8/23 objects we did not have suitable HST images. In these cases we have estimated the host galaxy contribution based on the linear correlation present between the logarithms of the aperture and the enclosed host galaxy luminosity for the sources with HST images (Fig. 1). The observed correlation is , where is the host galaxy luminosity at rest-frame 5100 Å (in erg s-1 Å-1) and aperture is the spectral aperture (in kpc2). Additionally, we could not find information on the host galaxy type for four sources. In these cases we have assumed elliptical hosts for the two high-redshift sources IRAS 1750508 and PDS 456 and spiral (S0) hosts for the two low-redshift sources H 2106099 and H 1934063.
The frequency gap between our near-IR and optical spectra is large enough () that we need to assume an overall spectral shape in order to judge the two parts as being ‘aligned’. Therefore, since the AGN continuum blueward of m is generally thought to be emitted by the accretion disc, we have considered this component as the model and calculated its spectrum as detailed in Section 4.1. Assuming an accretion disc spectrum, excess host galaxy contribution to the optical spectrum (but not to the near-IR spectrum) was apparent in the majority of our low redshift () sources, requiring also a host galaxy flux correction factor. However, as Fig. 2 shows, in most cases the host correction factors are similar to the correction factors applied to the total optical spectra, and in only a few sources they indicate a real underestimation (by factors of ).
The relative photometry in the near-IR required flux correction factors of , with the exception of Mrk 590 (factor of ), and most spectra had flux differences relative to the best-weather epoch of no more than (Fig. 3, top panel). The correction factors for the optical spectra spanned a larger range of . The narrow emission line [O III] is usually used for relative photometry in the optical and we list in Table 4 also its flux. As Fig. 3 shows, whereas our approach did not succeed in bringing also the [O III] line fluxes of the different epochs into alignment (bottom panel), it did reduce the scatter of the original flux ratio distribution (middle panel). Finally, for a subsample of 12 sources we compare in Fig. 4 the optical correction factors with the ratio between the [O III] line fluxes observed by reverberation programmes (Korista et al., 1995; Peterson et al., 1998; Bentz et al., 2006a; Denney et al., 2010) and us. Fig. 4 indicates that the optical correction factors are mostly overestimates relative to photometric conditions. This result could be partly due to our near-IR flux-calibration, which was based on the telluric standard stars. Since the target integration times were considerably larger than those of the stars, the seeing would have varied substantially for the former, leading overall to an overestimate of the extraction aperture and so of the flux scale.
| Object Name | z | A(1+z)5100 | host | ref. | IRTF | [S III] | near-IR spectrum | HST flux | HST flux | |
|---|---|---|---|---|---|---|---|---|---|---|
| [mag] | type | run | Flux | aperture | PA | (5580 Å) | ( Å) | |||
| [erg/s/cm2] | [arcsec] | [deg] | [erg/s/cm2/Å] | [erg/s/cm2/Å] | ||||||
| (1) | (2) | (3) | (4) | (5) | (6) | (7) | (8) | (9) | (10) | (11) |
| IRAS 1750508 | 0.300 | 0.041 | ? | 2004 May | 9.88E15 | 0.8 3.0 | 0 | … | 4.93E17 | |
| 2006 Jun | 7.36E15 | 0.8 4.0 | 0 | … | 6.06E17 | |||||
| H 1821643 | 0.297 | 0.061 | E | F04 | 2004 May | 1.25E14 | 0.8 3.2 | 0 | … | 5.29E17 |
| PDS 456 | 0.184 | 0.941 | ? | 2006 Jun | 2.81E15 | 0.8 4.0 | 0 | … | 1.19E16 | |
| 3C 273 | 0.158 | 0.000 | E | B09 | 2006 Jan | 1.13E14 | 0.8 5.4 | 207 | 2.61E16 | 2.55E16 |
| 2006 Jun | 7.26E15 | 0.8 4.0 | 0 | 2.28E16 | 2.22E16 | |||||
| 2007 Jan | 1.48E14 | 0.8 5.4 | 0 | 2.50E16 | 2.44E16 | |||||
| Mrk 876 | 0.129 | 0.005 | E | B09 | 2006 Jun | 1.17E14 | 0.8 4.4 | 0 | 4.60E16 | 4.54E16 |
| HE 1228013 | 0.117 | 0.000 | E | L07 | 2006 Jun | … | 0.8 3.4 | 0 | … | 1.75E16 |
| 2007 Jan | … | 0.8 5.4 | 0 | … | 2.41E16 | |||||
| PG 0844349 | 0.064 | 0.031 | Sa | B09 | 2006 Jan | 4.57E15 | 0.8 5.0 | 270 | 5.27E16 | 5.00E16 |
| 2007 Jan | 7.10E15 | 0.8 4.6 | 0 | 5.36E16 | 5.08E16 | |||||
| Mrk 110 | 0.035 | 0.000 | Sa | P07 | 2006 Jan | 1.70E14 | 0.8 5.4 | 254 | 2.49E16 | 2.18E16 |
| 2007 Jan | 1.97E14 | 0.8 5.0 | 0 | 2.47E16 | 2.16E16 | |||||
| Mrk 509 | 0.034 | 0.083 | S0/a | P07 | 2004 May | 3.23E14 | 0.8 2.8 | 0 | 3.85E16 | 3.81E16 |
| 2006 Jun | 4.25E14 | 0.8 4.0 | 0 | 4.83E16 | 4.77E16 | |||||
| Ark 120 | 0.033 | 0.570 | Sb | P07 | 2006 Jan | 2.61E14 | 0.8 4.0 | 327 | 4.10E15 | 5.87E15 |
| 2007 Jan | 2.28E14 | 0.8 5.0 | 0 | 4.11E15 | 5.88E15 | |||||
| Mrk 817 | 0.031 | 0.000 | Sa | P07 | 2004 May | 2.38E14 | 0.8 3.6 | 0 | 2.26E16 | 1.96E16 |
| 2006 Jun | 2.28E14 | 0.8 4.0 | 0 | 2.51E16 | 2.18E16 | |||||
| 2007 Jan | 2.70E14 | 0.8 5.0 | 0 | 2.95E16 | 2.57E16 | |||||
| Mrk 290 | 0.030 | 0.000 | S0 | P07 | 2004 May | 2.08E14 | 0.8 3.0 | 0 | … | 4.71E16 |
| 2006 Jun | 3.33E14 | 0.8 4.0 | 0 | … | 5.80E16 | |||||
| H 2106099 | 0.027 | 0.161 | ? | 2004 May | 2.35E14 | 0.8 3.6 | 0 | … | 5.74E16 | |
| 2006 Jun | 2.25E14 | 0.8 4.0 | 0 | … | 6.29E16 | |||||
| Mrk 335 | 0.026 | 0.077 | S0/a | P07 | 2006 Jan | 1.31E14 | 0.8 4.4 | 86 | 5.97E16 | 5.44E16 |
| 2007 Jan | 1.28E14 | 0.8 4.2 | 0 | 6.21E16 | 5.67E16 | |||||
| Mrk 590 | 0.026 | 0.000 | S0 | P07 | 2006 Jan | 1.10E14 | 0.8 5.0 | 353 | 1.31E15 | 1.11E15 |
| 2007 Jan | 3.29E14 | 0.8 4.6 | 0 | 1.27E15 | 1.08E15 | |||||
| Ark 564 | 0.025 | 0.228 | Sb | O07 | 2006 Jun | 3.22E14 | 0.8 4.0 | 0 | … | 6.57E16 |
| Mrk 79 | 0.022 | 0.183 | Sb | P07 | 2006 Jan | 5.09E14 | 0.8 4.0 | 186 | 4.10E16 | 4.06E16 |
| 2007 Jan | 4.87E14 | 0.8 4.2 | 0 | 4.13E16 | 4.08E16 | |||||
| NGC 5548 | 0.017 | 0.000 | Sa | P07 | 2004 May | 4.62E14 | 0.8 5.0 | 0 | 1.22E15 | 1.02E15 |
| 2006 Jan | 3.95E14 | 0.8 8.0 | 273 | 1.38E15 | 1.16E15 | |||||
| 2006 Jun | 6.59E14 | 0.8 4.0 | 0 | 1.14E15 | 9.56E16 | |||||
| 2007 Jan | 5.98E14 | 0.8 5.8 | 0 | 1.26E15 | 1.06E15 | |||||
| NGC 7469 | 0.016 | 0.140 | Sa | P07 | 2006 Jan | 1.16E13 | 0.8 6.0 | 71 | 2.76E15 | 2.59E15 |
| H 1934063 | 0.011 | 0.744 | ? | 2006 Jun | 1.14E13 | 0.8 4.0 | 0 | … | 1.11E15 | |
| NGC 4593 | 0.009 | 0.000 | Sb | P07 | 2004 May | 2.56E14 | 0.8 4.0 | 0 | 1.31E15 | 1.08E15 |
| 2006 Jun | 2.89E14 | 0.8 4.0 | 0 | 1.31E15 | 1.08E15 | |||||
| 2007 Jan | 3.76E14 | 0.8 5.8 | 0 | 1.67E15 | 1.38E15 | |||||
| NGC 3227 | 0.004 | 0.000 | Sa/b | RC3 | 2006 Jan | 3.25E13 | 0.8 6.0 | 0 | 2.22E15 | 1.82E15 |
| 2007 Jan | 2.68E13 | 0.8 5.0 | 0 | 2.17E15 | 1.77E15 | |||||
| NGC 4151 | 0.003 | 0.000 | Sa/b | RC3 | 2004 May | 1.06E12 | 0.8 7.6 | 0 | 5.71E15 | 4.66E15 |
| 2006 Jan | 1.15E12 | 0.8 6.0 | 218 | 5.79E15 | 4.72E15 | |||||
| 2006 Jun | 1.16E12 | 0.8 4.4 | 0 | 5.03E15 | 4.10E15 | |||||
| 2007 Jan | 8.22E13 | 0.8 5.8 | 0 | 5.39E15 | 4.40E15 | |||||
The columns are: (1) object name; (2) redshift from the NASA/IPAC Extragalactic Database (NED); (3) Galactic extinction at rest-frame 5100 Å; (4) Hubble type of the host galaxy; (5) reference for the host type, where P07: Petrosian et al. (2007), B09: Bentz et al. (2009), RC3: de Vaucouleurs et al. (1991), F04: Floyd et al. (2004), L07: Letawe et al. (2007), O07: Ohta et al. (2007); (6) IRTF run (epoch with best weather conditions in bold); (7) observed flux of the narrow line [S III] ; (8) near-IR extraction aperture; (9) near-IR slit position angle, where PA=0∘ corresponds to E-W orientation and is defined E through N; (10) host galaxy flux at 5580 Å (except for Mrk 509 at 5483 Å) estimated from HST images of Bentz et al. (2006b, 2009); and (11) host galaxy flux at rest-frame 5100 Å, corrected for Galactic extinction using the values in column (3).
| Object Name | z | A(1+z)5100 | IRTF | [O III] | opt. | optical spectrum | HST flux | HST flux | host | |
| [mag] | run | Flux | corr. | aperture | PA | (5580 Å) | ( Å) | corr. | ||
| [erg/s/cm2] | factor | [arcsec] | [deg] | [erg/s/cm2/Å] | [erg/s/cm2/Å] | factor | ||||
| (1) | (2) | (3) | (4) | (5) | (6) | (7) | (8) | (9) | (10) | (11) |
| IRAS 1750508 | 0.300 | 0.041 | 2004 May | 8.43E14 | 0.90 | 3 4.2 | 110 | … | 1.67E16 | 1.0 |
| 2006 Jun | 7.64E14 | 1.00 | 3 4.8 | 90 | … | 1.83E16 | 1.0 | |||
| H 1821643 | 0.297 | 0.061 | 2004 May | 1.63E13 | 1.32 | 3 3.6 | 110 | … | 1.49E16 | 1.0 |
| PDS 456 | 0.184 | 0.941 | 2006 Jun | 1.22E14 | 1.70 | 3 4.2 | 6 | … | 3.20E16 | 1.0 |
| 3C 273 | 0.158 | 0.000 | 2006 Jan | 1.92E13 | 0.67 | 3 3.6 | 15 | 5.49E16 | 5.36E16 | 1.0 |
| 2006 Jun | 1.51E13 | 1.80 | 3 4.2 | 90 | 6.00E16 | 5.86E16 | 1.0 | |||
| 2007 Jan | 2.11E13 | 0.75 | 3 4.8 | 25 | 6.27E16 | 6.12E16 | 1.0 | |||
| Mrk 876 | 0.129 | 0.005 | 2006 Jun | 5.13E14 | 1.40 | 3 4.8 | 110 | 7.93E16 | 7.83E16 | 1.0 |
| HE 1228013 | 0.117 | 0.000 | 2006 Jun | 4.44E14 | 1.50 | 3 4.8 | 50 | … | 5.78E16 | 1.0 |
| 2007 Jan | 5.61E14 | 1.80 | 3 4.2 | 33 | … | 5.27E16 | 1.0 | |||
| PG 0844349 | 0.064 | 0.031 | 2006 Jan | 5.24E14 | 1.80 | 3 3.6 | 80 | 7.61E16 | 7.22E16 | 4.9 |
| 2007 Jan | 4.56E14 | 1.75 | 3 7.8 | 107 | 8.96E16 | 8.51E16 | 3.6 | |||
| Mrk 110 | 0.035 | 0.000 | 2006 Jan | 2.00E13 | 2.60 | 3 4.8 | 6 | 5.55E16 | 4.86E16 | 5.4 |
| 2007 Jan | 2.66E13 | 2.10 | 3 6.0 | 15 | 5.86E16 | 5.13E16 | 6.5 | |||
| Mrk 509 | 0.034 | 0.083 | 2004 May | 4.63E13 | 2.80 | 3 4.2 | 0 | 1.49E15 | 1.47E15 | 4.2 |
| 2006 Jun | 6.11E13 | 2.30 | 3 4.8 | 10 | 1.62E15 | 1.60E15 | 4.5 | |||
| Ark 120 | 0.033 | 0.570 | 2006 Jan | 1.94E13 | 1.00 | 3 4.8 | 7 | 5.78E15 | 8.28E15 | 1.0 |
| 2007 Jan | 1.69E13 | 1.00 | 3 4.8 | 6 | 5.78E15 | 8.28E15 | 1.0 | |||
| Mrk 817 | 0.031 | 0.000 | 2004 May | 3.81E13 | 1.00 | 3 4.2 | 0 | 8.60E16 | 7.48E16 | 2.9 |
| 2006 Jun | 1.16E13 | 1.90 | 3 4.2 | 110 | 8.65E16 | 7.53E16 | 1.7 | |||
| 2007 Jan | 8.28E14 | 3.10 | 3 7.2 | 20 | 1.11E15 | 9.66E16 | 3.3 | |||
| Mrk 290 | 0.030 | 0.000 | 2004 May | 2.10E13 | 3.40 | 3 4.8 | 110 | … | 1.75E15 | 2.0 |
| 2006 Jun | 1.93E13 | 3.30 | 3 5.4 | 90 | … | 1.92E15 | 1.0 | |||
| H 2106099 | 0.027 | 0.161 | 2004 May | 1.23E13 | 2.75 | 3 4.2 | 5 | … | 1.69E15 | 2.5 |
| 2006 Jun | 1.52E13 | 2.00 | 3 5.4 | 14 | … | 2.04E15 | 2.1 | |||
| Mrk 335 | 0.026 | 0.077 | 2006 Jan | 2.78E13 | 1.00 | 3 3.6 | 55 | 1.20E15 | 1.09E15 | 1.7 |
| 2007 Jan | 1.76E13 | 1.90 | 3 6.6 | 65 | 1.45E15 | 1.32E15 | 2.4 | |||
| Mrk 590 | 0.026 | 0.000 | 2006 Jan | 8.18E14 | 1.00 | 3 6.6 | 5 | 3.65E15 | 3.11E15 | 1.5 |
| 2007 Jan | 8.09E14 | 1.00 | 3 9.6 | 11 | 3.96E15 | 3.37E15 | 1.0 | |||
| Ark 564 | 0.025 | 0.228 | 2006 Jun | 2.25E13 | 1.75 | 3 4.8 | 70 | … | 1.98E15 | 1.3 |
| Mrk 79 | 0.022 | 0.183 | 2006 Jan | 4.79E13 | 1.60 | 3 4.2 | 28 | 1.03E15 | 1.02E15 | 2.8 |
| 2007 Jan | 4.58E13 | 1.75 | 3 7.8 | 45 | 1.27E15 | 1.27E15 | 4.1 | |||
| NGC 5548 | 0.017 | 0.000 | 2004 May | 1.58E12 | 0.55 | 3 7.2 | 71 | 3.37E15 | 2.82E15 | 1.0 |
| 2006 Jan | 5.90E13 | 2.40 | 3 6.0 | 110 | 3.24E15 | 2.71E15 | 2.1 | |||
| 2006 Jun | 4.35E13 | 2.10 | 3 8.4 | 70 | 3.54E15 | 2.96E15 | 1.4 | |||
| 2007 Jan | 3.06E13 | 2.50 | 3 8.4 | 55 | 3.58E15 | 2.99E15 | 2.0 | |||
| NGC 7469 | 0.016 | 0.140 | 2006 Jan | 9.95E13 | 1.00 | 3 4.8 | 51 | 7.89E15 | 7.41E15 | 1.0 |
| H 1934063 | 0.011 | 0.744 | 2006 Jun | 5.52E13 | 2.10 | 3 5.4 | 26 | … | 3.59E15 | 1.8 |
| NGC 4593 | 0.009 | 0.000 | 2004 May | 1.74E13 | 2.25 | 3 6.0 | 5 | 4.81E15 | 3.97E15 | 3.1 |
| 2006 Jun | 1.54E13 | 1.85 | 3 7.2 | 43 | 5.39E15 | 4.44E15 | 1.9 | |||
| 2007 Jan | 1.13E13 | 3.80 | 3 9.0 | 10 | 5.64E15 | 4.65E15 | 4.9 | |||
| NGC 3227 | 0.004 | 0.000 | 2006 Jan | 9.10E13 | 1.00 | 3 6.0 | 0 | 6.46E15 | 5.28E15 | 1.5 |
| 2007 Jan | 1.28E12 | 0.71 | 3 10.2 | 13 | 7.62E15 | 6.23E15 | 1.5 | |||
| NGC 4151 | 0.003 | 0.000 | 2004 May | 8.03E12 | 3.00 | 3 5.4 | 40 | 1.22E14 | 9.91E15 | 3.7 |
| 2006 Jan | 1.18E11 | 1.30 | 3 4.8 | 54 | 1.19E14 | 9.71E15 | 2.2 | |||
| 2006 Jun | 1.18E11 | 2.00 | 3 6.6 | 90 | 1.33E14 | 1.08E14 | 1.8 | |||
| 2007 Jan | 4.09E12 | 2.40 | 3 8.4 | 102 | 1.42E14 | 1.15E14 | 3.9 | |||
The columns are: (1) object name; (2) redshift from the NASA/IPAC Extragalactic Database (NED); (3) Galactic extinction at rest-frame 5100 Å; (4) IRTF run; (5) observed flux of the narrow-line [O III] ; (6) flux scale correction factor for optical spectrum; (7) optical extraction aperture; (8) optical slit position angle, where PA=90∘ corresponds to E-W orientation; (9) observed host galaxy flux at 5580 Å (except for Mrk 509 at 5483 Å) in optical aperture derived from HST images of Bentz et al. (2006b, 2009); (10) observed host galaxy flux at rest-frame 5100 Å in optical aperture, corrected for Galactic extinction using the values in column (3); and (11) host galaxy flux correction factor.
4 The AGN continuum components
| Object Name | Ref. | IRTF run | log | var. | log | log | ||||
|---|---|---|---|---|---|---|---|---|---|---|
| [] | [erg s-1] | factor | [erg s-1] | [K] | [erg s-1] | [lyr] | ||||
| (1) | (2) | (3) | (4) | (5) | (6) | (7) | (8) | (9) | (10) | (11) |
| IRAS 1750508 | 9.3e07 | est | 2004 May | 45.02 | 1.00 | 46.84 | 1289 | 45.15 | 0.01 | 6.27 |
| 2006 Jun | 45.12 | 1.26 | 46.98 | 1383 | 45.19 | 0.01 | 6.40 | |||
| H 1821643 | 8.9e08 | est | 2004 May | 45.76 | 1.00 | 46.92 | 1320 | 46.01 | 0.05 | 6.55 |
| PDS 456 | 1.8e08 | est | 2006 Jun | 45.69 | 1.00 | 47.42 | 1425 | 45.98 | 0.01 | 10.00 |
| 3C 273 | 8.9e08 | P04 | 2006 Jan | 45.56 | 1.10 | 46.66 | 1403 | 45.71 | 0.04 | 4.30 |
| 2006 Jun | 45.84 | 1.91 | 47.02 | 1443 | 45.94 | 0.03 | 6.15 | |||
| 2007 Jan | 45.52 | 1.00 | 46.61 | 1418 | 45.64 | 0.04 | 3.97 | |||
| Mrk 876 | 2.8e08 | P04 | 2006 Jun | 44.55 | 1.00 | 45.65 | 1339 | 44.90 | 0.07 | 1.48 |
| HE 1228013 | 5.2e07 | est | 2006 Jun | 44.57 | 1.00 | 46.38 | 1333 | 44.85 | 0.01 | 3.45 |
| 2007 Jan | 44.95 | 2.40 | 46.95 | 1337 | 45.15 | 0.01 | 6.61 | |||
| PG 0844349 | 9.2e07 | P04 | 2006 Jan | 44.38 | 1.58 | 45.89 | 1443 | 44.16 | 0.01 | 1.68 |
| 2007 Jan | 44.18 | 1.00 | 45.61 | 1190 | 44.05 | 0.01 | 1.78 | |||
| Mrk 110 | 2.5e07 | P04 | 2006 Jan | 43.61 | 1.00 | 45.28 | 1406 | 43.81 | 0.01 | 0.87 |
| 2007 Jan | 43.71 | 1.26 | 45.42 | 1452 | 43.89 | 0.01 | 0.96 | |||
| Mrk 509 | 1.4e08 | P04 | 2004 May | 44.11 | 1.20 | 45.31 | 1432 | 44.29 | 0.04 | 0.87 |
| 2006 Jun | 44.03 | 1.00 | 45.20 | 1398 | 44.12 | 0.03 | 0.81 | |||
| Ark 120 | 1.5e08 | P04 | 2006 Jan | 43.80 | 1.58 | 44.88 | 1102 | 44.49 | 0.16 | 0.90 |
| 2007 Jan | 43.60 | 1.00 | 44.58 | 1100 | 44.43 | 0.28 | 0.64 | |||
| Mrk 817 | 4.3e07 | D10 | 2004 May | 43.64 | 1.00 | 45.08 | 1446 | 43.97 | 0.03 | 0.66 |
| 2006 Jun | 43.64 | 1.00 | 45.08 | 1392 | 43.81 | 0.02 | 0.71 | |||
| 2007 Jan | 43.64 | 1.00 | 45.08 | 1401 | 43.86 | 0.02 | 0.70 | |||
| Mrk 290 | 2.4e07 | D10 | 2004 May | 43.47 | 1.58 | 45.07 | 1453 | 43.62 | 0.01 | 0.64 |
| 2006 Jun | 43.27 | 1.00 | 44.78 | 1353 | 43.59 | 0.03 | 0.53 | |||
| H 2106099 | 2.3e07 | est | 2004 May | 43.45 | 1.26 | 45.10 | 1346 | 43.55 | 0.01 | 0.78 |
| 2006 Jun | 43.35 | 1.00 | 44.95 | 1342 | 43.62 | 0.02 | 0.66 | |||
| Mrk 335 | 1.4e07 | P04 | 2006 Jan | 43.42 | 1.38 | 45.26 | 1308 | 43.74 | 0.01 | 0.99 |
| 2007 Jan | 43.28 | 1.00 | 45.06 | 1206 | 43.77 | 0.02 | 0.92 | |||
| Ark 564 | 9.8e06 | est | 2006 Jun | 43.15 | 1.00 | 45.03 | 1202 | 43.48 | 0.01 | 0.90 |
| Mrk 79 | 5.2e07 | P04 | 2006 Jan | 43.24 | 1.23 | 44.38 | 1339 | 43.71 | 0.09 | 0.34 |
| 2007 Jan | 43.15 | 1.00 | 44.25 | 1364 | 43.55 | 0.08 | 0.28 | |||
| NGC 5548 | 4.4e07 | D10 | 2004 May | 42.82 | 1.00 | 43.87 | 1572 | 43.03 | 0.06 | 0.14 |
| 2006 Jan | 43.22 | 2.51 | 44.44 | 1730 | 43.26 | 0.03 | 0.22 | |||
| 2006 Jun | 42.92 | 1.26 | 44.01 | 1547 | 43.22 | 0.06 | 0.17 | |||
| 2007 Jan | 42.92 | 1.26 | 44.07 | 1291 | 42.98 | 0.03 | 0.26 | |||
| NGC 7469 | 1.2e07 | P04 | 2006 Jan | 43.10 | 1.00 | 44.70 | 1551 | 43.54 | 0.03 | 0.37 |
| H 1934063 | 5.8e06 | est | 2006 Jun | 42.80 | 1.00 | 44.70 | 1426 | 42.91 | 0.01 | 0.44 |
| NGC 4593 | 9.8e06 | D06 | 2004 May | 42.58 | 1.58 | 44.18 | 1429 | 42.94 | 0.02 | 0.24 |
| 2006 Jun | 42.55 | 1.48 | 44.14 | 1380 | 43.07 | 0.03 | 0.24 | |||
| 2007 Jan | 42.38 | 1.00 | 43.88 | 1281 | 42.87 | 0.04 | 0.21 | |||
| NGC 4151 | 4.6e07 | B06 | 2004 May | 41.88 | 1.48 | 42.53 | 1281 | 42.33 | 0.25 | 0.04 |
| 2006 Jan | 41.97 | 1.82 | 42.67 | 1328 | 42.43 | 0.23 | 0.05 | |||
| 2006 Jun | 41.71 | 1.00 | 42.31 | 1278 | 42.45 | 0.55 | 0.03 | |||
| 2007 Jan | 41.81 | 1.26 | 42.44 | 1231 | 42.44 | 0.40 | 0.04 |
The columns are: (1) object name; (2) black hole mass (in solar masses); (3) reference for the black hole mass, where B06: Bentz et al. (2006a), D06: Denney et al. (2006), D10: Denney et al. (2010), P04: Peterson et al. (2004) and est: estimated based on the correlation in Fig. 8; (4) IRTF run; (5) total AGN (host galaxy-subtracted) luminosity at 1 m; (6) variability factor relative to the lowest-flux epoch; (7) peak luminosity of the accretion disc; for the hot dust component (8) its blackbody temperature, (9) peak luminosity, (10) covering factor, and (11) average radius (in light years).
Our observations cover the continuum rest-frame frequency range of Hz, which is believed to sample two important emission components, namely, the accretion disc (e.g., Malkan & Sargent, 1982; Malkan, 1983) and the hottest part of the putative dusty torus (e.g., Barvainis, 1987; Neugebauer et al., 1987). These two components are predicted to have opposite spectral behaviours, namely, the accretion disc and the hot dust emission rising and falling towards longer frequencies (in a logarithmic versus plot), respectively, resulting in an inflection point at the location where they meet (at m; e.g., Ward et al., 1987; Carleton et al., 1987; Elvis et al., 1994; Glikman et al., 2006; Riffel et al., 2006).
Our present knowledge of this special continuum region is based mainly on optical spectroscopy combined with near-IR photometry, with the two frequency ranges usually not observed contemporaneously. Our observations now give us for the first time the opportunity to define the separate continuum components at spectroscopic rather than photometric precision. This permits us to investigate their properties in greater detail than was possible before. In particular, we are interested to understand if a near-IR reverberation mapping campaign generally requires simultaneous optical spectroscopy to determine the state of the ionising flux or if the latter can also be derived from the continuum behaviour at longer wavelengths.
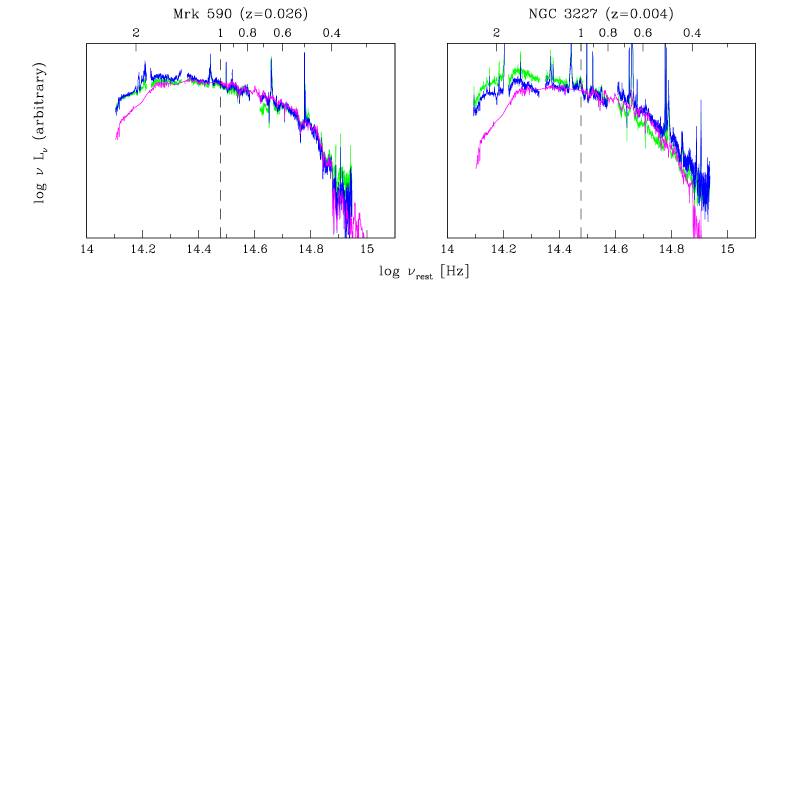
For the purpose of the following analysis we have normalised all SEDs at m (Fig. 5). The SEDs of two sources, namely, Mrk 590 and NGC 3227, are strongly affected by host galaxy light in both their near-IR and optical spectral parts (Fig. 7) and are not considered further.
4.1 The accretion disc

The AGN continuum blueward of m is believed to be emitted by the accretion disc, which is considered the main source of ionising flux producing the broad emission lines. In order to test if this component is indeed seen in our data, we have calculated accretion disc spectra. We have assumed a steady geometrically thin, optically thick accretion disc, in which case the emitted flux is independent of viscosity and each element of the disc face radiates roughly as a blackbody with a characteristic temperature depending only on the mass of the black hole, , the accretion rate, , and the radius of the innermost stable orbit (e.g., Peterson, 1997; Frank et al., 2002). We have adopted the Schwarzschild geometry (non-rotating black hole) and for this the innermost stable orbit is at , where is the gravitational radius defined as , with the gravitational constant and the speed of light. Furthermore, we have assumed that the disc is viewed face-on.
The accretion disc spectrum is fully constrained by the two quantities, mass and accretion rate of the black hole. Two thirds of our sample have black hole masses derived from reverberation mapping campaigns. For the remainder (7 sources) we have estimated this quantity by applying the virial theorem , where and are the velocity and radial distance of an orbiting particle, respectively, to the near-IR. Using the width of the Pa broad component (denoted , published in Paper I) as a measure of and the square-root of the continuum luminosity at 1 m (denoted ) as a surrogate for , Fig. 8 shows that for the sources with reverberation mapping results the black hole mass correlates with the near-IR virial product. The observed correlation is . The accretion rate can be obtained directly from an approximation of the accretion disc spectrum to the data. We show our results in Fig. 5, left panels (dotted lines) and list the relevant values in Table 5.
The calculated accretion disc spectrum approximates well the AGN continuum slope blueward of m in all high-redshift () sources, where the host galaxy contribution to the total flux is negligible at all wavelengths. In particular the near-IR spectral part ( m, covered by the IRTF spectrum) is well reproduced, which is free from major contaminating components such as, e.g., strong Fe II emission and the ‘small blue bump’ (Grandi, 1982; Wills et al., 1985) sometimes found in the optical spectral part. However, most important for our future near-IR reverberation programme is the result that the accretion disc emission can still dominate at the large wavelength of m. This means that we observe the flux of the ionising component directly in the near-IR, which will allow us to determine the AGN state without optical spectroscopy.
In the lower redshift sources, the host galaxy contribution is expected to be minimal in the near-IR spectrum, since these observations were taken through a relatively narrow slit, and in the bluer part of the optical spectrum, since at these frequencies the AGN emission lies well above that of the host galaxy. Indeed, in both these frequency regimes the calculated accretion disc spectrum is always a satisfactory approximation. However, excess host emission is often observed at the red end of the optical spectrum, which has the effect of flattening the spectrum (in a logarithmic versus plot). Nevertheless, subtraction of sufficient host galaxy flux leads also in this spectral range to an alignment of the data with the expected accretion disc emission.
4.2 The hot dust


The AGN continuum redward of m is believed to be produced by the hottest part of a dusty torus, which surrounds the central ionising source and obscures the BELR for lines of sight close to the plane of the accretion disc. Assuming this component is indeed seen in our data, we have subtracted from the total spectrum that of the accretion disc and have fitted to the result a blackbody spectrum. For this purpose we have used the C routine MPFIT (version 1.1; Markwardt, 2009), which solves the least-squares problem with the Levenberg-Marquardt technique, and have fitted for the temperature and flux scaling. We have included in the fit only the continuum part of the near-IR spectrum, i.e., we have excluded emission lines, and rebinned it to Hz. We show our results in Fig. 5, right panels (dotted lines) and list the relevant values in Table 5.
A hot blackbody spectrum appears to approximate well the near-IR AGN continuum in all our sources. In particular, the typical curvature of such a spectrum is evident in our spectra due to their relatively large wavelength coverage. This behaviour was noted also by Rodríguez-Ardila & Mazzalay (2006), whose near-IR spectrum of one broad-line AGN (Mrk 1239) covered an even larger wavelength range of m. In this respect, we note that the blackbody curvature is not evident in the original spectra (without the accretion disc component subtracted), which resemble rather a single power-law. The resulting temperatures for the hot blackbody component are in the range of K, which are typical values of the dust sublimation temperature for most astrophysical grain compositions ( K; Salpeter, 1977). The overall temperature distribution is relatively narrow and has a well-defined mean of K (Fig. 9). Similarly narrow temperature distributions were obtained previously by AGN studies using low- and medium-resolution near-IR spectra (Kobayashi et al., 1993; Riffel et al., 2009) and more recently by studies based on high-resolution near-IR photometric and interferometric observations (Kishimoto et al., 2007, 2009, 2010).
This well-defined peak of the blackbody temperatures is close to the sublimation temperature of silicate dust grains (Kimura et al., 2002). More refractory dust types are known, notably carbonaceous dust, e.g. graphite, which can survive up to K. The absence of such hot dust, except in one object (NGC 5548), suggests that either carbonaceous dust is rare in AGN or that some other mechanism than dust sublimation sets the maximum dust temperature. Dust formation is critically dependent on the numerical ratio of carbon to oxygen atoms in the parent gas; most pair up to form CO, and do not form dust (Whittet, 2003). An imbalance in C/O atom numbers biases dust formation strongly toward either carbon-rich or oxygen-rich (including silicates). The K peak in AGN suggests an oxygen-rich environment from which the dust formed.
The strength of our data set is that it allows us to observe simultaneously the accretion disc and the hot dust emission. Therefore, we can derive for the first time meaningful covering factors for the dusty obscurer in AGN. If the ultraviolet radiation from the accretion disc emitted into the solid angle, , defined by the dust distribution is completely absorbed and re-emitted in the infrared, the dust covering factor is , where and are the peak luminosities of the hot blackbody and accretion disc spectrum, respectively (e.g., Barvainis, 1987; Granato & Danese, 1994). Note that whereas lies only slightly outside the observed spectral range and, therefore, is well-constrained by the data, the accretion disc peak luminosity is strongly model-dependent. In Fig. 10 we show the distribution of hot dust covering factors. We obtain values in the range of and a mean of . Our average value is a factor of lower than the average total dust covering factor obtained by Sanders et al. (1989) (), who considered the ratio between the entire integrated infrared luminosity (in the frequency range Hz) and the integrated accretion disc luminosity for a large ( sources) sample of bright quasars.
The relatively low hot dust covering factors could be a result introduced by the correction factors that we applied to the optical spectra (Section 3), i.e., we have artificially raised the accretion disc flux relative to the hot dust emission. In order to address this concern, we have plotted in Fig. 11 the covering factors versus the optical correction factors. Whereas we see an envelope in the sense that the higher the optical correction factor, the lower the highest covering factor, overall we observe large hot dust covering factors () in only a few cases (mostly in Ark 120 and NGC 4151) or, put differently, AGN states cluster around relatively low values independent of the optical correction factor.
4.3 Additional continuum components
The observed AGN SEDs can be explained mainly by the sum of an accretion disc spectrum and emission from hot dust. However, two additional continuum components are expected to be present, which albeit weaker could alter the AGN continuum slope. The first is the diffuse continuum (thermal emission and scattering) from the BELR, which can be strong due to the relatively high gas densities found in these regions. The Balmer jump and continuum ( Å) were identified in AGN spectra long ago (e.g., Malkan & Sargent, 1982) and predicted in early photoionization models as well (e.g., Wills et al., 1985). If the BELR is emitting a Balmer continuum, it is also emitting a Paschen continuum ( Å), the strength of which could be important throughout the optical and near-IR spectrum. Other, weaker, recombination continua (Brackett, etc.) will also be present within the IR. Korista & Goad (2001) used the photoionization code CLOUDY (Ferland et al., 1998) and calculated the full diffuse BELR continuum assuming clouds with simple distributions in gas density and incident ionizing flux. They found that after correcting for host galaxy light of the flux at 5100 Å may be due to this component, which is dominated by the thermal continua (nearly 40% at the Balmer jump; see Korista & Goad for details). In a representation of the SED as in Fig. 5 ( vs. ) the relative contribution of this component is expected to strengthen with increasing wavelength as the accretion disc spectrum falls, resulting in a flattening of the near-UV to near-IR AGN continuum spectrum as compared to an accretion disc alone.
A second additional component is due to the finite albedo of the same dusty clouds emitting the thermal IR continuum. Korista & Ferland (1998) investigated the effective albedo of a variety of gas clouds potentially present within the BELR. These contributions are included in the diffuse continuum just described. They also presented the effective albedo of a high column density, dusty cloud with parameters grossly approximating the clouds producing most of the hot dust emission. They found a albedo spanning the wavelength range of Å – 1 m that declines significantly for wavelengths outside. While the detailed wavelength-dependent albedo depends on the grain size distributions and composition, their overall amplitudes should not differ greatly. Although the spatially-integrated scattered nuclear light will depend on factors such as the geometry of the scattering region and the observer’s viewing angle, contributions of to the AGN continuum are possible. Due to the finite grain albedo, the dusty torus will contribute additional light to the near-UV to near-IR spectrum that otherwise would not be expected from its thermal emission alone. As with the contribution from the diffuse continuum light from the BELR, this contribution will act to flatten (in vs. ) the AGN continuum.
Due to the uncertainties in the absolute flux calibration and the relative normalizations of our near-IR and optical spectra, we have not attempted to isolate the contributions of the diffuse BELR continuum and the dust scattering of nuclear light to the AGN continuum. However, doing so should provide additional physical and geometrical constraints on the BELR and inner dusty torus. Here we only point out that the strongest contributor to the diffuse BELR continuum, namely the Balmer jump and continuum are clearly visible in most of our optical spectra, forming together with Fe II the so-called ‘small blue bump’ (Grandi, 1982; Wills et al., 1985).
5 The AGN continuum variability

Both AGN continuum components sampled by our spectra are expected to be variable. The main cause of variability will be a change in the accretion rate, which will lead to a change in the dust illumination. However, although the variability behaviour of the accretion disc has been studied extensively by optical reverberation campaigns, only few sources have been observed in dust reverberation programmes so far (e.g., Glass, 1992; Nelson, 1996; Oknyanskij et al., 1999; Glass, 2004; Minezaki et al., 2004; Suganuma et al., 2006; Koshida et al., 2009). Therefore, the exact location of the dusty obscurer as well as its geometry remain uncertain. In this section we discuss the first results of our coordinated optical and near-IR reverberation campaign. Based on these results, we will select the final sample for monitoring and develop a suitable observational strategy.
We have multiple observation epochs available for 15/21 sources listed in Table 5, of which five sources have more than two epochs. Defining the variability factor as the flux change at 1 m relative to the lowest-flux state in a fixed period of one year, we obtain the distribution shown in Fig. 12. Note that this variability factor is different from that listed in Table 5 (column (6)), which refers to the total period between two epochs, and was calculated assuming uniform variability between the lowest-flux epoch and the epoch with a higher flux. The most variable of our sources are 3C 273, HE 1228013 and NGC 4151, which have at least one epoch with a one-year variability factor of , followed by PG 0844349, Ark 120, NGC 5548 and NGC 4593, with variability factors of . The source Mrk 817 shows no variability and our three least variable sources are IRAS 1750508, Mrk 509 and H 2106099.
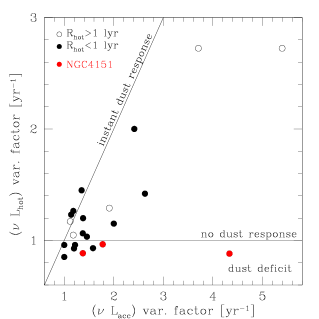
With our future near-IR reverberation programme we will be able to study also the variability behaviour of the hot dust and its dependence on the state of the ionising source. A first look gives Fig. 13, where we have plotted the hot dust variability factor versus the accretion disc variability factor, with both values calculated for a fixed period of one year. Assuming that the hot dust absorbs and re-emits all the accretion disc luminosity, we have then estimated the average radius of the hot dust component as , where is the Stefan-Boltzmann constant, and have separated sources into those having and light year (open and filled circles, respectively).
Two important results become evident from Fig. 13. Firstly, for most sources we observe a response of the hot dust to the change in accretion disc luminosity, which is always lower than the latter, as expected for a response lag. Most interestingly, however, is that a dust response is observed even in those sources with estimated hot dust radii well above one light year, i.e., for which we would expect no response. The only exception in this group is the source IRAS 1750508. Secondly, for a few sources we observe a deficit of hot dust in the high state. This effect is most pronounced in the source NGC 4151, for which it was observed also by Koshida et al. (2009) using long-term optical and near-IR imaging and attributed to dust destruction.
6 Summary and conclusions
We have used four epochs of quasi-simultaneous (within two months) near-IR and optical spectroscopy of 23 broad-line AGN to study the continuum spectral shape around 1 m. Our main results can be summarized as follows.
(i) The accretion disc spectrum appears to dominate the flux at m, which allows us to derive a new relation that can be used to estimate AGN black hole masses. It is based on the near-IR virial product, defined here as the product between the width of the Pa broad emission line and the integrated 1 m continuum luminosity. The dominance of the accretion disc spectrum at such long wavelengths means that the AGN state can be determined directly from the near-IR spectrum, making simultaneous optical spectroscopy for a reverberation programme unnecessary.
(ii) An adequate subtraction of (in particular optical) host galaxy light reveals that the AGN continuum in the rest-frame frequency range of Hz can be approximated by the sum of mainly two emission components, a hot dust blackbody and an accretion disc spectrum.
(iii) For the hot dust component we derive temperatures in the range of K, which are typical values of the dust sublimation temperature, with a mean of K. This mean value is close to the sublimation temperature of silicate dust grains, indicating that either carbonaceous dust is rare in AGN or that some other mechanism than dust sublimation sets the maximum dust temperature. The resulting hot dust covering factors are relatively low and in the range of , with a mean of .
(iv) Our preliminary variability studies have identified promising candidates for a future near-IR reverberation programme. Our three most variable sources in the near-IR are 3C 273, HE 1228013 and NGC 4151. Furthermore, we have studied the response of the hot dust emission to changes in the accretion disc flux. Most sources show the expected time lag, but a few sources have a deficit of hot dust in the high state, which indicates dust destruction.
In our future work we will study the variability of the near-IR broad emission lines and constrain their physical conditions using detailed photoionisation models. In the longer term we plan to image our sample with current and future near-IR interferometers (Elvis & Karovska, 2002).
Acknowledgments
We are indebted to Brad Peterson for stimulating discussions and his help with the general project. We thank Perry Berlind and Mike Calkins for the FAST observations and Susan Tokarz and Nathalie Martimbeau for the reduction of these data. M. C. B. acknowledges financial support by the National Science Foundation (grant AST-0604066). This research has made use of the NASA/IPAC Extragalactic Database (NED), which is operated by the Jet Propulsion Laboratory, California Institute of Technology, under contract with the National Aeronautics Space Administration.
References
- Barvainis (1987) Barvainis, R. 1987, ApJ, 320, 537
- Bentz et al. (2006a) Bentz, M. C., et al. 2006a, ApJ, 651, 775
- Bentz et al. (2009) Bentz, M. C., Peterson, B. M., Netzer, H., Pogge, R. W., & Vestergaard, M. 2009, ApJ, 697, 160
- Bentz et al. (2006b) Bentz, M. C., Peterson, B. M., Pogge, R. W., Vestergaard, M., & Onken, C. A. 2006b, ApJ, 644, 133
- Carleton et al. (1987) Carleton, N. P., Elvis, M., Fabbiano, G., Willner, S. P., Lawrence, A., & Ward, M. 1987, ApJ, 318, 595
- de Vaucouleurs et al. (1991) de Vaucouleurs, G., de Vaucouleurs, A., Corwin, H. G., Jr., Buta, R. J., Paturel, G., & Fouque, P. 1991, Third Reference Catalogue of Bright Galaxies (Springer-Verlag Berlin Heidelberg New York, Volume 1-3, XII)
- Denney et al. (2006) Denney, K. D., et al. 2006, ApJ, 653, 152
- Denney et al. (2010) Denney, K. D., et al. 2010, ApJ, 721, 715
- Dickey & Lockman (1990) Dickey, J. M., & Lockman, F. J. 1990, ARA&A, 28, 215
- Elvis & Karovska (2002) Elvis, M., & Karovska, M. 2002, ApJL, 581, 67
- Elvis et al. (1994) Elvis, M., et al. 1994, ApJS, 95, 1
- Fabricant et al. (1998) Fabricant, D., Cheimets, P., Caldwell, N., & Geary, J. 1998, PASP, 110, 79
- Ferland (2003) Ferland, G. J. 2003, ARA&A, 41, 517
- Ferland et al. (1998) Ferland, G. J., Korista, K. T., Verner, D. A., Ferguson, J. W., Kingdon, J. B., & Verner, E. M. 1998, PASP, 110, 761
- Floyd et al. (2004) Floyd, D. J. E., Kukula, M. J., Dunlop, J. S., McLure, R. J., Miller, L., Percival, W. J., Baum, S. A., & O’Dea, C. P. 2004, MNRAS, 355, 196
- Frank et al. (2002) Frank, J., King, A., & Raine, D. 2002, Accretion Power in Astrophysics (Cambridge University Press)
- Glass (1992) Glass, I. S. 1992, MNRAS, 256, 23P
- Glass (2004) Glass, I. S. 2004, MNRAS, 350, 1049
- Glikman et al. (2006) Glikman, E., Helfand, D. J., & White, R. L. 2006, ApJ, 640, 579
- Granato & Danese (1994) Granato, G. L., & Danese, L. 1994, MNRAS, 268, 235
- Grandi (1982) Grandi, S. A. 1982, ApJ, 255, 25
- Kimura et al. (2002) Kimura, H., Mann, I., Biesecker, D. A., & Jessberger, E. K. 2002, Icarus, 159, 529
- Kinney et al. (1996) Kinney, A. L., Calzetti, D., Bohlin, R. C., McQuade, K., Storchi-Bergmann, T., & Schmitt, H. R. 1996, ApJ, 467, 38
- Kishimoto et al. (2005) Kishimoto, M., Antonucci, R., & Blaes, O. 2005, MNRAS, 364, 640
- Kishimoto et al. (2008) Kishimoto, M., Antonucci, R., Blaes, O., Lawrence, A., Boisson, C., Albrecht, M., & Leipski, C. 2008, Nature, 454, 492
- Kishimoto et al. (2010) Kishimoto, M., Hoenig, S. F., Antonucci, R., Barvainis, R., Kotani, T., Tristram, K. R. W., Weigelt, G., & Levin, K. 2010, arXiv:1012.5359
- Kishimoto et al. (2009) Kishimoto, M., Hönig, S. F., Antonucci, R., Kotani, T., Barvainis, R., Tristram, K. R. W., & Weigelt, G. 2009, A&A, 507, L57
- Kishimoto et al. (2007) Kishimoto, M., Hönig, S. F., Beckert, T., & Weigelt, G. 2007, A&A, 476, 713
- Kobayashi et al. (1993) Kobayashi, Y., Sato, S., Yamashita, T., Shiba, H., & Takami, H. 1993, ApJ, 404, 94
- Koratkar & Blaes (1999) Koratkar, A., & Blaes, O. 1999, PASP, 111, 1
- Korista & Ferland (1998) Korista, K., & Ferland, G. 1998, ApJ, 495, 672
- Korista et al. (1995) Korista, K. T., et al. 1995, ApJS, 97, 285
- Korista & Goad (2001) Korista, K. T., & Goad, M. R. 2001, ApJ, 553, 695
- Koshida et al. (2009) Koshida, S., et al. 2009, ApJ, 700, L109
- Landt et al. (2008) Landt, H., Bentz, M. C., Ward, M. J., Elvis, M., Peterson, B. M., Korista, K. T., & Karovska, M. 2008, ApJS, 174, 282
- Letawe et al. (2007) Letawe, G., Magain, P., Courbin, F., Jablonka, P., Jahnke, K., Meylan, G., & Wisotzki, L. 2007, MNRAS, 378, 83
- Malkan (1983) Malkan, M. A. 1983, ApJ, 268, 582
- Malkan & Sargent (1982) Malkan, M. A., & Sargent, W. L. W. 1982, ApJ, 254, 22
- Mannucci et al. (2001) Mannucci, F., Basile, F., Poggianti, B. M., Cimatti, A., Daddi, E., Pozzetti, L., & Vanzi, L. 2001, MNRAS, 326, 745
- Markwardt (2009) Markwardt, C. B. 2009, in ASP Conference Series, Vol. 411, Astronomical Data Analysis Software and Systems XVIII, ed. D. Bohlender, P. Dowler, & D. Durand (San Francisco: Astronomical Society of the Pacific), arXiv:0902.2850v1
- Minezaki et al. (2004) Minezaki, T., Yoshii, Y., Kobayashi, Y., Enya, K., Suganuma, M., Tomita, H., Aoki, T., & Peterson, B. A. 2004, ApJ, 600, L35
- Nelson (1996) Nelson, B. O. 1996, ApJ, 465, L87
- Neugebauer et al. (1987) Neugebauer, G., Green, R. F., Matthews, K., Schmidt, M., Soifer, B. T., & Bennett, J. 1987, ApJS, 63, 615
- Ohta et al. (2007) Ohta, K., Aoki, K., Kawaguchi, T., & Kiuchi, G. 2007, ApJS, 169, 1
- Oknyanskij et al. (1999) Oknyanskij, V. L., Lyuty, V. M., Taranova, O. G., & Shenavrin, V. I. 1999, Astronomy Letters, 25, 483
- Peterson (1988) Peterson, B. M. 1988, PASP, 100, 18
- Peterson (1993) Peterson, B. M. 1993, PASP, 105, 247
- Peterson (1997) Peterson, B. M. 1997, An Introduction to Active Galactic Nuclei (Cambridge University Press)
- Peterson et al. (2004) Peterson, B. M., et al. 2004, ApJ, 613, 682
- Peterson et al. (1998) Peterson, B. M., Wanders, I., Bertram, R., Hunley, J. F., Pogge, R. W., & Wagner, R. M. 1998, ApJ, 501, 82
- Petrosian et al. (2007) Petrosian, A., McLean, B., Allen, R. J., & MacKenty, J. W. 2007, ApJS, 170, 33
- Rayner et al. (2003) Rayner, J. T., Toomey, D. W., Onaka, P. M., Denault, A. J., Stahlberger, W. E., Vacca, W. D., Cushing, M. C., & Wang, S. 2003, PASP, 115, 362
- Riffel et al. (2009) Riffel, R., Pastoriza, M. G., Rodríguez-Ardila, A., & Bonatto, C. 2009, MNRAS, 400, 273
- Riffel et al. (2006) Riffel, R., Rodríguez-Ardila, A., & Pastoriza, M. G. 2006, A&A, 457, 61
- Rodríguez-Ardila & Mazzalay (2006) Rodríguez-Ardila, A., & Mazzalay, X. 2006, MNRAS, 367, L57
- Salpeter (1977) Salpeter, E. E. 1977, ARA&A, 15, 267
- Sanders et al. (1989) Sanders, D. B., Phinney, E. S., Neugebauer, G., Soifer, B. T., & Matthews, K. 1989, ApJ, 347, 29
- Suganuma et al. (2006) Suganuma, M., et al. 2006, ApJ, 639, 46
- Sulentic et al. (2000) Sulentic, J. W., Marziani, P., & Dultzin-Hacyan, D. 2000, ARA&A, 38, 521
- Ward et al. (1987) Ward, M., Elvis, M., Fabbiano, G., Carleton, N. P., Willner, S. P., & Lawrence, A. 1987, ApJ, 315, 74
- Whittet (2003) Whittet, D. C. B. 2003, Dust in the Galactic Environment (Institute of Physics Publishing)
- Wills et al. (1985) Wills, B. J., Netzer, H., & Wills, D. 1985, ApJ, 288, 94
Appendix A Original and Corrected Spectral Energy Distributions