Binary microlensing event OGLE-2009-BLG-020 gives a verifiable mass, distance and orbit predictions.
Abstract
We present the first example of binary microlensing for which the parameter measurements can be verified (or contradicted) by future Doppler observations. This test is made possible by a confluence of two relatively unusual circumstances. First, the binary lens is bright enough () to permit Doppler measurements. Second, we measure not only the usual 7 binary-lens parameters, but also the “microlens parallax” (which yields the binary mass) and two components of the instantaneous orbital velocity. Thus we measure, effectively, 6 ’Kepler+1’ parameters (two instantaneous positions, two instantaneous velocities, the binary total mass, and the mass ratio). Since Doppler observations of the brighter binary component determine 5 Kepler parameters (period, velocity amplitude, eccentricity, phase, and position of periapsis), while the same spectroscopy yields the mass of the primary, the combined Doppler + microlensing observations would be overconstrained by degrees of freedom. This makes possible an extremely strong test of the microlensing solution.
We also introduce a uniform microlensing notation for single and binary lenses, we define conventions, summarize all known microlensing degeneracies and extend a set of parameters to describe full Keplerian motion of the binary lenses.
1 Introduction
Gravitational microlensing is nowadays a well established method for discovering binary and planetary systems (e.g. Gould, 2009; Gaudi, 2010). By analyzing flux variations in time, microlensing measures a wide range of system parameters including the distance and mass of the binary, its orbital and proper motion as well as the mass ratio and separation of its components (cf. Dong et al., 2009a; Bennett et al., 2010).
Previous studies of gravitational microlensing events have had little or no possibility for post factum observational confirmation of derived system parameters, since usually the stars involved in this one-time event are too faint and too distant to be within reach of current astrometric or spectroscopic instruments. Some exceptions come from astrometric confirmation of the nature of a single lens event with direct imaging done with Hubble Space Telescope (HST) (Alcock et al., 2001; Gould et al., 2004; Kozłowski et al., 2007). Also in some cases it was possible to take spectra of the microlensed source that confirm the microlensing interpretation (Gaudi et al., 2008b). But the fact of an event being caused by microlensing is the main subject of these tests rather than the values of previously derived parameters. This does not mean that the microlensing measurements have no tests. Indeed there are many self-consistency checks including the agreement of mass and distance with the amount of light coming to us (e.g. Gaudi et al., 2008a; Bennett et al., 2010), as well as testing of the derived values of the orbital parameters being consistent with bounded Keplerian orbits (e.g. Sumi et al. 2010, Batista et al. 2011 in prep., Yee et al. 2011 in prep.). The only issue is the shortage of possibilities to verify the results with independent or direct observations.
In this work we present analysis of one microlensing event (OGLE-2009-BLG-020111http://ogle.astrouw.edu.pl/ogle3/ews/2009/blg-020.html) caused by a binary system passing near the line of sight to an ordinary red giant star. We derive system parameters using the same, standard methods that are applied to other binary and planetary microlensing events. Because of a peculiarity of this event, i.e., that it is caused by a relatively close by ( kpc) and bright () binary star, there is a possibility of direct verification of the derived parameters with follow-up spectroscopic measurements.
The data gathered on this event are described in Section 2. The fitting of the microlensing model to the light curve is presented in Section 3, and the physical parameters of the system are calculated in Section 4. In Section 5 we discuss the results and, in particular, in Section §5.3 we present how the microlensing solutions can be tested by radial velocity measurements. In the Conclusions (§6) we advocate for radial velocity follow-up observations to confirm the nature of the event and its parameters, which constitute a general test of the microlensing method, in particular the accuracy of the parameters currently being derived for microlensing planets.
In Appendix A we present microlensing parameters together with all required conventions, introduce a uniform microlensing notation, extend work of Gould (2000) by introducing parameters describing full Keplerian motion of the lens components, and review symmetries known in microlensing. In Appendix B we derive the transformation between the microlensing and Keplerian orbit parameters.
2 Observational data
2.1 Collection
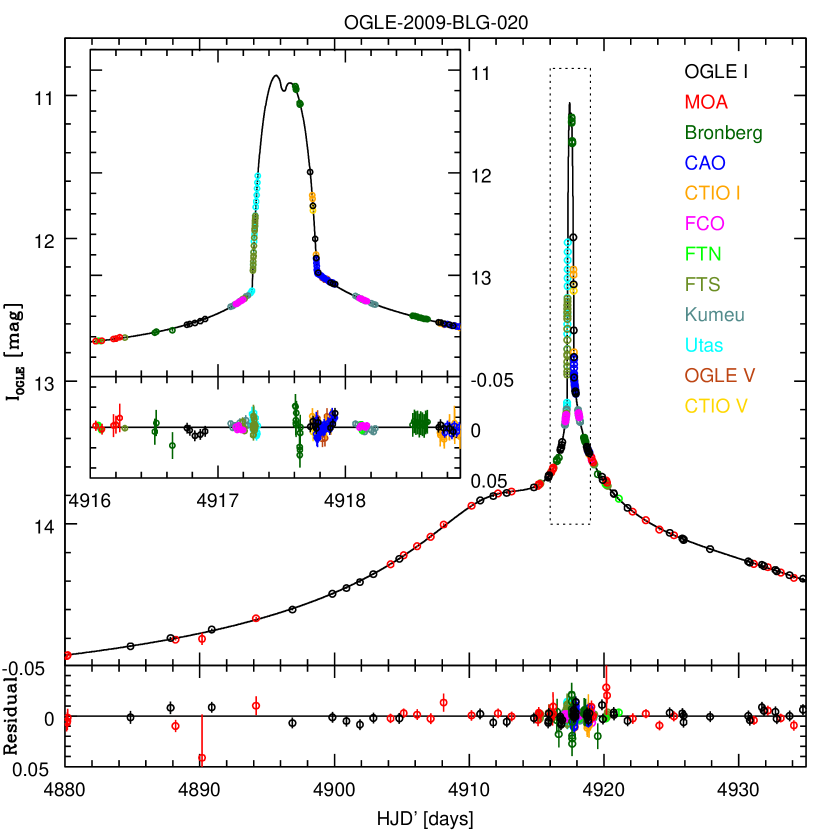
On 15 February 2009, Heliocentric Julian Date (HJD) 2454878, the Optical Gravitational Lensing Experiment (OGLE) team announced ongoing microlensing event OGLE-2009-BLG-020 detected by the Early Warning System (EWS)222http://ogle.astrouw.edu.pl/ogle3/ews/ews.html and observed on the 1.3m Warsaw Telescope in Las Campanas Observatory in Chile. The event was also monitored by the Microlensing Observations in Astrophysics (MOA) 1.8m telescope at Mt. John University Observatory in New Zealand. On HJD′ 4915 () it could be seen that the light curve was deviating from the standard Paczyński (1986) model, and follow-up observations by other telescopes began: First with the 2.0m Faulkes South (FTS) telescope in Siding Spring, Australia and the 2.0m Faulkes North (FTN) telescope in Haleakala, Hawaii operated by RoboNet333http://robonet.lcogt.net/; the 36cm telescope at Kumeu Observatory444http://kumeu.blogspot.com/, New Zealand and the 36cm telescope at Bronberg Observatory, Pretoria, South Africa as a part of Microlensing Follow-Up Network (FUN)555http://www.astronomy.ohio-state.edu/microfun/. Then, shortly before the first caustic crossing occurred (HJD′ 4917.3) observations began on the 1m telescope on Mt. Canopus belonging to University of Tasmania (part of PLANET Collaboration) and the 36cm telescope in Farm Cove Observatory666http://www.farmcoveobs.co.nz/ (also FUN). Essential data near highest magnification (HJD′ 4917.6, March 27th) were gathered by the Bronberg telescope. During the caustic exit (HJD′ 4917.75) there were observations started on the SMARTS 1.3m Cerro Tololo Inter-American Observatory (CTIO) and the 40cm telescope in Campo Catino Austral Observatory (CAO)777http://www.campocatinobservatory.org/, Chile. Some data where gathered by other observers but too short coverage of the event or, in some cases, big error bars prevented us from including these in this analysis. Intense monitoring of the event was performed until HJD′ 4920.
The whole light curve consists of 9 years of data with 121 days during the course of the visible magnification, of which 5 days constitute intense follow-up observations. The OGLE telescope performed observations in and bands, and the CTIO telescope in , and bands, which permit measurements of the color of the magnified source star. Together we have 5333 data points in the light curve with 2247 during the course of the magnification event.
We take the OGLE-III V- and I-band light curves from the project’s final data reductions (Udalski et al., 2008) and calibrate against the Galactic bulge photometric maps (Szymański et al. 2011 in prep.), so that the OGLE magnitudes reported in this paper are standard V (Johnson) and I (Cousins) magnitudes.
The Bronberg data were reduced using MicroFUN’s image subtraction pipelines based on Woźniak (2000). The MOA data were reduced using the survey image subtraction pipeline (Bond et al., 2001). CTIO, CAO, FCO and Kumeu data were reduced using DoPHOT package Schechter et al. (1993). The UTAS, FTN and FTS data were reduced using PySIS (Albrow et al., 2009).
We remove the effects of a differential extinction from the unfiltered Bronberg data by using light curves of non-variable field stars that have similar color to that of the source (for details see Dong et al., 2009a).
The CTIO telescope’s camera, ANDICAM, takes simultaneous exposures in - and -band. Because the data quality in -band is lower than that in -band, we include only the latter into the microlensing fit. However, we use the -band data to calculate color of the source. To do so we cross-match the -band data with the 2MASS catalog888http://www.ipac.caltech.edu/2mass/overview/access.html and calibrate neighboring stars of the lens/source to 2MASS -band magnitudes.
2.2 Preparation
As calculation of microlensing magnification is very time consuming, we bin the data to speed up the fitting procedure. On every part of the light curve and for every observatory individually we carefully choose the number of bins and their start and end points depending on the local slope of the light curve and specifically avoid incorporating seasonal gap (for wide bins) and daily gaps (for short bins) into any bin. Before the actual binning we fit straight lines to the points in the planned bins and check that the points look consistent with the lines. We also check that the slopes for adjacent bins are comparable. We discard 3- outliers from the straight line fits as well as all data points with observational error-bar bigger than 5 times median of the error-bars of nearby points. Our human supervised binning procedure coupled with extensive use of helper algorithms yields 374 binned data points in total.
We rescale the error bars to have for each separate data set (usually coming from different observatories). This is an iterative process wherein we use our best-fit model to evaluate values for each of the data points (where enumerates data sets and is the index of the given data point in this set), then based on these values we find coefficients and (as described below) needed to rescale error bars with the formula: , where and are the uncertainties before and after rescaling. After rescaling we repeat the fitting procedure and find the new values of the coefficients.
To find values of the rescaling coefficients, for each data set , we sort all points by the magnification given by the microlensing model. Then we construct the cumulative distribution of as a function of the sorted index. The goal is to choose the to make the cumulative distribution of a straight line. Then we can choose the scale to match the requirement of .
If we see some systematic variations in the residuals from the best-fit model that are unlikely to be caused by the microlensing phenomena, we investigate whether the deviations are supported by more than one dataset or whether it is likely that observations were affected by high airmass or large seeing. If so, we remove these data as outliers.
Figure 1 presents the light curve of the event. All data points are aligned to the best fit microlensing model. Inset shows the portion of the light curve during highest magnification – when the source is crossing the caustics.
3 Microlensing model
To explain the observed variation in brightness, we fit a binary microlensing model to the light curve. In this scenario the light from a distant source is bent by the binary star (lens) crossing near the light of sight, causing apparent brightening of the source.
In this work we closely follow the notation presented by Gould (2000), where denotes the distance to the lens, the distance to the source, the total mass of the lens, the Einstein radius, and the angular Einstein radius. In Appendix A we propose an extension of this notation to describe full orbital motion of the binary lens.
3.1 Parametrization
The initial mathematical model used to describe this event is constructed using 7 parameters: the mass ratio of the lensing binary (), the projected separation of its components () in units of the Einstein radius, the angle of the lens-source relative motion projected onto the sky plane with respect to the binary axis (), the Einstein crossing time (), i.e., the time required for the lens to travel a distance of one Einstein radius, the time of the closest approach of the adopted center of the lens to the source (), the lens-source separation at this time in units of the Einstein radius (), and the source radius in the same units (). See Appendix A for conventions and full definition of all parameters. We define the primary/secondary as the heavier/lighter component respectively.
In addition, there are two parameters for each observatory that connect the microlensing magnification with the instrumental fluxes in a given band. These are the values of the source flux and an additional flux not being magnified but observed in the same direction in the sky (a blend). If there is any light coming from the lens, it will be included in this blend.
To find a microlensing model we use the method developed by S. Dong and described in Dong et al. (2006) and its modification in Dong et al. (2009b, Section 3).
We introduce a few modifications. For example, we calculate the “caustic width” () used for the grid of lens geometries when searching for initial solutions. Instead of the planetary regime () we are now in a stellar binary regime, i.e., . We can calculate the shorter diameter of the central caustic with the equation:
| (1) |
based on work by An (2005). Unlike the formula of Chung et al. (2005, eq. 12) used by Dong et al. (2009b) the above formula is useful for any mass ratio, although it is accurate only to about for lens separations and accurate to a factor of for and stellar mass ratios (above we are close to intermediate causitic geometry with resonant caustic). Usually a much better accuracy is not required as one uses the caustic dimensions as a basic scale for further searches, although for our event’s geometry and chosen parametrization a more accurate formula is beneficial.
We find that combining the ideas used in both formulae gives us much more accurate results. Namely we divide the Equation (12) of Chung et al. (2005) by the factor making it usable for any mass ratio. This modified recipe is good to about for binary separations and to about for , as we get closer to resonant caustic regime. The final formula by which we calculate the shorter diameter of the central caustic is derived to be:
| (2) |
with the parameter given by Eq. (10) in Chung et al. (2005).
For wide lenses (e.g. for stellar mass ratios) Equation (2) could be multiplied by to produce an estimate of the short diameter of the caustic that is usable for our purposes but is a less accurate approximation.
The factor can be used as well to modify the Equation (11) of Chung et al. (2005) formula for calculating the longer diameter of the central caustic. Although it is usable for stellar binary mass ratios, it is accurate only to the factor of for ( for ).
In our method we also modify the parametrization of the Markov Chain Monte Carlo (MCMC) minimization by using rather than (impact parameter). When we observe a near-cusp caustic crossing or cusp approach in the light curve we can expect that the value of will correlate less with the changes in lens geometry given by and . This is the case in our model for which the dependence of on and is strong but nearly vanishes when is divided by .
3.2 Searching for solutions
First we fit a 7 parameter microlensing model by (after Dong et al., 2009b) creating a broad grid in 3 parameters (, , ) and performing minimization in the remaining 4 parameters, which are chosen to be: , , , and . The values of the fluxes (2 for each observatory) are calculated analytically with the least-squares method. With this standard parametrization we are not able to find a satisfactory solution, in a sense where all data sets can be aligned in a coherent way.
We then extend our model by taking into account the Earth orbital motion during the course of the event. This so called parallax effect is described with 2 additional parameters. We use the geocentric parallax formalism (An et al., 2002; Gould, 2004), wherein we utilize as model parameters (see Appendix A.2 for definition). The parameters , , and , which previously described a straight trajectory of the lens in front of the source, now describe the trajectory we would see if the Earth’s velocity was constant throughout the course of the event and not subject to gravitational acceleration. For the value of this constant velocity we take the real Earth velocity at some fiducial time , and since the shift between real source position and the straight trajectory is by definition equal to zero at this chosen time, it is convenient to fix it close to some important features of the light curve, in our case it is a time between the caustic crossings.
By performing minimization in a similar manner as previously, but with a 9 parameter model, we find a solution capable of explaining the shape of the observed variability. The parameters of this model are gathered in Table 1. We have tested whether there are other solutions emerging from known degeneracies. Our best model has a binary separation smaller than the Einstein radius. We find no solution with a “wide” geometry given by the degeneracy.
The magnitude of the parallax () together with the angular size of the Einstein radius () yield the total mass of the lens () and a distance to the lens () (e.g. An et al., 2002). After Gould (2000) we have:
| (3) | |||
| (4) |
where we derive from the source radius () in units of and the measurement of the angular radius of the source in physical units (, see section 4.1.1) with the equation: . We assume the source to be in the Galactic Bulge at kpc, and thus the source parallax is mas.
The total mass derived from the best ‘parallax-only’ solution is and the distance is kpc. This is in rough agreement with the position of the lens (assuming that all blended light is comming from the lens) on the color-magnitude diagram (CMD) and the assumption that the binary companions belong to the main sequence.
However, there are still some structures in the residuals of the fit, which we hope will be reduced by extending our model by introducing new parameters describing the orbital motion of the lens.
3.3 Expanding the model
3.3.1 Linear orbital motion approximation
The canonical way of introducing orbital motion of the lens into the microlensing model is to add two parameters describing instantaneous velocities in the plane of the sky of the secondary binary component relative to the primary. As we expect that the duration of the binary microlensing perturbation to be only a fraction of the orbital period, the assumption is that these velocities do not change much during the course of the event. Thus, one keeps them constant and uses a linear approximation of the position of the lens components as a function of time: and . Examples of microlensing events modeled using this approximation can be found in: Albrow et al. (2000); Jaroszynski et al. (2005); Dong et al. (2009a); Ryu et al. (2010); Hwang et al. (2010). More discussion of these parameters can be found in §A.4.
We fit our light curve with this, now 11 parameter, model and notice significant improvements in the goodness of fit ( changed from 370.29 to 352.70). This indicates that orbital motion is an important effect in this event. The fit also reveals a very strong degeneracy between two model parameters, namely and lens angular velocity (). We discuss this further in Section 4.2.
3.3.2 Full Keplerian orbit
Although this linear approximation works well for a large subset of microlensing events, in order to allow comparison with the radial velocity (RV) measurements it is profitable to use the full Keplerian orbit parametrization. In addition to being more accurate, the additional advantage of this approach is to avoid all unbound orbital solutions (with eccentricity ) and to enable the introduction of priors on the values of orbital parameters directly into MCMC calculations, if one decides to adopt that approach.
We describe the orbit of the secondary component relative to the primary by giving 3 cartesian positions and 3 velocities at one arbitrarily chosen time (). For convenience we utilize the same time () used for calculating the parallax shifts (). As described above (§3.2), our extended microlensing model (with parallax parameters) carries information about the mass ratio, the total mass of the lens, and the physical scale in the lens plane, so together with the six instantaneous phase-space coordinates it comprises a complete set of system parameters (except systemic radial velocity). This, for example, allows us to calculate the relative RV at any given time.
Let be the projected binary separation in physical units. We define the instantaneous orbital velocities after Dong et al. (2009a, see Appendix) as where and are the instantaneous velocities in the plane of the sky, parallel and perpendicular to the projected binary axis respectively, and is the relative RV, i.e., the relative velocity of the two components perpendicular to the plane of the sky. We note that is the instantaneous angular velocity in the plane of the sky and is equal to . We use the convention that for movement toward the observer; this is opposite to convention usually used in RV measurements (see discussion in §A.5).
Without loss of generality we set the cartesian coordinate system to have its first two axes in the plane of the sky, the origin in the primary component of the lens, and to be rotated in a way that the first axis coincides with the binary axis at the chosen time . Then, the 3-dimensional position of the secondary at can be described by the vector and the 3-dimensional velocities described by , where we have introduced one more parameter: the position along the line of sight () measured in units of . See §A.5 for conventions.
In all, there are now 13 microlensing parameters, in addition to the flux parameters, where is the number of observatories. As this is a full description of the system, it is possible to calculate all properties in physical units as well as standard Kepler parameters of the orbit – i.e., eccentricity (), time of periapsis (), semi-major axis () and 3 Euler angles: longitude of ascending node (), inclination (), and argument of periapsis (). Having those we can find the exact position of the lens components at any given time, which in turn specifies the lens geometry, and the projected position of the source relative to this geometry.
3.4 Priors and their transformation
3.4.1 Priors on orbital motion
The output of the Monte Carlo Markov Chain (MCMC) consists of a set of points in the parameter space. We call this set “a chain”, and every individual solution “a link” in the chain. The density of the points in a given space bin is proportional to a likelihood of this bin. This would be true if we assumed uniform priors on all our fit parameters. However, if we perform a MCMC in the set of parameters , which are given by some transformation function from another set of parameters for which we can find physically justified priors, then those priors have to be converted to the fit coordinates by multiplying them by a Jacobian of this transformation: .
We perform microlensing calculations using the 6 instantaneous cartesian phase-space coordinates. However, our intuition about priors is better in the space of Keplerian parameters. Thus we need to construct transformation function and evaluate its Jacobian. In the Appendix B we derive formulae for .
We assume flat priors on values of eccentricity, time of periapsis, and . To incorporate the fact that orbital angular momentum vector can be oriented randomly in the space, we multiply prior by . So our orbital motion prior, in coordinates of fit parameters, is equal to .
3.4.2 Priors on lens parameters
We also include priors on the lens parameters as expected from the simple Galactic model. Our trial fits to the light curve (with only Keplerian priors) show that the lens has substantial proper motion (of order ) and is located close to the Earth (). These suggest that most of the observed proper motion is due to lens velocity itself (Earth, at the time of the event, is traveling toward the Galactic Bulge, and the effect of the source velocity on the relative proper motion is suppressed by the distance factor). This high proper motion yields linear velocities of . Also the allowed directions of the lens proper motion lie between and relative to the Galactic North (i.e., between Galactic East direction and Galactic South direction), this, in connection with high proper motion yields high probability of a substantial component perpendicular to the disk. This picture is more consistent with Galactic thick disk kinematics rather than thin disk. Thus, in order to impose priors on the lens parameters, we assume that the lens belongs to the thick disk population. This is a less constraining assumption than thin disk, as thick disk allows for grater velocity dispersions.
We follow the approach of Batista et al. (2011, §5.1), but using parameters suitable for a thick disk. In the exponential disk we use scale height and scale length . The probability density of the lens mass is assumed to be proportional to . We expect the velocity dispersion of the thick disk stars to be in the North and East Galactic directions respectively. The expected mean velocity is , where we account for asymmetric drift of the stars of behind the Galactic rotation. The expected velocity of the Galactic Bulge sources is zero and its velocity dispersion is .
From the disk model we assign prior probability density for certain values of lens distance, mass, and lens-source relative proper motion (, and ). We translate these priors to microlensing parameters (, , ) using the Jacobian derived by Batista et al. (2011):
| (5) |
where , , , and .
3.5 MCMC results
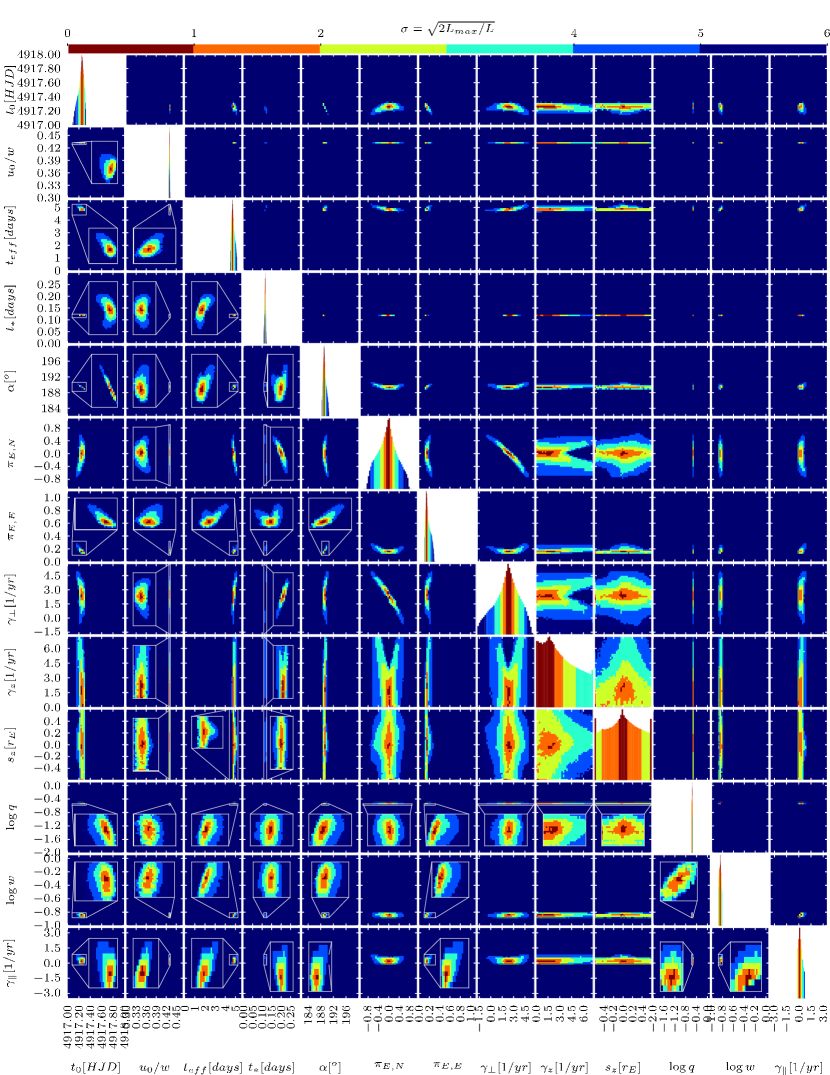
The results from MCMC are presented in Figure 3, where likelihoods obtained from the chain are projected onto the number of 2-d planes, one for each pair of parameters. Those likelihoods are weighted by the priors as calculated above. We present plots in a “typically expected” scale for each parameter to show how well each of them was measured. We also provide insets to show the detailed shape of the likelihood contours (in under-diagonal panels). The diagonal panel for a given parameter shows the posterior likelihood marginalised along all other dimensions. More exact numerical values of parameters from the region of maximal likelihood can be found in Table 1.
4 Physical parameters
4.1 Source star
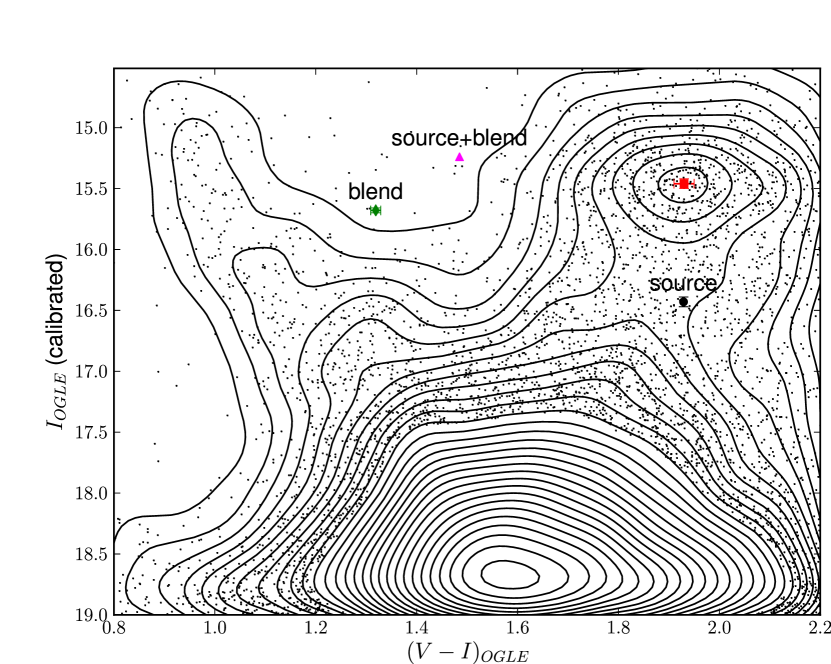
From OGLE-III photometric maps for the Galactic Bulge (Udalski et al. 2008; Szymański et al. 2011 in prep.) we construct a color magnitude diagram (CMD) of stars within around the location of the event (Figure 2). The position of the centroid of the Red-Clump Giant stars on the CMD is derived to be:
| (6) |
We take the intrinsic centroid of the red clump (RC) to be (Bennett et al., 2010), and the color after Bensby et al. (2010, §4.5), we calculate and assume the distance to the Galactic Center to be kpc (Yelda et al., 2010). The location of the observed microlensing event is in Galactic coordinates. When we take into account the inclination of the Galactic Bar we infer that the RC stars in the field are slightly closer than Galactic Center. From Nishiyama et al. (2005) we find a distance modulus smaller by mag. This leads to a RC distance modulus of , which yields estimates of the reddening along the line of sight.
| (7) |
This gives which is comparable to other estimates of the extinction law toward the Bulge (eg. Bennett et al., 2010).
We assume that the microlensing source is located behind the dust causing this reddening. Applying this average extinction to the source brightness obtained directly from the microlensing fit to the calibrated OGLE data:
| (8) |
we obtain the dereddened color and brightness of the source star:
| (9) |
4.1.1 Source radius
Using color-color relations from Bessell & Brett (1988) we infer that the source is a giant star of the spectral type K and we find . We assume solar metallicity for the source star. Then from Houdashelt et al. (2000), we find that the temperature for a cool solar-metallicity giant star with should be about . This is in agreement with Ramírez & Meléndez (2005) who give the temperature equal to .
To find the value of the surface gravity we use the Berdyugina & Savanov (1994) empirical relation for G-K giants and subgiants given by:
| (10) |
where we use to obtain .
Kervella et al. (2004) calibrated the color-brightness relations for giants. We take their relation (14) with dereddened visual magnitude of the source star and color found above. The resulting angular radius of the source is
| (11) |
4.1.2 Limb darkening coefficients
Knowing the temperature of the source star and its surface gravity we find the values of the linear limb-darkening coefficients. We use Claret (2000) Table 30 with the assumption of solar metallicity and turbulence velocity of . Uncertainties on these parameters have a very minor influence on the values of limb-darkening coefficients, with uncertainties in temperature being dominant factor. For bands in which the observations have been performed we find:
| (12) |
For calculations of the magnification of the limb-darkened source we use coefficients in the form of Afonso et al. (2000, §3.1). Their linear limb-darkening coefficient is related to commonly used coefficient with this relation: . Thus, we have:
| (13) |
4.2 The source trajectory curvature degeneracy
There is a substantial degeneracy in the microlensing model between the angular velocity of the lens in the plane of the sky () and the North component of the microlensing parallax (), which can be seen clearly on Fig. 3 (the intersection of row 8 and column 6).
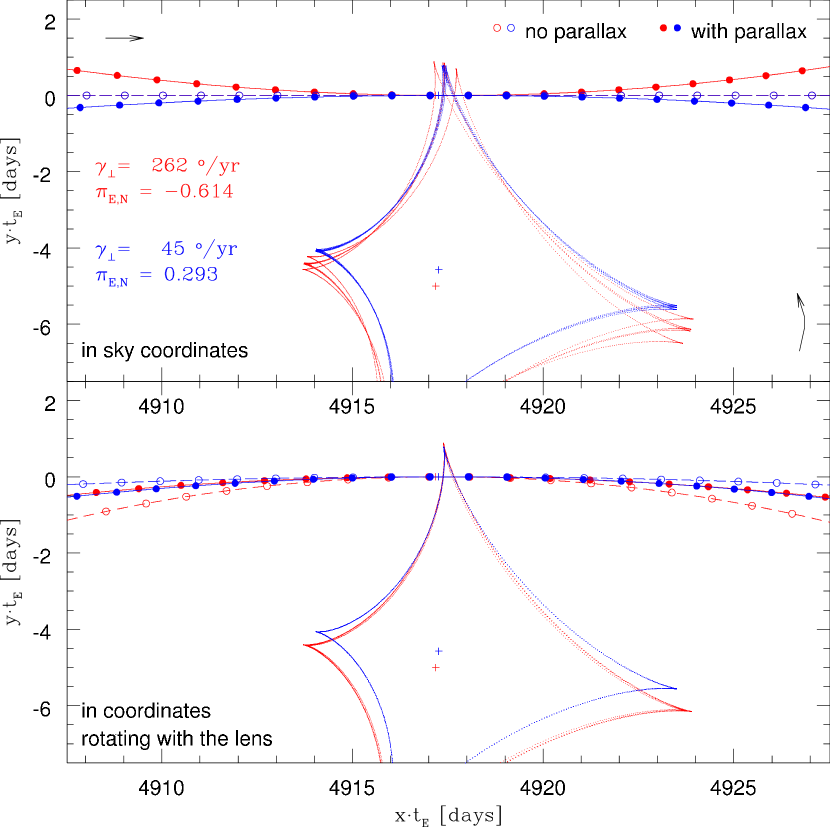
This degeneracy can be predicted to be present in a wide range of microlensing events. It is a purely geometrical effect – both rotation of the lens axis and parallax motion of the Earth have similar effects on the apparent source trajectory in the lens plane. This modification in both cases could be described, to the first order, as a curvature of the source trajectory. Hence the curvature needed to explain observed changes in magnification can be a linear combination of both effects.
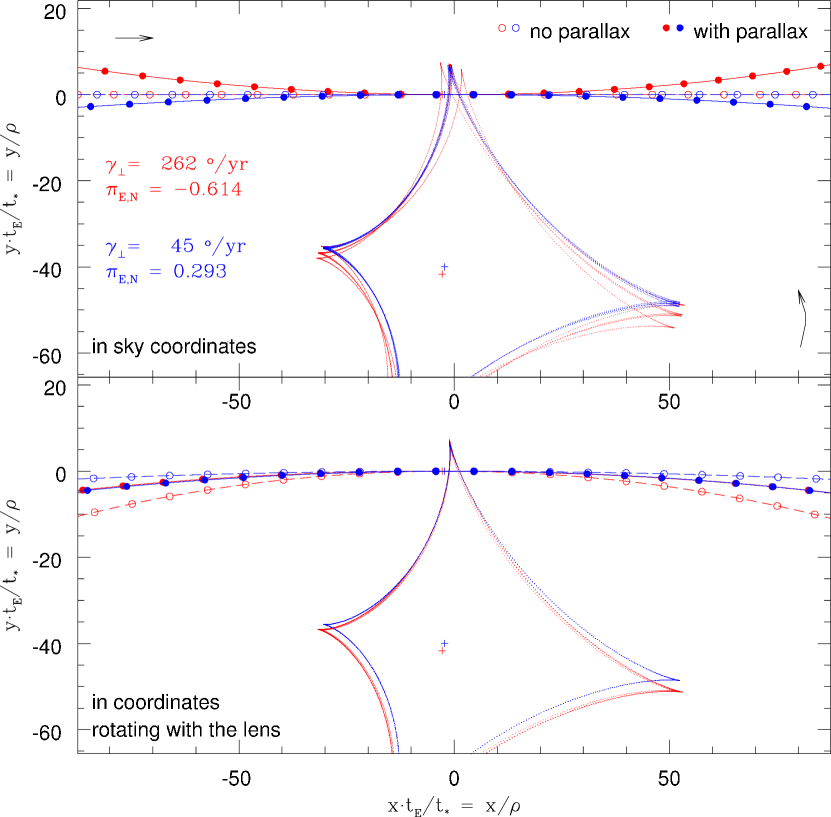
Here we stress the importance of this degeneracy. Our model minimization shows that it could be very severe and have a significant impact on the final value of the distance to the lens and its mass. Figure 4 shows two models, both fitting the observed light curve well, with extremely different values of and , which lead to a very similar effective trajectory of the source on the plane of the lens and finally to similar goodness of fit. Masses and distances derived from these solutions differ by a factor of 2. Note, that both trajectories overlap more closely when plotted in units of source radius rather than time.
In the general case of microlensing events observed toward the Galactic Bulge and with the parallax signal measured, it is very common that the component is well measured and has substantial uncertainty. Looking at Figure 3 in Park et al. (2004) one sees that, if we decompose the parallax vector () into components parallel () and perpendicular () to the direction of the Earth acceleration (near the peak of the event), actually it is the that is well measured and the big uncertainties are in . Since the Earth acceleration vector most of the year lies near the East-West direction, the uncertainty in usually translates to uncertainties in .
For this event, the caustic crossing occurred on 27 March 2009, so very close to the vernal equinox when the apex of the Earth motion was almost directly toward the Galactic Bulge. That is why the direction of Earth acceleration was very close to East, so in this case) is not well constrained.
Because of this “curvature” degeneracy we are unable to accurately determine the distance and the mass of the lens from the microlensing fit only. We need to use other known system parameters such as observed magnitudes and colors of the lens (where we assume that all blended light is comming from the lens). We therefore restrict the set of solutions to those that are consistent with theoretical color-color and color-magnitude relations.
4.2.1 Choosing solutions consistent with the theoretical isochrones
We take a set of Y2 (Yonsei-Yale) Isochrones999http://www.astro.yale.edu/demarque/yyiso.html (Demarque et al., 2004) and from the microlensing fit to the -, - and -band data we infer the magnitudes of the blend. Each link in the chain of solutions gives slightly different values of the observed magnitudes of the blend but, for reader information, we quote the most common ones:
| (14) |
We assume that all non magnified light comes from the binary lens and that the components of the lens are main sequence stars. Given the mass ratio from the microlensing fit we neglect the light input from the secondary and check the consistency of the mass of the primary, its distance, and its luminosity against the theoretical isochrones.
For initial tests we take the isochrone with solar metallicity and age. For each solution (link) we calculate the distance and mass of the primary and from the interpolated isochrone we find the theoretical magnitudes in , and that it should have if seen with no reddening. Then, assuming the slope of the reddening curve and , we find the amount of interstellar reddening in -band () that we should subtract in order to shift the observed magnitudes closest to the theoretical values. We throw out all solutions requiring negative reddening or more reddening than the total amount seen toward the Galactic Bulge source. We also add gaussian weights to each individual link depending on how close it could be placed to the theoretical magnitudes with respect to the error bars, and a weight corresponding to the value of the reddening assuming that it should be about in .
The set of solutions with highest weights lies near , distance kpc and mass for the primary. From the most probable values of parallax parameters ( and ) we see that the likely direction of the transverse velocity of the lens relative to the line of sight is perpendicular to the Galactic plane. The value of the relative proper motion taken from the equation is near , which at the distance of kpc translates to a linear transverse velocity of . These, further constrained kinematic parameters, strengthen our prediction (from §3.4.2) that it is more likely that the lens belongs to a thick disk population. Thus, for final isochrone consistency checks, instead of a Solar-like isochrone, we choose one with an age of Gyr, a sub-solar metallicity () and an -enhanced mixture () which would be more typical for stars with this kind of kinematics.
We prepare a subset of our chain links in which every link has weight added depending on how well it matches with the theoretical isochrone. The region of parameter space that coincides with the magnitudes from the isochrone, has:
| (15) |
4.2.2 Choosing solutions consistent with the spectroscopic mass
Even if some assumptions in the procedure described in the previous section happen to be incorrect, we will see this clearly from the first spectrum taken of the object. The mass of the primary could be estimated from the spectrum, and it will be easy to redo the filtering of solutions with this additional information.
In either case, the selected set of solutions could be subsequently tested against the observed RV curve to see if the orbital parameters derived from the microlensing fit are consistent with it.
5 Discussion
5.1 Degeneracies
Nine of the microlensing parameters are known from the fit with very high precision. However, there are two pairs of parameters for which the values are imperfectly measured (see Figure 3). The first, obvious, pair is the position and velocity along the line of sight ( and ), which do not have direct effects on the observed magnification. They are only limited by the requirement of and by the shape of the Keplerian orbit projected on the plane of the sky – to be precise, only by the segment of the orbit that was covered by the lens components during the high magnification period. The other pair of parameters that was not measured well are and , which are degenerate as was described in Section 4.2. We partially break this degeneracy into discrete regions by choosing only those solutions that are in agreement with other information we have on the event (sections 4.2.1 and 4.2.2).
Because the mass of the lens depends on the magnitude of the vector it does not change when the sign of the component changes. This leads to 2 regions along the - degeneracy that yield the same mass.
There is one more degeneracy from which our model suffers, i.e., the orbiting binary ecliptic degeneracy (see §A.4). We note that the ecliptic degeneracy happens when the direction of the Earth acceleration is constant: the one obvious case, is when the source lies on the ecliptic (hence the name of this degeneracy), but the other is when the timescale of the event is much shorter than the characteristic timescale of the changes of the direction of acceleration. This is more likely to occur if the microlensing event happens when Earth is moving toward or away from the source.
This is the case in OGLE-2009-BLG-020, for which the peak magnification happened near the vernal equinox. The Earth acceleration at that time is directed toward East and its direction varies very slowly in time. Note also that at that time so, following (A16), from any set of parameters we can obtain an analogous set by changing:
| (16) |
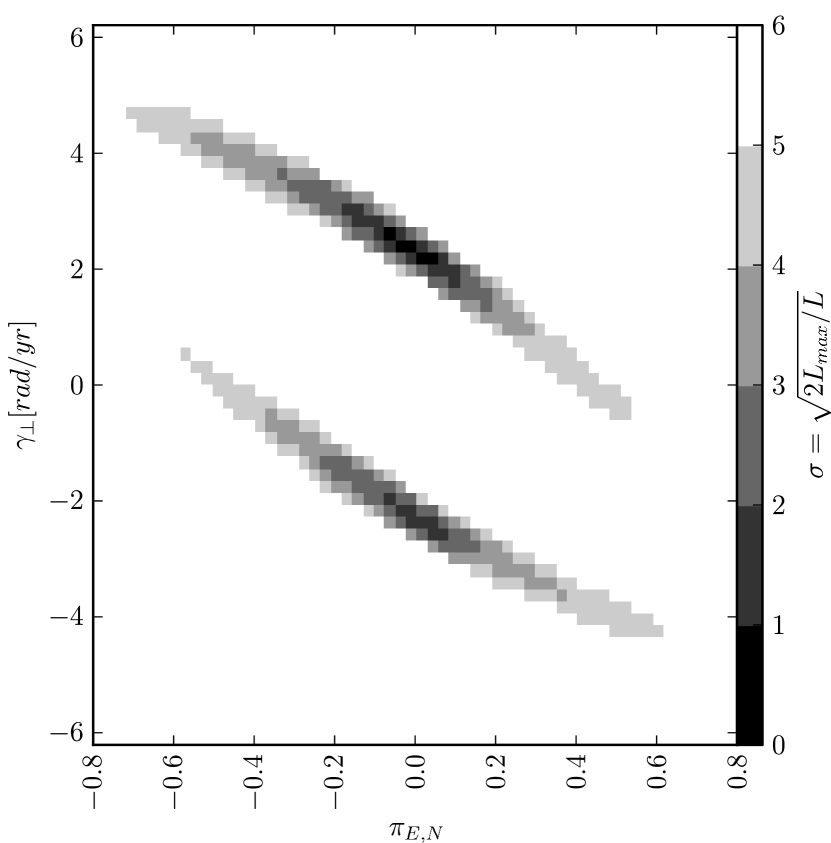
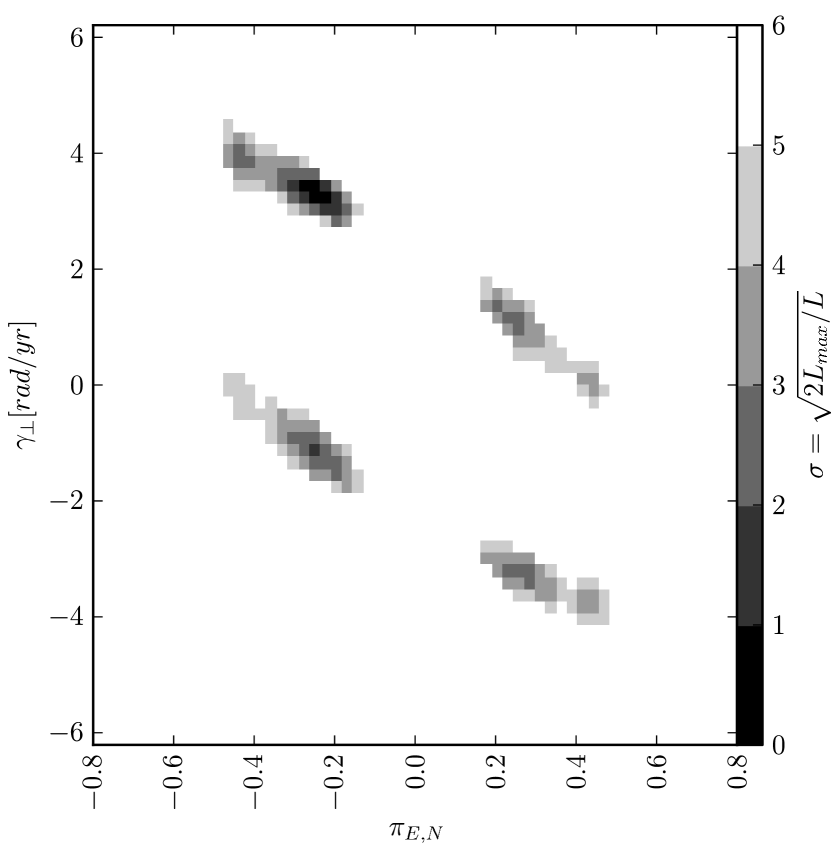
In Figure 5, we see the projection of our set of solutions on the plane of and . The two allowed regions correspond to positive (on top) and negative (bottom) solutions. The left panel shows the full chain while the right panel shows the subset of links that are consistent with the isochrones chosen in Section 4.2.1. Each of the continuous regions from the right panel is split into 2 regions (for positive and negative ), giving 4 separate regions in total.
Note that none of the degeneracies described in this section is exact, this leads to different likelihoods between the 4 regions.
5.2 Symmetries
Changing the sign of without changing the other components of the velocity flips the orbit, which manifests itself as a change of some Euler angles: and .
As microlensing cannot directly measure position and velocity along the line of sight every solution has its copy mirrored by the plane of the sky, i.e., and . For orbit elements it means: and .
Without loss in generality we perform all calculations assuming at the chosen time (). Radial velocity measurements will have information on the sign of the radial velocity – we can then simply mirror our set of solutions using the above prescription.
5.3 Test of the microlensing solution with Radial Velocity
Every link in the MCMC chain represents a complete set of parameters of the binary lens. It yields not only the mass, distance and separation in physical units, but also all Keplerian parameters of the orbit. Thus we can calculate the RV curve for any period of the binary.
Assuming the observations of the RV curve of the primary are taken, we can assign to every link the likelihood that it is consistent with those data. We derive the radial velocity for any time the data were taken and, allowing the systemic velocity of the center of mass of the binary to vary, we calculate the likelihoods for every point. In this way we construct a new set of links weighted by both the microlensing light curve and the radial velocity curve. This new set of solutions yields new, most probable, values of all lens parameters, which may or may not coincide with the values derived from the microlensing only solution. This would be a test of the microlensing solution.
If the new values of the parameters lie outside the 3- limits of the microlensing solution we can say that our method failed. By contrast, if solutions, which are consistent with the RV curve, lie near the best-fit values we obtained from microlensing, we can not only believe our solution, but we can also read off all parameters of the binary, which are not given by one or the other method alone. For example, the radial velocity curve will give us the period and systemic radial velocity, which we cannot read from the microlensing light curve alone. However, microlensing will yield the inclination, orientation on the sky and the 2-d velocity of the binary projected on the plane of the sky.
5.3.1 Example of the test
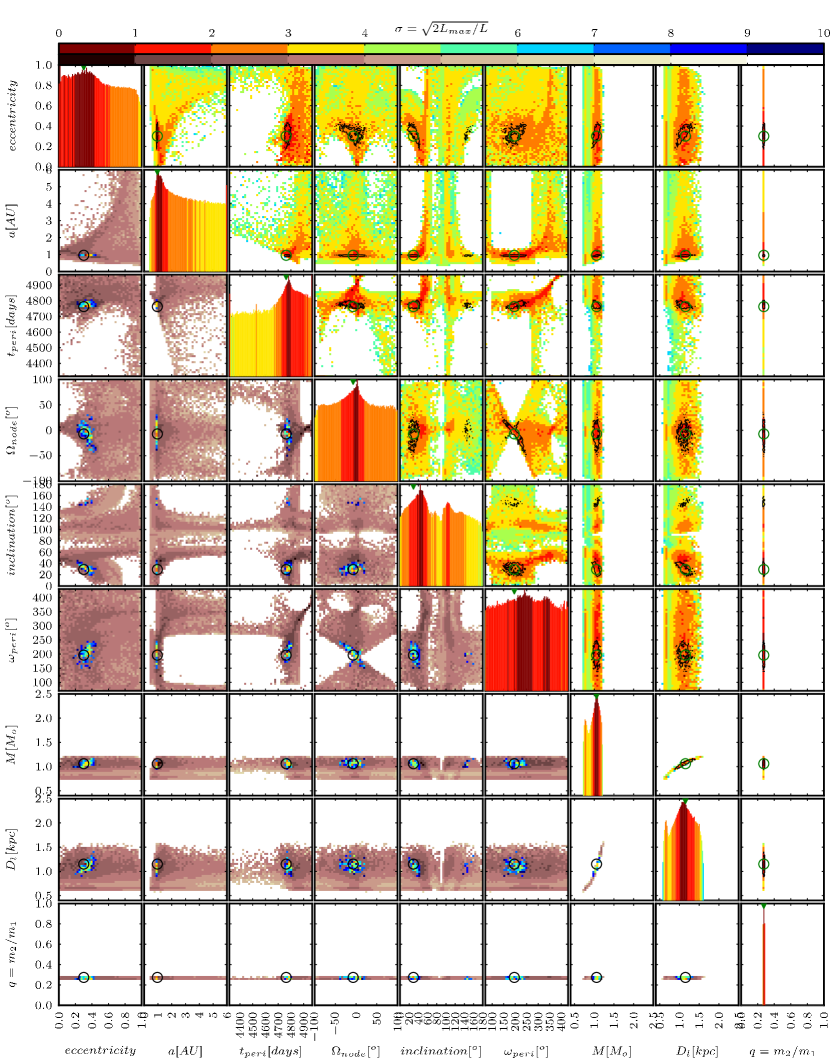
We illustrate this test in Figure 6. The Figure shows (in the background) the likelihoods derived from microlensing solution projected onto 2-d planes of 6 orbital parameters, the mass, distance and mass ratio (this is a subset of the whole chain chosen using the method described in §4.2.1). We take one, exemplary set of binary parameters and simulate the radial velocity curve consisting of 15 measurements taken from March to October 2011 and 15 measurements in a similar period in 2012. We then test our chain against this RV curve assuming a measurements precision of . The solutions with the highest joint likelihoods (from microlensing and RV curve fitting) are overplotted on each panel (in color on under-diagonal panels, and as 10- contour on over-diagonal panels). The initial set of parameters we chose to generate the RV curve is marked with open circles.
We see that all orbital parameters of the “seed” set of parameters are retrieved by the RV comparison process (as the links selected to be consistent with RV curve lie near the circles). This shows the selective power of the radial velocity data, which can prove whether the microlensing solution is wrong or strongly suggest that it is right.
5.3.2 Useful information for RV observations
The selective power of the RV curve holds when the observations are taken through at least one period of the binary. We have chosen a 2 year span of observations since the period we derive from our solutions is between 200 and 700 days (2- limit).
The binary equatorial coordinates are (, , ). The finding chart can be found on the OGLE EWS webpage – the link is given in the footnote in Introduction. The binary is blended with the “microlensing source” which, as the CMD in Figure 2 suggests, is a Galactic Bulge giant. The observed magnitudes of the source are given by Equation (8). The binary has a mass ratio of , so assuming both components are main-sequence stars, the majority of the light is coming from the primary. Observed magnitudes of the binary are given by Equation (14). The binary is magnitude brighter in and mag brighter in than the giant, however they are of similar brightness in .
Since the binary is located in the Galactic Disk, we anticipate it will be clearly separated in the velocity space from the blended Bulge giant. The mass and the distance of the primary, which we predict from the comparison of the light coming from the binary with the theoretical isochrone, is given by Equation (15) in §4.2.1. The radial velocity amplitude of the primary is expected to be .
6 Conclusions
The binary star that manifested itself in the microlensing event OGLE-2009-BLG-020 is the first case of a lens that is close enough and bright enough to allow ground-based spectroscopic follow-up observations. This makes it a unique tool to test the microlensing solution.
We derive lens parameters using the same method by which the majority of planetary candidates discovered by microlensing are analyzed. We detect a signal from the orbital motion of the lens in the microlensing light curve. This signal, as well as our measurements of the orbital parameters of the binary lens, can be confirmed or contradicted by future observations. We propose a test in §5.3.
Combining the microlensing solution with the radial velocity curve will yield a complete set of system parameters including 3-d Galactic velocity of the binary and all Keplerian orbit elements.
This work undertakes an effort to establish a uniform microlensing notation, extending work of Gould (2000) by including the full set of orbital elements of the binary lens (Appendix A). We also summarize all known microlensing symmetries and degeneracies.
The method of deriving orbital elements from the 6 phase-space coordinates, used to parametrize microlensing event, is described in Appendix B. The Fortran codes we use for transformation of the microlensing parameters to orbital elements and for deriving all quantities described in the Appendix B will be attached to astro-ph sources of this paper, and will be published on the author’s web page101010http://www.astronomy.ohio-state.edu/~{}jskowron/OGLE-2009-BLG-020/.
Appendix A Notation, Conventions, and Symmetries
Gould (2000) argued that it would be useful to establish a “standard” system of microlensing notation to both ease comparison of microlensing light-curve fits by different authors, and to facilitate easy entry into the field by outsiders. Since that time, a number of new effects have been modelled, forcing the introduction of new parameters. As was previously the case for the smaller set of parameters listed by Gould (2000), this has resulted in the emergence of multiple systems of notation, often specifically adapted to the problem at hand.
In this paper, we have for the first time, fit a microlensing light curve to parameters representing a complete Kepler orbital solution. Thus, it is appropriate to revisit the question of notation. Indeed the urgency of developing a common set of not only notation, but also conventions, is increased, because it is becoming increasingly difficult to compare microlens solutions of different groups without a “score card”.
To the extent possible, we would therefore like to establish a “standard system” of notation and conventions. However, our fundamental goal is actually slightly less ambitious: to establish a “reference system” of notation and conventions. Then, even if various researchers do not adopt this system, they can still specify how their system is related to this reference system, which will then enable direct comparison of solutions carried out in different systems, and also fairly direct translation of parameters from one system to another.
Finally, as the list of parameters being fit grows, so does the exposition of the meaning of these parameters, repeated in one paper after another, with slight variation. It will be more convenient (and cheaper) if future authors can simply reference this appendix, perhaps supplemented by a few words on how their system differs.
Our general approach will be to begin with the Gould (2000) system, and extend it to new parameters that have “spontaneously” appeared in the literature. The extensions will be guided first by establishing a logically consistent system, and second (to the extent possible) adopting the most popular notation previously developed. A big “logical” consideration is to define parameters that closely parallel observable quantities, so as to avoid introducing unnecessary degeneracies into the fitting process, as would be the case for some physically well-motivated parameters that are not directly constrained by the data.
We will outline a notation system that includes 3 “basic” and 3 “higher-order” point-lens event parameters, 3 additional parameters required to describe static binaries, 2 additional parameters required to describe binary orbital motion in the plane of the sky, and 4 further parameters to describe complete orbital motion. In fact, one of these last four (the angular Einstein radius ) can logically be (and is) introduced much earlier, although it is not essential as fit parameter until the last stage. That is, there are 15 parameters in addition to flux parameters , describing the source flux and blended flux from each observatory. We do not include here parameters for source orbital motion (“xallarap”), nor 3-body systems.
The definition of parameters necessarily requires that we specify certain conventions. We also attempt to make these logically ordered and consistent. Finally, there are two main classes of degeneracies, one continuous and the other discrete. We trace how these two degeneracies “evolve” as additional parameters are added to the description of the system.
A.1 Point Lens Parameters: Basic
For point lens events, the almost universally accepted three basic parameters are
| (A1) |
These are the time of closest approach to the lens system “center”, the lens-source projected separation at that time (in units of the Einstein radius), and the Einstein crossing time. The meaning of system “center” is obvious in the case of a point lens, but will require generalization for more complicated systems. Moreover, even will require more exact specification. We retain these three notations, but defer discussion of the generalizations of their meaning until further below. A derived parameter, which is sometimes used as an independent fitting parameter in place of either or is the “effective timescale”
| (A2) |
A.2 Point Lens Parameters: Higher Order
There are three higher-order parameters that can in principle be measured for point-lens events, and these lead to a fourth derived parameter. The first two parameters are the “vector microlens parallax”
| (A3) |
Here , where is the Einstein radius projected onto the observer plane and is the direction of the lens motion relative to the source expressed as a counter-clockwise angle north through east. The mere introduction of brings with it a large number of symmetries and questions of convention, which will grow yet more complicated as binary lenses come into play. We therefore carefully delineate these in their simpler form here.
First, it has become customary to adopt the “geocentric framework” (An et al., 2002; Gould, 2004), in which all parameters are measured in the instantaneous frame that is at rest with respect to the Earth at a specifically adopted time:
| (A4) |
which is not a fit parameter. Note that the subscript stands for “parameter” (not “parallax”). Thus, for example, is the distance of closest approach of the source and the “lens center” (i.e., for point lenses, simply the lens) in this geocentric frame. Similarly, is the time of this closest approach, and is the time it would take to cross the Einstein radius if the lens-source relative motion were the same as it is as seen from the Earth at . Since the Earth velocity is constantly changing, all of these parameters depend on the choice of . Finally, the direction (but not the magnitude ) of the parallax vector also depends on this choice. In practice, for point lenses, is chosen quite close to so that this is hardly an issue. But the issue will become more important for binary lenses.
Second, point-lens parallaxes are subject to 4 related “degeneracies”, which one might also call “symmetries”. To properly express these, we introduce a different set of basis vectors , where is the component parallel to the apparent acceleration of the Sun (projected on the sky) in the Earth frame at and the pair () is right-handed (Fig. 3 of Gould, 2004). We also must define a convention for the sign of :
| (A5) |
as in Gould (2004, Fig. 2). Then
- 1) Degeneracy:
-
Typically, is much better determined than (Gould et al., 1994) because the former is determined at third order in time and the latter at fourth order (Smith et al., 2003). This can lead to elongated error ellipses in the plane. Only for sufficiently long events (or strong parallax signal) is this degeneracy broken.
- 2) Degeneracy:
-
In the limit that the Earth’s acceleration can be regarded as constant, there is a perfect symmetry between solutions, with only minor adjustment of other parameters (Smith et al., 2003).
- 3) Ecliptic Degeneracy:
-
In the limit of constant direction of acceleration (as would be the case for a source on the ecliptic) there is a perfect degeneracy
(A6) (Jiang et al., 2004; Poindexter et al., 2005). Hence, sources lying near the ecliptic (i.e., all Galactic Bulge sources) may suffer an approximate degeneracy. We note that at times when Earth is moving toward or away from the Galactic Bulge (near equinoxes), the direction of Earth acceleration projected on the sky varies slowly in time. This significantly extends the effect of this degeneracy.
- 4) Jerk-Parallax Degeneracy:
-
This is a discrete degeneracy described in detail by Gould (2004).
The third higher-order point-lens parameter is , the radius of the source in units of the Einstein radius. Of course, is only rarely measurable in point-lens events and is very frequently measured in binary events, and so is usually called a “binary-lens” parameter, but it logically precedes the introduction of binary events, so we include it here. The angular radius of the source can almost always be measured from the instrumental color and magnitude of the source (Yoo et al., 2004). When is also measurable, then one can measure the angular Einstein radius, and so the proper motion:
| (A7) |
If both and are measured, this immediately gives both the lens mass, and the lens-source relative parallax (Gould, 1992)
| (A8) |
Note that the “proper motion” in Equation (A7) is geocentric (i.e., in the instantaneous frame of the Earth at ). To compare with heliocentric proper motions derived from astrometry at successive epochs one must convert (Janczak et al., 2010)
| (A9) |
where is the Earth velocity at projected on the plane of the sky, and where . Clearly this conversion can only be carried out precisely if is known although the rhs shows that the magnitude of the difference can be strongly constrained even if there are only fairly crude limits on .
Note also, that future astrometric microlensing measurements may determine the (geocentric) vector proper motion even if no parallax information is obtained (Høg et al., 1995; Miyamoto & Yoshii, 1995; Walker, 1995).
At this point we also introduce
| (A10) |
the source self-crossing time (in fact, a source radius crossing time). Often, is used in place of as a fitting parameter. Note that sometimes is written as (in analogy to ), but for there is no need to subscript because there are no competing quantities with this same name. Hence, we advocate simplifying the notation and dropping the subscript “”.
A.3 Static Binary-Lens Parameters
A static binary requires 3 additional parameters:
| (A11) |
These are the mass ratio of the two components (==), their projected separation in units of the Einstein radius, and the direction of lens-source relative motion (i.e., lens motion relative to the source) with respect to the binary axis (which points from primary toward secondary). At the beginning one should specify which component of the binary one calls a “primary”. (The angle is counter-clockwise. The fractional mass of the primary, , is defined as .) There are many points to note.
First, the separation is frequently called “” (rather than “”). However, this is the standard symbol for the derivative operator, and so should not be used for other quantities that are likely to appear in the same expressions with this operator.
Second, heretofore, and have been written simply as and . And indeed, for static binaries there is no confusion in doing so, since these are time-invariant quantities. And, for this reason, it remains appropriate to drop the “0” subscript in static analysis. Nevertheless, we introduce this subscript here to maintain consistency with notation developed below.
Third, the choice of is no longer obvious. For high-magnification events, it might be taken as the approximate time of closest approach to the center of magnification, which closely parallels the choice for point lens events. But it might also be chosen to be a particularly well defined time, like a caustic crossing. In any case, since it is not even approximately obvious, it must be specified.
Fourth, in generalizing from point lens to binary lens, there is no longer a unique system “center” by which to define and . However, since this does not present substantive problems until there is orbital motion, we defer discussion of this point until the next section.
Fifth, in the absence of parallax effects, static binaries are subject to an exact degeneracy
| (A12) |
Moreover, even for orbiting binaries, it is always possible to express solutions in a form with and . Hence, in our view, negative should be reserved for solutions that include parallax.
Finally, even if parallax is incorporated into the solution, static binaries will be subject to a “static binary ecliptic degeneracy”
| (A13) |
Note that for lenses seen toward the Galactic Bulge, the directions of positive () are typically (West,North) for austral summer and autumn or (East,South) for austral winter and spring. Hence, from a practical standpoint, it is often easy to locate degenerate solutions by seeding with a sign reversal of .
A.4 Binary-Lens Parameters: Projected Orbital Velocity
We begin by introducing the components of orbital motion
| (A14) |
which are the instantaneous components of velocity of the secondary relative to the primary, respectively parallel and perpendicular to the primary-secondary axis at a fiducial time . These are essentially and , and they are detected effectively from the changing shape and changing orientation of the caustic, respectively. In this form, their relation to the projected physical orbital velocity is particularly simple,
| (A15) |
where is the distance to the lens. Note that is a right-handed system on the plane of the sky, just like (N,E) and
The introduction of these two parameters brings with them two degeneracies. First, allowing for orbital motion reintroduces the continuous degeneracy. This appeared originally for point lenses because of rotational symmetry, which is the physical reason that was fourth-order in time while was third-order (see Section A.2). Now it reappears because of a degeneracy between and the rotational degree of freedom of orbital motion, i.e., as a correlation between and (cf. §4.2). Second, to the degree that the ecliptic degeneracy is present (i.e., to the degree that the acceleration of the Earth does not change direction during the event), it takes the form
| (A16) |
Logically, and can be different, and so we have defined them separately. There may be cases for which one would want them to be different, but we cannot think of any. Therefore, we suggest in general that,
| (A17) |
We will adopt this convention in what follows. (This will also help to avoid confusion involving , which is defined at , and , which, together with other phase-space parameters of the orbit, is defined at .)
We now return to the problem of specifying a “system center”. For simplicity, let us begin by assuming that the binary center of mass is chosen. Then the problem of determining and for a given model is identical to that of a single lens (as discussed in Section A.2) except that may then differ substantially from (since it is convenient to choose near the highest magnification), but this poses no problem of principle. And, in particular, if , then the center of mass and center of magnification coincide, which greatly simplifies the choices. However, if , one might for example choose the system center to be the “center of magnification” and to be approximately the time closest to this center. Then the difference between and would be small, but “center of magnification” would not in general be in rectilinear motion (together with the center of mass). In this example, the “system center” would be offset from the center of mass by
| (A18) |
where are the coordinates on the lens plane parallel and perpendicular to the primary-secondary axis. Note that this offset properly describes the true position of the “center of magnification” only at the one, chosen time () and not at the fit time . Again, for the case just specified, these two times would be very close, so there is little practical impact. However, in other cases, particularly for resonant caustics of roughly equal-mass binaries, might be taken to be near a caustic crossing that is very far from . Then specification of this time becomes extremely important.
For binary lenses with higher-order parameter measurements, one almost always measures . And, because is often degenerate with , it is usually (but not always) inappropriate to attempt to measure without also measuring . This means that when is measured one can usually calculate the ratio of kinetic to potential projected energy (Batista et al., 2011),
| (A19) |
Evaluation of this ratio requires specification of one additional parameter, the source parallax . This is usually known, at least approximately, since most sources are in the Galactic Bulge.
This ratio must absolutely be less than unity, if the system is bound. Moreover, typically it is expected to be in the range 0.25 – 0.6. Hence, evaluating this ratio provides a good plausibility check on the solution. If is measured in mas and is measured in yr-1 (as we advocate), then the numerical coefficient in Equation (A19) is .
A.5 Binary-Lens Parameters: Full Kepler Solutions
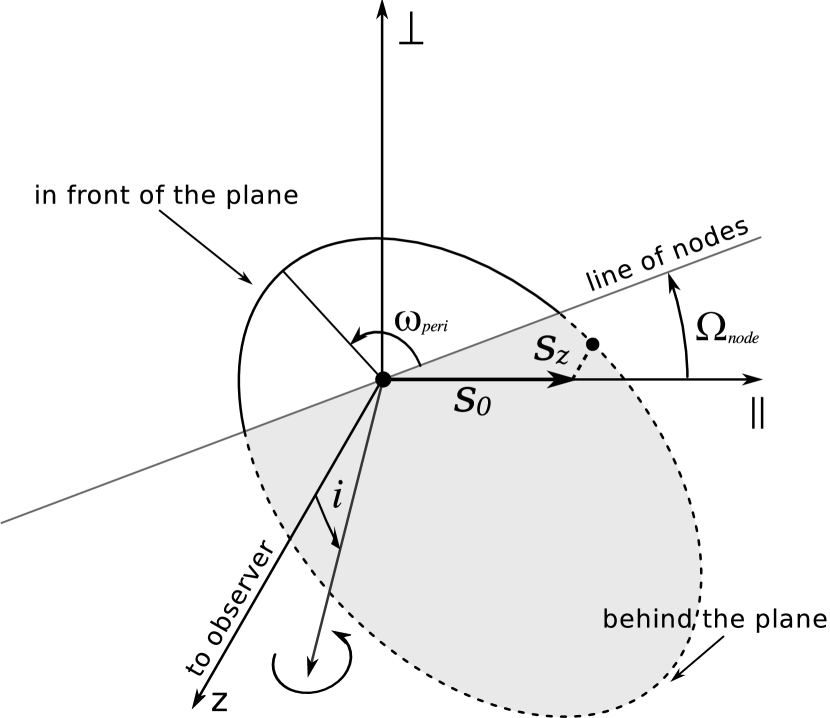
Full Kepler solutions require two parameters in addition to those already mentioned. Since the parameters already specified are in the Cartesian system, we advocate making the last two parameters also Cartesian, namely the instantaneous position and velocity in the direction perpendicular to the plane of the sky at time . Specifically these are and , which are defined so that the physical relative 3-dimensional position and velocity of the secondary relative to the primary are given by
| (A20) |
(see Figure 7). Recall that the -axis is defined by the position of the secondary relative to the primary at . These are right-handed triads, which means that the radial direction points toward the observer, which is opposite to the convention of radial-velocity (RV) work. This conflict is not desirable but is virtually unavoidable. The identification of the -axis with the binary axis is extremely firmly rooted in microlensing tradition. There is then only one way to maintain right-handed 2-dimensional and 3-dimensional systems for : the one adopted above. If we were to choose a left-handed system, it would give rise to substantial confusion in the calculation of orbits, which involve several cross products. Finally, it will be very rare that any RV data are obtained on microlensing orbiting binaries. When they are, one will just have to remember to reverse the sign.
Note that full Keplerian solution is possible for events with and measured. For other events one can always use simplified 2-dimensional description of the orbital motion (§A.4), assuming that the fraction of the orbit travelled by the binary components during the event is small.
There is one final degeneracy associated with two introduced (radial) parameters. As with visual binary orbits, there is a perfect degeneracy of
| (A21) |
which can only be broken with the aid of RV measurements. Hence, microlensing solutions should choose either or . The choice will depend on which quantity is more “isolated” from zero when both are permitted free range. However, this choice should definitely be made to avoid multiple representations of what are in fact identical solutions.
A.6 Summary
Point-lens events are specified by up to 6 parameters , where is the 2-dimensional parallax vector. This is always a geocentric system, explicitly if is specified and implicitly if it is not. Because is a geocentric quantity that depends on the Earth’s velocity, the definition of all of these quantities (except ) requires that a specific time be adopted at which the Earth’s velocity and position are evaluated. The only exception is if is itself not specified. These requirements carry over to binary lenses as well.
If is measured, then it is almost always possible to measure because can be determined from the source flux parameters in two bands.
A total of eight parameters are required to specify a binary orbit. Two of these are secondary/primary mass ratio and the total mass of the system . The remaining 6 are the six Cartesian phase space coordinates of the secondary relative to the primary. In order to relate microlensing parameters to physical units, one must multiply by . The lens distance can be expressed in terms of parameters already specified, plus the source parallax: . Then all but one of the six phase space coordinates appear directly as microlensing parameters and , for the positions and velocities respectively, with all quantities specified at . The missing degree of freedom represented by the “0” in the spatial vector is recovered in , which specifies the direction of lens-source relative motion, measured with respect to the primary-secondary axis at time . We recommend .
For binary lenses, the “system center” must be given explicitly, in order to define . This center must be defined as coordinates on the lens plane as determined at , not at . See Section A.1.
All coordinate systems are right-handed, either in two dimensions [(N,E), , ] or three dimensions (). This means, in particular, that positive points toward the observer.
All relative motion conventions are defined by the motion of the lens (with the source thought of as fixed). Thus, first, the sign of is positive if the lens passes the source on its right. Second, is the angle of lens motion, measured counter-clockwise relative to North. And third, is the angle of the lens motion, measured counter-clockwise relative to the primary-secondary axis.
There are two approximate degeneracies, one discrete and one continuous, which propagate through the analysis as more parameters are added. In their “final form” when binary orbital motion is modeled, the discrete degeneracy is a generalized “ecliptic degeneracy”, which reverses the sign of the four parameters . The continuous degeneracy is between and (with maintaining the same sign). These degeneracies persist in simpler form when some of these parameters are not measured. Finally there is a perfect degeneracy that reverses the signs of , so that the solutions must be restricted to either or to avoid duplicating identical solutions.
Appendix B Transformation between microlensing and Keplerian orbital parameters
In the process of model optimization we describe every solution by a set of 15 ‘microlensing’ parameters (, , , , , , , , , , , ). In order to derive positions of the binary component at every given time we need to know the set of Keplerian parameters. They are also used for introducing priors on the shape of the orbit since our intuition works better in the space of orbital elements rather than cartesian phase-space parameters. In this section we present the formulae we use to transform microlensing parametrization into orbit elements.
As discussed by Batista et al. (2011) for the case of circular orbits, the full Jacobian of the transformation from microlensing to physical coordinates, factors into two Jacobians
| (B1) |
Here we focus on . (Note that, as remarked by Batista et al. (2011), strictly speaking one should consider the parameters and separately, rather than , but as these parameters barely vary over the chain, this makes essentially no difference.). The priors in the microlensing coordinates (used inside the MCMC routine in the transition probability, or used for weighting the likelihoods obtained from the chain) will be the priors in physical parameters multiplied by the Jacobian ().
B.1 Position parameters
We have two systems of coordinates, the first one is relative to the plane of the orbit and the second is related to the microlensing event. The microlensing system, as described in Appendix A, has its first axis set by the binary axis projected onto the plane of the sky, and the third axis toward the observer. For fitting, we use positions () and velocities () in microlensing units. However for the sake of this Appendix we will be using positions and velocities in physical units of and . A simple conversion between these units is given by and , where and can be calculated at any time from the set of microlensing parameters.
In the system of coordinates relative to the orbit, we set the first axis as the direction of periastron, and the third axis as that of the angular momentum vector. The position of the body () in this system is given by:
| (B5) |
where is the semi-major axis, is the eccentricity and is the eccentric anomaly, which is defined as an implicit function of time by the Kepler equation,
| (B6) |
Here is the system mass, is the mean motion, and is the time of periastron.
The velocity in the plane of the orbit is given by the derivative of position:
| (B7) |
where the last result is found by implicit differentiation of Equation (B6). Implicit differentiation also yields
| (B8) |
B.2 Jacobian of the transformation
The equations for and will be useful for calculating relative positions of the binary component at any time and for evaluating the Jacobian of the transformation between the phase-space coordinates used in the microlensing fit and the orbital elements . This in turn will be used to construct the full Jacobian (B1) used for weighting the solution, together with the priors on all ‘physical’ parameters (cf. §3.4.1):
| (B9) |
To calculate we need to evaluate derivatives of every component of with respect to every orbital element. To find we will calculate in the plane of the orbit and then rotate it to the microlensing system of coordinates using the rotation matrix given by the three orbital Euler angles ( – longitude of ascending node, – inclination, – argument of periapsis):
| (B10) |
where:
| (B11) |
and , are the matrix operators of rotation by an angle around the first and third axes respectively:
| (B12) |
Figure 8 shows the orientation of the relative orbit with respect to the microlensing-coordinates system. Conventions used for Euler angles () can also be read from this Figure.
From Equation (B8) we obtain
| (B13) |
| (B14) |
| (B15) |
| (B16) |
where is the acceleration (not to be confused with ).
We then rotate these derivatives with :
| (B17) |
and evaluate
| (B18) | ||||
| (B19) | ||||
| (B20) |
and similarly for .
From all derived derivatives we construct a matrix and calculate its determinant, using LUP matrix decomposition (LU decomposition with partial pivoting) on the lower and upper triangular matrices. Then, the determinant is given by simple multiplication of all diagonal elements of the triangular matrices. The Jacobian () is given by the absolute value of the determinant.
It is useful to note that goes to zero proportional to , so for orbits close to circular or close to face-on, one must be careful about numerical problems when dividing by .
B.3 Deriving orbital parameters from phase-space parameters
In this section we show how to translate phase-space parameters in the microlensing system coordinates to orbital elements .
The specific orbital energy () and specific relative angular momentum () are conserved, so they can be calculated given the values of and at any time.
| (B21) |
If we express in the units of AU, in the units of , and in then . The semi-major axis can be calculated from (B21), and the period can be derived from Kepler’s Third Law:
| (B22) |
Next, we find the unit vectors (versors) of the system of coordinates relative to the orbit, with parallel to the angular momentum vector, and parallel to the eccentricity vector111111The eccentricity vector is related to the Laplace-Runge-Lenz vector () by a scaling factor , , which is a constant of motion and points in the direction of periastron,
| (B23) |
The eccentricity () can also be calculated with formula: .
The 3 versors are then given by,
| (B24) |
From projections of the positional vector () onto the versors ( and ) we calculate the true anomaly (),
| (B25) |
then the eccentric anomaly,
| (B26) |
with the phase ambiguity in itself resolved by
| (B27) |
This convention minimizes .
The time of periastron can be derived from the inverted Equation (B6) written for the current time ():
| (B28) |
The coordinates of the 3 versors describing the orbital coordinate system (, , ) give us the full rotation matrix , defined earlier by Equations (B11),
| (B29) |
We can use this matrix to find the angles , , and from the set of 9 Equations (B11) for every element of . The inclination, which is always , is given by:
| (B30) |
Then, the longitude of ascending node can be calculated from:
| (B31) |
and the argument of periapsis is,
| (B32) | ||||
| (B33) |
(For a special case of face-on orbits () we assume and calculate from: and )
References
- Alard (2000) Alard, C. 2000, A&AS, 144, 363
- Albrow et al. (2000) Albrow, M. D., et al. 2000, ApJ, 534, 894
- Albrow et al. (2009) Albrow, M. D., et al. 2009, MNRAS, 397, 2099
- Alcock et al. (2001) Alcock, C., et al. 2001, Nature, 414, 617
- Afonso et al. (2000) Afonso, C., et al. 2000, ApJ, 532, 340
- An et al. (2002) An, J. H., et al. 2002, ApJ, 572, 521
- An (2005) An, J. H. 2005, MNRAS, 356, 1409
- An et al. (2007) An, D., Terndrup, D. M., Pinsonneault, M. H., Paulson, D. B., Hanson, R. B., & Stauffer, J. R. 2007, ApJ, 655, 233
- Batista et al. (2011) Batista, V., et al. 2011, in prep.
- Bennett et al. (2008) Bennett, D. P., et al. 2008, ApJ, 684, 663
- Bennett et al. (2010) Bennett, D. P., et al. 2010, ApJ, 713, 837
- Bensby et al. (2010) Bensby, T., et al. 2010, A&A, 512, A41
- Berdyugina & Savanov (1994) Berdyugina, S. V., & Savanov, I. S. 1994, Astronomy Letters, 20, 755
- Bessell & Brett (1988) Bessell, M. S., & Brett, J. M. 1988, PASP, 100, 1134
- Bond et al. (2001) Bond, I. A., et al. 2001, MNRAS, 327, 868
- Chung et al. (2005) Chung, S.-J., et al. 2005, ApJ, 630, 535
- Claret (2000) Claret, A. 2000, A&A, 363, 1081
- Dong et al. (2006) Dong, S., et al. 2006, ApJ, 642, 842
- Dong et al. (2009a) Dong, S., et al. 2009a, ApJ, 695, 970
- Dong et al. (2009b) Dong, S., et al. 2009b, ApJ, 698, 1826
- Gaudi et al. (2008a) Gaudi, B. S., et al. 2008a, Science, 319, 927
- Gaudi et al. (2008b) Gaudi, B. S., et al. 2008b, ApJ, 677, 1268
- Gaudi (2010) Gaudi, B. S. 2010, in Exoplanets, ed. S. Seager, [http://arxiv.org/abs/1002.0332]arXiv:1002.0332
- Gould (1992) Gould, A. 1992, ApJ, 392, 442
- Gould et al. (1994) Gould, A., Miralda-Escude, J., & Bahcall, J. N. 1994, ApJ, 423, L105
- Gould (2000) Gould, A. 2000, ApJ, 542, 785
- Gould (2004) Gould, A. 2004, ApJ, 606, 319
- Gould et al. (2004) Gould, A., Bennett, D. P., & Alves, D. R. 2004, ApJ, 614, 404
- Gould (2008) Gould, A. 2008, ApJ, 681, 1593
- Gould (2009) Gould, A. 2009, Astronomical Society of the Pacific Conference Series, 403, 86
- Demarque et al. (2004) Demarque, P., Woo, J.-H., Kim, Y.-C., & Yi, S. K. 2004, ApJS, 155, 667
- Høg et al. (1995) Høg, E., Novikov, I. D., & Polnarev, A. G. 1995, A&A, 294, 287
- Houdashelt et al. (2000) Houdashelt, M. L., Bell, R. A., & Sweigart, A. V. 2000, AJ, 119, 1448
- Hwang et al. (2010) Hwang, K.-H., et al. 2010, ApJ, 723, 797
- Janczak et al. (2010) Janczak, J., et al. 2010, ApJ, 711, 731
- Jaroszynski et al. (2005) Jaroszynski, M., et al. 2005, Acta Astron., 55, 159
- Jiang et al. (2004) Jiang, G., et al. 2004, ApJ, 617, 1307
- Kervella et al. (2004) Kervella, P., Bersier, D., Mourard, D., Nardetto, N., Fouqué, P., & Coudé du Foresto, V. 2004, A&A, 428, 587
- Kozłowski et al. (2007) Kozłowski, S., Woźniak, P. R., Mao, S., & Wood, A. 2007, ApJ, 671, 420
- Miyamoto & Yoshii (1995) Miyamoto, M., & Yoshii, Y. 1995, AJ, 110, 1427
- Nishiyama et al. (2005) Nishiyama, S., et al. 2005, ApJ, 621, L105
- Paczyński (1986) Paczyński, B. 1986, ApJ, 304, 1
- Park et al. (2004) Park, B.-G., et al. 2004, ApJ, 609, 166
- Pejcha & Heyrovský (2009) Pejcha, O., & Heyrovský, D. 2009, ApJ, 690, 1772
- Poindexter et al. (2005) Poindexter, S., Afonso, C., Bennett, D. P., Glicenstein, J.-F., Gould, A., Szymański, M. K., & Udalski, A. 2005, ApJ, 633, 914
- Ramírez & Meléndez (2005) Ramírez, I., & Meléndez, J. 2005, ApJ, 626, 446
- Ryu et al. (2010) Ryu, Y.-H., et al. 2010, ApJ, 723, 81
- Schechter et al. (1993) Schechter, P. L., Mateo, M., & Saha, A. 1993, PASP, 105, 1342
- Smith et al. (2003) Smith, M. C., Mao, S., & Paczyński, B. 2003, MNRAS, 339, 925
- Sumi et al. (2010) Sumi, T., et al. 2010, ApJ, 710, 1641
- Udalski et al. (2008) Udalski, A., Szymanski, M. K., Soszynski, I., & Poleski, R. 2008, Acta Astron., 58, 69
- Walker (1995) Walker, M. A. 1995, ApJ, 453, 37
- Yelda et al. (2010) Yelda, S., Ghez, A. M., Lu, J. R., Do, T., Clarkson, W., & Matthews, K. 2010, [http://arxiv.org/abs/1002.1729]arXiv:1002.1729
- Yoo et al. (2004) Yoo, J., et al. 2004, ApJ, 603, 139
- Woźniak (2000) Woźniak, P. R. 2000, Acta Astron., 50, 421

| parameter | unit | parallax only | parallax + 2 par. motion | parallax + full orbit | parallax + full orbit |
|---|---|---|---|---|---|
| (with priors) | |||||
| 370.29/361 | 352.7/359 | 344.03/357 | |||
| fit parameters: | |||||
| — | |||||
| — | — | ||||
| — | — | ||||
| — | |||||
| derived: | |||||
Note. — Best-fit parameters for 3 microlensing models with different treatment of lens orbital motion: 1) with the lens as a static binary, 2) orbital motion of the lens projected onto sky is approximated by linear changes in time, and 3) orbital motion of the lens is modeled using a full Keplerian orbit. We give the values of the microlensing fit parameters together with 1- limits as obtained from MCMC. The first three sets of parameters are derived from a MCMC run using only likelihoods from the value of with no priors. 4) The solution including priors (on the orbital parameters and on the properties of the lens) lies in 2.2 sigma confidence limit derived from the light-curve only. (All parameters represent positive solutions – top region on Figure 5 – which is slightly preferred. To obtain parameters for negative solutions use formula (16) from §5.1)