UV-to-FIR analysis of Spitzer/IRAC sources in the Extended Groth Strip I: Multi-wavelength photometry and spectral energy distributions
Abstract
We present an IRAC 3.6+4.5 m selected catalog in the Extended Groth Strip (EGS) containing photometry from the ultraviolet to the far-infrared and stellar parameters derived from the analysis of the multi-wavelength data. In this paper, we describe the method used to build coherent spectral energy distributions (SEDs) for all the sources. In a companion paper, we analyze those SEDs to obtain robust estimations of stellar parameters such as photometric redshifts, stellar masses, and star formation rates. The catalog comprises 76,936 sources with [3.6]23.75 mag (85% completeness level of the IRAC survey in the EGS) over 0.48 deg2. For approximately 16 of this sample, we are able to deconvolve the IRAC data to obtain robust fluxes for the multiple counterparts found in ground-based optical images. Typically, the SEDs of the IRAC sources in our catalog count with more than 15 photometric data points, spanning from the ultraviolet wavelengths probed by GALEX to the far-infrared observed by Spitzer, and going through ground- and space-based optical and near-infrared data taken with 2-8 meter class telescopes. Approximately 95% and 90% of all IRAC sources are detected in the deepest optical and near-infrared bands. These fractions are reduced to 85% and 70% for SNR5 detections in each band. Only 10% of the sources in the catalog have optical spectroscopy and redshift estimations. Almost 20% and 2% of the sources are detected by MIPS at 24 and 70 m, respectively. We also cross-correlate our catalog with public X-ray and radio catalogs. Finally, we present the Rainbow Navigator public web-interface utility, designed to browse all the data products resulting from this work, including images, spectra, photometry, and stellar parameters.
Subject headings:
galaxies: starburst — galaxies: photometry — galaxies: high-redshift — infrared: galaxies.1. Introduction
Multi-wavelength observations of blank fields provide a fertile ground for studies of the evolution of galaxies from the early Universe. Indeed, in the past decade we have advanced amazingly in our knowledge about the formation of galaxies thanks to deep field imaging and spectroscopic surveys. The extraordinary success of these surveys is sustained by the coordinated effort of several telescope facilities, institutions, and research groups that gather large collections of multi-wavelength photometry and spectroscopy, providing the entire scientific community with a vast pool of data to analyze. Remarkable examples of this kind of projects are the Hubble Deep Field (HDF) observations (Williams et al., 1996), the Classifying Objects by Medium- Band Observations project (Wolf et al., 2001, COMBO17), Great Observatories Optical Deep Survey (Giavalisco et al., 2004, GOODS), VIMOS-VLT Deep Survey (Le Fèvre et al., 2005, VVDS), All-wavelength Extended Groth strip International Survey (Davis et al., 2007, AEGIS), or Cosmic Evolution Survey (Scoville et al., 2007, COSMOS).
Nevertheless, the full scientific exploitation of these surveys unavoidably needs a consistent merging of the data coming from heterogeneous sources (with different depths and resolutions) to build catalogs of galaxies characterized with panchromatic photometry and spectroscopy. Although a substantial effort has been devoted to create homogeneously processed multi-wavelength catalogs for the most important fields (e.g., Chandra Deep Field South, Wolf et al. 2001; Hubble Deep Field North, Steidel et al. 2003, Capak et al. 2004; EGS, Coil et al. 2004, Ilbert et al. 2006), many of these catalogs are selected in the optical bands (i.e., rest-frame ultraviolet -UV- at high redshift), and lack near-infrared (NIR) imaging (an important dataset for the studies of galaxy populations at high redshift) reaching depths that match the optical observations. Fortunately, the proliferation of deep and wide NIR surveys has supported the publication of an increasing number of multi-band samples selected in the -band (Grazian et al. 2006, Quadri et al. 2007; Wuyts et al. 2008) or IRAC-bands (Rowan-Robinson et al., 2008; Pérez-González et al., 2005, 2008, hereafter, PG05 and PG08). A detailed UV-to-NIR coverage of the spectral energy distribution (SED) improves the estimates of important stellar parameters, such as the mass, age, extinction, or star formation rate (see, e.g., Walcher et al. 2008; Salim et al. 2007). Moreover, in order to obtain the most reliable stellar mass estimates for z2-3 galaxies, and to distinguish young dusty starburst from quiescent galaxies at these redshifts, we need to obtain data probing the rest-frame NIR for these populations (Bundy et al. 2006; Pozzetti et al. 2007; Wuyts et al. 2007; Williams et al. 2009; Muzzin et al. 2009). This became possible with the launch of Spitzer and the use of one of its instruments, IRAC (Fazio et al., 2004), which covers the 3.6-to-8.0 m spectral range.
The power of multi-band catalogs is significantly enhanced when optical and NIR data are complemented with mid-IR (5m) to radio fluxes, such as those from Spitzer/MIPS, SCUBA, VLA or Herschel surveys. These data directly probe the emission of the dust component of galaxies (Santini et al. 2009; Wuyts et al. 2008). Actively star-forming galaxies harbor large amounts of dust, which cause that a fraction of the UV emission, directly related to the ongoing star formation, is extincted and re-emitted in the IR. Thus, modeling the IR emission offers not only a complementary approach to estimate the star formation rate (SFR) of a galaxy but also an improved measurement of the intrinsic UV extinction (Reddy et al. 2006; Daddi et al. 2007; Salim et al. 2007; Iglesias-Páramo et al. 2007). The IR approach to studies of the star formation becomes particularly relevant at higher redshifts, where the number of luminous infrared galaxies (LIRGs, whose integrated IR luminosity is L(IR)1011L⊙) and their contribution to the cosmic SFR density increase significantly (Chary&Elbaz 2001, PG05, Caputi et al. 2007).
The downside to having an exceptional data pool available in many regions of the sky is that the data quality is largely heterogeneous. Unfortunately, the high-redshift community still lacks the existence of a unified database that facilitates the access to the multiple datasets and resources, similar to local extragalactic databases such as the NASA Extragalactic Database (NED) or the Sloan Digitalized Sky Survey (SDSS; York et al. 2000) database.
The purpose of this work is to present a NIR selected sample of galaxies with well sampled spectral energy distributions, and analyze their properties maximally benefiting from the panchromatic data. To do this, we have built an IRAC-3.6+4.5m selected photometric and spectroscopic catalog including data from X-ray to radio wavelengths for 76,936 galaxies at 0z4 in the Extended Groth Strip (EGS).
The EGS has been intensively observed as a part of the All-Wavelength Extended Groth Strip International Survey (AEGIS; Davis et al. 2007) collaboration in order to assemble an exceptional multi-wavelength dataset, including deep optical imaging from the CFHTLS, HST coverage in two bands, UV data from GALEX, and mid-IR and far-IR photometry from Spitzer. In addition, the EGS is the key field for the DEEP2 survey, one the largest and deepest spectroscopic surveys to date (Davis et al., 2003), with more than 10,000 optical spectra down to R24. This vast dataset converts the EGS in one of the main fields for the study of galaxy evolution at different epochs of the lifetime of the Universe. Our goal is get advantage of this impressive multi-wavelength data collection and use it to build UV-to-FIR SEDs, whose analysis will allow us to obtain estimations of interesting parameters, such as the photometric redshifts, stellar masses, and SFRs.
The photometric catalog along with the photometric redshifts and the inferred stellar parameters are intended to become a multi-purpose resource useful for many different scientific goals. Some of them will be presented in forthcoming papers. We make all the catalogs publicly available through our website and through a dedicated a web-interface, dubbed Rainbow Navigator, conceived to facilitate the access to the data, but also to serve as a permanent repository for updates in these catalogs, or similar catalogs in other cosmological fields (e.g., those presented in PG08 for the GOODS fields).
In this paper, we concentrate on the description of the dataset and the methods developed to measure the merged photometry for the IRAC sample in the EGS. We also analyze the multi-band properties of the sample to understand the main properties of the Spitzer surveys. All the multi-wavelength photometry is released in a public database, conceived to allow the astronomical community to access all the results from our work and use them for their own purposes. In a companion paper (hereafter Paper II), we will present our methodology to fit the SEDs presented in this paper, and to estimate photometric redshifts, stellar masses, and SFRs out of them. We will also assess the quality of the inferred parameters, analyzing in detail their intrinsic systematic and random uncertainties.
The outline of this paper follows. In 2 we present the available datasets that we have compiled for this paper. In 3 we present the techniques developed to extract the IRAC 3.6+4.5 m selected sample and we discuss the properties of the IRAC photometry of the sample. In 4 we present the methods developed to build the merged multi-band photometric catalog. In 5 we describe in detail the photometric properties and reliability of the catalog. In 6 we describe the format of the published catalogs, the database built to allow an easy access and handling of those, baptized as the Rainbow Cosmological Surveys Database, and the publicly available web-interface to surf the database, Rainbow Navigator.
Throughout this paper we use AB magnitudes. We adopt the cosmology km-1s-1Mpc-1, and .
2. Data description
The Extended Groth Strip (EGS; = , = +52∘30’) is one of the most targeted cosmological deep fields. Noticeably, a comprehensive panchromatic dataset has been compiled in this field within the AEGIS collaboration (Davis et al., 2007).
The sample of galaxies studied in this paper is based on an IRAC-3.6+4.5 selection. This choice obeys to several reasons. First, the IRAC bands are specially tailored to probe the rest-frame near-infrared (NIR) fluxes of distant galaxies, thus being the perfect tool for studies of massive galaxies at high-z (e.g., Rodighiero et al. 2007; Mancini et al. 2009). Second, the quality, depth and ubiquity of the IRAC observations in the so-called cosmological fields favors the assembly of coherent flux limited catalogs over large cosmological volumes (e.g., PG08), which is the cornerstone of the observational cosmology. The IRAC bands offer an alternative to the less efficient NIR ground-based surveys, and provide a starting point to consistently anchor surveys at longer wavelengths (Spitzer/MIPS, Herschel, ALMA). Despite its lower spatial resolution (FWHM2”; Fazio et al. 2004) compared to optical/NIR ground-based surveys, the image quality of IRAC is very stable and several authors have been able to perform deblending techniques successfully merging IRAC catalogs into their panchromatic datasets (PG05, Grazian et al. 2006, PG08, Ilbert et al. 2009).
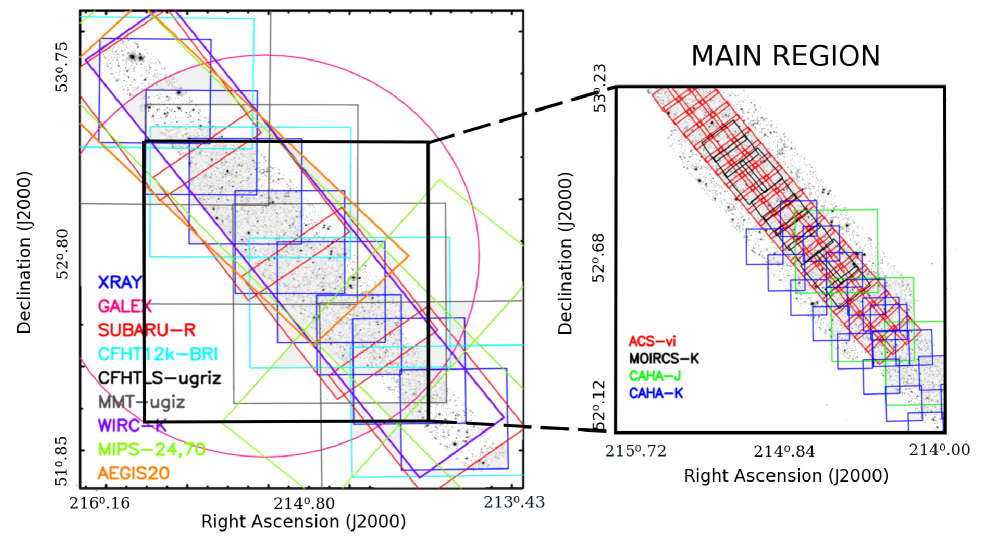
In the rest of this section, we describe the multi-wavelength datasets in EGS compiled for this paper to characterize the IRAC selected sample. Table 1 summarizes the main characteristics of these datasets, including the depth, the area and the image quality. Figure 1 shows the footprints of the various surveys, highlighting the area with higher band coverage.
2.1. X-ray data
The EGS region has been observed in the X-ray (0.5-10 keV) using Chandra/ACIS during two observation cycles in 2002 and 2005. The AEGIS-X survey covers an area of 0.67 deg2 in 8 pointings (17’x17’ each), completely overlapping with the region covered by IRAC. The nominal exposure time of the frames is 200 ks per pixel, reaching limiting fluxes of 5.310-17 and 3.810-16 erg cm2 s in the soft (0.5-2 keV) and hard (2-10 keV) bands, respectively. In this work, we use the data reduction and point source catalogs published in Laird et al. (2009, see also for a first version of the catalogs). The two-band (soft and hard) merged catalog comprises 1325 sources with 1.5% spurious detections. The authors identified optical and NIR counterparts for 1013 and 830 sources, respectively, from the CFHT legacy survey optical catalog (see § 2.3.1), and the Spitzer/IRAC catalog of Barmby et al. (2008). The cross-match is based on maximum likelihood method with a search radius of 2″ (more than a factor of 1.5 the rms of their astrometric accuracy).
2.2. Ultraviolet data
The Galaxy Evolution Explorer (GALEX, Martin et al. 2005) observed the EGS over three consecutive years providing deep UV data in two channels (FUV at 153 nm, and NUV at 231 nm) on a 1.13 deg2 circular area around = , = +52∘47’. The total exposure time for the composite stacks are 58 ks and 120 ks in the FUV and NUV filters, respectively. The approximate limiting magnitude in both bands is 25.1 mag.
2.3. Optical data
2.3.1 CFHTLS/CFHT12K
A 1 square region centered on the coordinates = , = +52∘40’56” was observed within the Canada-France Hawaii Telescope (CFHT) Legacy Survey (CFHTLS; sector D3). Using the MEGACAM camera on the CFHT, imaging data were obtained in five broadband filters over the wavelength range 350 nm940 nm: . The overall exposure times ranges from 4h to 40h (for the and bands, respectively), reaching limiting magnitudes between 26-27 mag. The reduced images have gone through several releases. The data used in this paper are part of the CFHTLS ’T0004’ release produced at the TERAPIX data center (Gwyn et al. 2010, in preparation222http://www.astro.uvic.ca/grads/gwyn/cfhtls/index.html). Although the total mosaicked area covers 1 deg2, the overlap with the IRAC observations is just 0.35 deg2.
In addition to the CFHTLS data, shallower images were acquired in the , and bands over a larger area, using the wide-field 12K mosaic camera on CFHT. These observations were intended to provide optical coverage for the DEEP2 spectroscopic survey, extending through the whole EGS in 4 different pointings. The observing times were 3-6h, to achieve a limiting magnitude of 25 mag. The photometric catalogs were published within the DEEP2 DR1 (Coil et al., 2004), and the raw (non-reduced) images can be retrieved from the CADC archive333http://www4.cadc-ccda.hia-iha.nrc-cnrc.gc.ca/cadcbin/cfht/wdbi.cgi/cfht/quick/form. We downloaded the raw and calibrations files from the archive to perform our own data reduction and cataloging. This reduction was carried out with the IRAF444http://iraf.noao.edu/ task mscred. The photometric calibration was performed using the public catalogs. The average dispersion of the photometry comparison is smaller than 0.03 mag.
2.3.2 MMT/Megacam
The EGS was observed with the Megacam camera (McLeod et al., 2006) on the MMT in the bands during several campaigns from 2006 to 2009. Four pointings of the 24′24′Megacam field of view were arranged to cover the full extension of the 2 degrees long IRAC mosaic.
The MMT/Megacam imaging data were reduced with a combination of standard IRAF/mscred routines and custom software. Final mosaics were calibrated against the coextensive SDSS photometry with appropriate color corrections. The 5 limiting magnitudes within a 2″ diameter aperture for point sources varies among the four different pointings but are approximately 26.5, 27.2, 26.0, and 26.0 mag in the , and bands, respectively. The effective seeing in the final mosaics is roughly 1″ FWHM or slightly better in some bands.
2.3.3 HST/ACS
As a part of a GO program (PI: Davis), the HST Advanced Camera for Surveys (ACS) acquired deep imaging of EGS in two optical bands: and (hereafter the and images). The ACS survey covers an area of 710.9 arcmin2 (10.170.5) on 63 contiguous tiles following the direction of the IRAC mosaic, covering approximately 50 of the total area surveyed by IRAC, and of the area overlapping with the CFHTLS observations. The fully reduced, drizzled frames and calibration products were released by the AEGIS Team (Lotz et al., 2006). Each science image has an approximate exposure time of 0.6 h per pixel and a limiting magnitude of 28 mag.
2.3.4 Subaru Suprime-Cam
Ground based -band imaging of the EGS was carried out with the Subaru Telescope as a part of the Subaru Suprime-Cam Weak-Lensing Survey (Miyazaki et al., 2007). The Suprime-Cam field of view is 0.25 deg2 in size, covering the whole IRAC map in four pointings. The total exposure time was 30 minutes for each pointing, taken in four 7.5 minute exposures, in a dithering pattern with 1′ spacing. The approximate limiting magnitude is 26 mag. These data were downloaded from the SMOKA database and reduced with the Suprime-Cam pipeline (SDFRED, v1.0).
2.4. Near Infrared data
2.4.1 HST/NICMOS
Simultaneously to the ACS observations, the Near-Infrared Camera and Multi-Object Spectrometer (NICMOS) covered parallel fields in the and bands (hereafter and bands, respectively), with a similar exposure time and a limiting magnitude of 23.5 and 24.2, respectively. The observations were designed to maximize the overlap between both HST surveys. Virtually all (58 out of the 63) NICMOS frames lie within the area covered by the ACS primary imaging. However, the smaller field of view of NICMOS (1’1’) leads to a total NIR coverage of only 0.0128 deg2, with a 90 overlap with the area covered by ACS but less than a with that covered by IRAC.
2.4.2 Subaru MOIRCS
In addition to the optical imaging, NIR observations of the EGS were also obtained with the Multi-Object InfraRed Camera and Spectrograph (MOIRCS) on 5 nights during April - May 2006 (PIs: Fukugita, Yamada) and a complementary run on Jun 25, 2007. The dataset comprises 11 pointings covering a total of 0.09 deg2 oriented along the original strip within and completely overlapping with the HST-ACS and CFHTLS imaging. The median exposure time per frame is 1h for an approximate limiting magnitude of 23-24 mag. The data was reduced using dedicated scripts developed by the MOIRCS team involving the IRAF task MSCRED, plus an additional de-fringing process (see e.g., Kajisawa et al. 2009).
2.4.3 Palomar and Calar Alto imaging
Given the importance of having a continuous band coverage for any kind of study regarding galaxy populations (Wuyts et al., 2007), we have incorporated in our data compilation the POWIR NIR catalog (Bundy et al., 2006). These data were acquired between September 2002 and October 2005 using the WIRC camera in the Palomar 5m telescope. The total surveyed area in the EGS field is 2165 (0.6 ) in the -band and 1/3 of that area in the -band. The approximate limiting magnitudes are and . Note that no images were publicly available for this dataset, so we only use the catalogs.
In addition, we also make use of the NIR imaging obtained by the Galaxy evolution and Young Assembly (GOYA777http://www.astro.ufl.edu/GOYA/home.html) project. Two photometric campaigns were carried out to obtain NIR data of the original Groth Strip =14h17m43s, = 52∘28’41” (Cristóbal-Hornillos et al., 2003) and flanking fields (Barro et al., 2009). Here we make use of the -band images of the flanking fields, observed with the instrument in the 3.5m telescope at Calar Alto Spanish-German Astronomical Center (CAHA). The frames cover a total area of 0.24 deg2 to a limiting magnitude of 20.7.
Finally, we have also included data in the -band from the narrow band survey of H emitters described in Villar et al. (2008). Three 15’x15’ pointings centered at =14h17m31s, =52∘28’11”, =14h17m31s, =52∘28’11” and =14h18m14s, =52∘42’15” were observed in CAHA using the instrument in the 3.5m telescope. The combined pointings cover an area of 0.19 deg2 to a limiting magnitude of .
2.5. Mid-to-far IR data
2.5.1 Spitzer/IRAC
Our sample is drawn from Spitzer near/mid-IR data obtained as part of the Guaranteed Time Observations (GTO, PI: Fazio) and presented in Barmby et al. (2008). We also included additional data from the GO program with ID #41023 (PI: K.Nandra). The GTO IRAC imaging data at 3.6, 4.5, 5.8, and 8.0 were obtained over two epochs (December 2003 and June/July 2004). The dataset comprises 52 different pointings that cover a 210’ strip with approximately the same depth. To achieve this homogeneous coverage and due to scheduling issues, the width of the mosaic is slightly variable along the strip, ranging from 10’ to 17’. The average exposure time per pixel is 2.5 h (9100s) in the four channels. An area of 1440 arcmin2 was observed for 1900s, 930 arcmin2 for 9100s and arcmin2 for 11500s (Barmby et al., 2008). The additional GO data are located in two strips of width 3.5′flanking the original strip and covering the declination range 52.35∘53.25∘. All the data were reduced with the general Spitzer pipeline, which provides Basic Calibrated Data, and then mosaicked with Mopex using a pixel scale half of the original (0.61 arcsec pixel-1). The details of the image quality are discussed in § 3.2.
2.5.2 Spitzer/MIPS 24 and 70
Complementary to the IRAC observations, MIR and FIR observations were also obtained with the Multiband Imaging Photometer for Spitzer (MIPS; Rieke et al. 2004) as part of the GTO and the Far-Infrared Deep Extragalactic Legacy Survey (FIDEL). For this paper, we use the whole GTO+FIDEL dataset, reduced and mosaicked with the Spitzer pipeline and MOPEX+GeRT software. The surveyed area covers approximately the entire strip, being slightly wider on the upper and lower edges. The MIPS mosaic overlaps with the deepest part of the IRAC observations. The mean exposure time at 24 is 7200 s per pixel, while for the 70 channel it is approximately 3800 s. The approximate limiting fluxes are 60 Jy and 3.5 mJy, respectively.
2.6. Radio data
A radio survey at 1.4 GHz (20cm) of the Northern half of the EGS (50% of the IRAC mosaic) was conducted with the Very Large Array (VLA) in its B configuration during 2003-2005. The AEGIS20 survey covers 0.73 deg2 down to 130 Jy beam-1 including a smaller region of 0.04 deg2 with a 50 Jy detection limit (5). The data reduction and the source catalog, comprising 1123 sources, were presented in Ivison et al. (2007).
2.7. Keck Optical spectra
EGS has also been the target of an exhaustive and unique spectroscopic follow up. As one of the DEEP2 fields, optical multi-object spectroscopy has been carried out from 2003 to 2005 with the Deep Imaging Multi-Object Spectrograph (DEIMOS; Faber et al. 2003) on the Keck II telescope. The observations cover the spectral range 640910 nm with a resolution of 0.14 nm. The DEEP2 DR3666http://deep.berkeley.edu/DR3/dr3.primer.html contains spectroscopic redshifts for 13,867 sources at 0z1.4 with a median redshift z0.75. The targets were selected from the CFHT12k BRI images (within 1.31 deg2) in the magnitude range 18.524.1. The spectroscopic redshifts for around 70% of the sources are labeled with a high quality flag (values of 3 and 4, meaning 95% success rate). Lower quality flags are considered unreliable and will be excluded from our analysis here and in Paper II.
We complemented the DEEP2 spectroscopy of z1.4 galaxies with redshifts for z sources from the Lyman Break Galaxy (LBG) survey of Steidel et al. (2003). This survey covers a total area of 0.38 deg2 divided in several fields, one of them centered in the EGS. The observations in EGS consist of a single 15’15’ mask centered at =14h17m43s, =52∘28’48” observed with the Low Resolution Imaging Spectrometer (LRIS; Oke et al. 1995) on Keck. The spectra cover the 400-700 nm range with a median resolution of 0.75 nm. The targets were pre-selected based on the LBG color-color criteria (Steidel et al., 1996) including only candidates brighter than 25.5. The EGS catalog contains a total of 334 LBG candidates in the surveyed area. Out of them, 193 are spectroscopically confirmed to be at z3. Unfortunately, the overlap with the IRAC frame is not complete (and some of the galaxies are extremely faint in the IRAC bands), and we were only able to identify 243 (72% of the spectroscopic sample) LBGs in our 3.6+4.5 m selected catalog (we give more details on these sources in Paper II).
| Band | mlim[AB] | FWHM | Area | Surf. Dens.(103) | Source | |
|---|---|---|---|---|---|---|
| (1) | (2) | (3) | (4) | (5) | (6) | (7) |
| Hard X-Ray | 0.31 nm (2-10 keV) | 3.8 10-16erg cm2s-1 | 0.5-6″ | 0.67 | 1.102 | Chandra/ACIS; Laird et al. (2009) |
| Soft X-Ray | 1.24 nm (0.5-2keV) | 5.3 10-17erg cm2s-1 | 0.5-4″ | 0.67 | 1.540 | Chandra/ACIS; Laird et al. (2009) |
| FUV…………. | 153.9 nm | 25.6 | 5.5″ | 1.13 | 10.5 | GALEX GTO |
| NUV…………. | 231.6 nm | 25.6 | 5.5″ | 1.13 | 24.7 | GALEX GTO |
| ………… | 362.5 nm | 26.1 | 1.0″ | 0.77 | 148.2 | MMT/Megacam |
| ……… | 381.1 nm | 25.7 | 0.9″ | 1 | 152.5 | CFHTLS/MegaCam |
| B…………… | 439.0 nm | 25.7 | 1.2″ | 1.31 | 101.7 | CFHT-12k |
| ………… | 481.4 nm | 26.7 | 1.3″ | 0.77 | 203.8 | MMT/MegaCam |
| ………… | 486.3 nm | 26.5 | 0.9″ | 1 | 163.4 | CFHTLS/MegaCam |
| …….. | 591.3 nm | 26.9 | 0.2″ | 0.197 | 440.7 | HST/ACS |
| ………… | 625.8 nm | 26.3 | 0.8″ | 1 | 363.9 | CFHTLS/MegaCam |
| R…………… | 651.8 nm | 26.1 | 0.7″ | 1 | 220.0 | Subaru/SuprimeCam |
| R…………… | 660.1 nm | 25.3 | 1.0″ | 1.31 | 144.3 | CFHT-12k |
| ………… | 769.0 nm | 25.9 | 0.8″ | 1 | 341.1 | CFHTLS/MegaCam |
| …………. | 781.5 nm | 25.3 | 1.0″ | 0.77 | 275.8 | MMT/MegaCam |
| I…………… | 813.2 nm | 24.9 | 1.1″ | 1.31 | 117.0 | CFHT-12k |
| …….. | 807.3 nm | 26.1 | 0.2″ | 0.197 | 452.1 | HST/ACS |
| ………… | 887.1 nm | 24.7 | 0.8″ | 1 | 179.0 | CFHTLS/Megacam |
| …………. | 907.0 nm | 25.3 | 1.2″ | 0.77 | 214.0 | MMT/Megacam |
| …… | 1.10 m | 23.5 | 0.7″ | 0.0128 | 252.0 | HST/NICMOS |
| …………. | 1.21 m | 22.9 | 1.0″ | 0.195 | 67.0 | CAHA- |
| …… | 1.59 m | 24.2 | 0.8″ | 0.0128 | 252.0 | HST/NICMOS |
| ……… | 1.24 m | 21.9 | 1″ | 0.30 | 30.0 | Palomar-WIRC; Bundy et al. (2006) |
| ………… | 2.11 m | 20.7 | 1.5″ | 0.20 | 18.6 | CAHA- |
| …………. | 2.15 m | 23.7 | 0.6″ | 0.09 | 124.0 | Subaru MOIRCS |
| ……… | 2.16 m | 22.9 | 1″ | 0.70 | 34.0 | Palomar-WIRC; Bundy et al. (2006) |
| IRAC-3.6…….. | 3.6 m | 23.9 | 2.1″ | 0.48 | 315.0 | Spitzer GTO |
| IRAC-4.5…….. | 4.5 m | 23.9 | 2.1″ | 0.48 | 274.4 | Spitzer GTO |
| IRAC-5.8…….. | 5.8 m | 22.3 | 2.2″ | 0.48 | 129.7 | Spitzer GTO |
| IRAC-8.0…….. | 8.0 m | 22.3 | 2.2″ | 0.48 | 115.2 | Spitzer GTO |
| MIPS-24……… | 23.7 m | 19.5 (60 Jy) | 5″ | 0.79 | 30.0 | Spitzer GTO |
| MIPS-70……… | 71.4 m | 15 (3.5 mJy) | 19″ | 0.69 | 6.0 | Spitzer GTO |
| Radio 20cm | 20 cm | 100 Jy beam-1 | 4.2″ | 0.73 | 1.538 | VLA; Ivison et al. (2007) |
| R,redshift…… | 640-910 nm | 24.1 | - | 1.31 | 10.343 | DEEP2 |
Note. —
†Data drawn from a catalog.
Col(1) Name of the observing band.
Col(2) Effective wavelength of the filter calculated by convolving the Vega spectrum (Colina & Bohlin, 1994) with the transmission curve of the filter+detector.
Col(3) Limiting AB magnitude (except for the X-ray catalogs) of the image estimated as the magnitude of a SNR5 detection (see §4 for details on the measurement of the photometric errors).
Col(4) Median FWHM of the PSF in arcseconds measured in a large number of stars (see § 5.4).
Col(5): Area covered by the observations in deg2.
Col(6): Source density per square degree up to the limiting magnitude given in Col(3).
Col(7): Source from where the data were obtained.
3. Description of the sample selection
The dataset described in the previous Section was used to obtain UV-to-FIR Spectral Energy Distributions (SEDs) for all the sources detected in the EGS IRAC survey. This merged photometric catalog was built following the procedure described in PG05 and PG08. Here we review all the basic steps of the method, emphasizing the improvements introduced for this paper concerning the extraction of the IRAC catalog and the band merging procedure.
3.1. The IRAC-3.6+4.5 selection
The source detection in the IRAC data was carried out separately in the 3.6 m and 4.5 m images using SExtractor (Bertin & Arnouts, 1996). The complementary detection in the slightly shallower 4.5-band helps to alleviate the source confusion problems arising from the PSF size and the remarkable depth of the IRAC data. Both catalogs were cross-matched using a 1″ search radius to remove repeated sources. This produces a master IRAC-selected catalog containing the sources detected in any of the two channels. Eventually, most sources are simultaneously detected in both channels.
The average survey depth is remarkably homogeneous across the strip, 10ks, with the exception of two small areas with lower exposure at the top (53.525∘) and bottom (52.025∘) of the mosaic. We took into account the lower exposure times near the edges of the images by defining two different areas: a shallower region with exposure time shorter than 3800 seconds (N(frames)20), and a deeper region covering the majority of the strip. The detection was carried out with different SExtractor parameters in each region, using a more conservative configuration for the shallower region. Then, we used this (more restrictive) catalog to purge some low significance detections in the other catalog within an overlapping area between them (N(frames)=18-25). The purged catalog restricted to the area with N(frames)20 constitutes our master photometric catalog, and it covers an area of 0.50 deg2.
After the detection of sources, we removed spurious sources in the wings of bright stars (where the PSF shows bright knots). For that purpose, first we made a preliminary detection of star-like sources based on the IRAC color-color criteria of Eisenhardt et al. (2004, see Section 5.4). Then, we eliminated detections within the typical distance where the contamination from the star is significant (typically 9″ for the typical star magnitudes and depth of the EGS observations). After masking the regions around stars, the total area covered by the catalog is 0.48 deg2.
Aperture photometry for all 3.6 m+4.5 m detected sources was measured with our own dedicated software (which takes into account pixel fractions appropriately; see PG08) in all four IRAC images, previously registered to the same WCS. The flux is measured in the four IRAC bands simultaneously. If a source is undetected in the shallower bands (i.e., [5.8] and [8.0]) we still measure an upper limit flux as 3 times the rms of the sky. The majority of the IRAC sources are unresolved in the 3.6 m image (FWHM 2″). However, most of them are not point-like, but slightly extended. Consequently, PSF fitting is not effective and photometry is best measured with small circular apertures (PG08; Barmby et al. 2008; Wuyts et al. 2008; Ilbert et al. 2009). The flux measurement in all bands was carried out at the positions specified in the IRAC master catalog. We used a 2″ radius aperture and applied aperture corrections for each band derived from the point spread function (PSF) growth curves. The values of the correction are [0.320.03,0.360.02,0.530.02,0.650.02] mag at [3.6,4.5,5.8,8.0] m. The errors account for the typical WCS alignment uncertainties. For a small number of extended sources (2 of the total catalog, and 75% of them presenting [3.6]22.3), the 2″ aperture tend to underestimate the total magnitudes (by more than a 10%). These sources are typically bright nearby galaxies whose Kron (1980) radius is larger than 4.5″ . The flux measurement for these sources was performed in larger apertures enclosing the full object and applying the extended source aperture corrections given in the Spitzer/IRAC cookbook.
The uncertainties in the IRAC photometry were computed taking into account the contributions from the sky emission, the readout noise, the photon counting statistics, the uncertainties in the aperture corrections, and a 2% uncertainty from the zero point absolute calibration (Reach et al., 2005). We did not assume the uncertainties resulting from SExtractor flux measurement. Instead, we used a more realistic method to determine the background noise that takes into account the effects of pixel-to-pixel signal correlation. This procedure has also been applied to measure the photometric uncertainties in all the bands and is outlined in §4.3. Nevertheless, a straightforward comparison to the SExtractor errors indicates that the noise correlation does not introduce a significant contribution to the flux uncertainties at bright magnitudes, leading to a median increment 0.02 mag up to [3.6,4.5]23.75.
3.2. Completeness and limiting magnitude of the IRAC catalog
We estimated the completeness of the IRAC catalog by analyzing the recovery of simulated sources added in the mosaicked images. The simulations were carried out in the central regions of the mosaic where the coverage is uniform (10ks). Artificial sources spanning a wide range of sizes (from 1″ to 6″ ) and brightnesses ([3.6]16-25 mag) were created on the IRAC images at random locations. The number of simulated sources was chosen to be representative of the Poisson uncertainty in the observed number densities. The source detection and photometry was performed again in the simulated images keeping the same SExtractor parameters as in the original frames. The success rate recovering the simulated sources allow us to estimate the completeness level as a function of magnitude. Figure 2 summarizes the completeness analysis in the four channels. For simplicity, we show only results for point-like sources. The completeness for extended sources is typically 10% lower at faint magnitudes, however, these sources represent a very small fraction of the catalog at these magnitudes. Figure 2 also shows the source density as function of the magnitude in each band. We find that the catalog is 85% complete for point sources with [3.6,4.5]23.75 mag, and 75% complete at [3.6,4.5]24.75 mag. In the two other channels, the detection efficiency is significantly lower, with 85 completeness at [5.8,8.0]=22.25, and the completeness dropping rapidly beyond that magnitude. Note that the forced photometric measurement in these bands provides a significant number of 5 (vertical dashed lines in Figure 2) detections that would be missed otherwise.
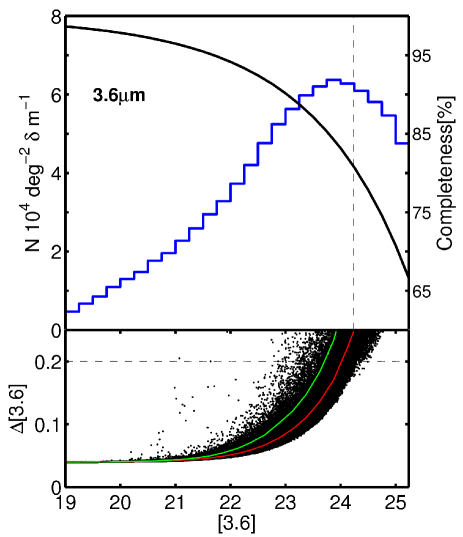
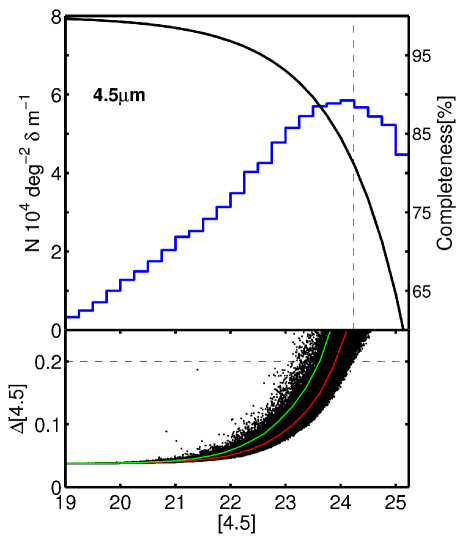
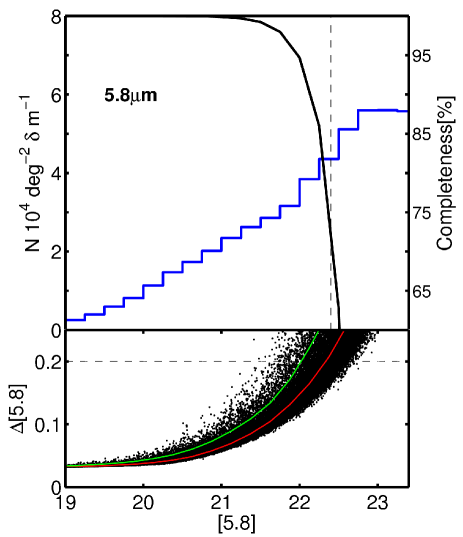
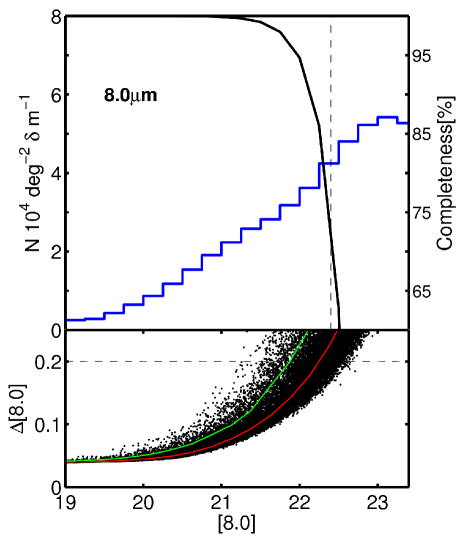
The lower panels of Figure 2 show the photometric uncertainties as a function of magnitude in the four IRAC bands. The red and green lines indicate the median and the level enclosing 90 of the distribution, respectively. For the region with the deepest coverage, we estimated a 3 limiting magnitude of [3.6,4.5]24.75 and [5.8,8.0]22.90 from the median value of the sky rms in our default photometric apertures (2″ radius).
The 3.6+4.5 m catalog contains 70,048 and 99,618 sources with [3.6]23.75 and [3.6]24.75 respectively. The median magnitude of the sample up to [3.6]24.75 is [3.6]=23.14, and 75% of the sources present [3.6]23.96. Note that these numbers correspond to the IRAC 3.6+4.5 m catalog before applying the de-blending technique discussed in § 5. Consequently, the number of sources quoted above is lower than in the final catalog (see Table 2).
3.3. Comparison to Barmby et al. IRAC selected catalog
Here we compare our IRAC photometric catalog to that published by Barmby et al. (2008, hereafter BAR08). BAR08 used the same dataset (except for the GO flanking regions) and obtained final mosaics in all 4 IRAC bands with a very similar reduction to ours. Concerning the source detection, our method is slightly different from BAR08 since we detect galaxies in both the 3.6 and 4.5 m channel instead of only using the bluer band. Our dual detection technique helps to alleviate the source confusion problems arising from the PSF size and the remarkable depth of the IRAC data. In addition, we measure fluxes in the four channels simultaneously, obtaining upper limit values for undetected sources in the shallower bands ([5.8] and [8.0]). Note also that we have increased the resolution of our catalog by deconvolving blended sources using higher resolution information from ground-based observations (§4.1). However, for the sake of clarity, we compare here the BAR08 catalog with ours before carrying out the deblending procedure.
BAR08 measured aperture photometry with SExtractor. The publicly available catalog111http://www.cfa.harvard.edu/irac/egs/ includes MAG_AUTO and MAG_ISO measurements, jointly with aperture magnitudes for several radii corrected to total magnitudes with empirical PSF corrections. We compare our photometry to the magnitudes measured in the 3.5 pixel aperture (2.1″) by BAR08. Their aperture corrections agree with our measurements for the 4″ diameter aperture within the errors (due to alignment uncertainties).
BAR08 and our catalog are cross-correlated in the region of highest exposure (texp4ks) using a 1″ radius. The comparison of the WCS between the two mosaics is in very good agreement, with a rms of 0.05″ . We find 41,514 and 52,130 sources in common up to [3.6]23.75 and [3.6]24.75, respectively.
Attending to the density of sources per unit area, we find that our catalog includes %5% and %7% more sources than the catalog published by BAR08 at [3.6]23.75 mag and [3.6]24.75 mag, respectively. The uncertainties in these measurements were estimated by comparing number counts in 0.5 mag bins, including Monte-Carlo simulations on the photometric errors.
The different source densities are a consequence of their more conservative SExtractor detection threshold. We have carefully chosen the SExtractor parameters differentiating between the regions with high/low coverage (§3.1), trying to push down the detection limits as much as possible without degrading the reliability of the entire catalog. As a consequence, our catalog recovers a larger number of sources at fainter magnitudes, and the completeness of our catalog is larger than BAR08 for the same magnitude. For example, they quoted a completeness for point-like sources at [3.6]23.75 mag, compared to our estimated . Unfortunately, lowering the detection threshold inevitably increases the number of spurious detections. However, in the context of a merged multi-band photometric catalog, spurious detections can be efficiently identified as sources only detected by IRAC (cf. N(band)5), and we will show that the reliability is %, with false detections located almost uniquely around very bright sources (see § 5.3).
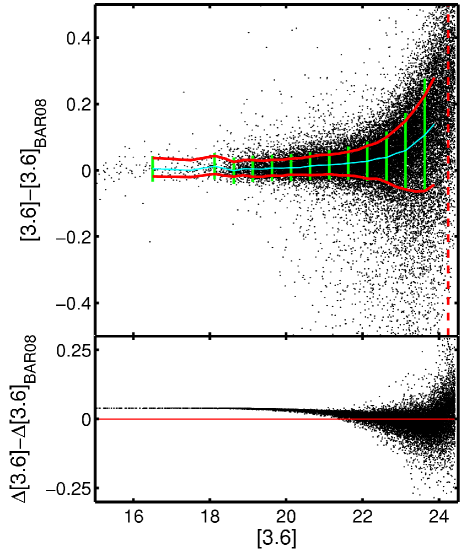
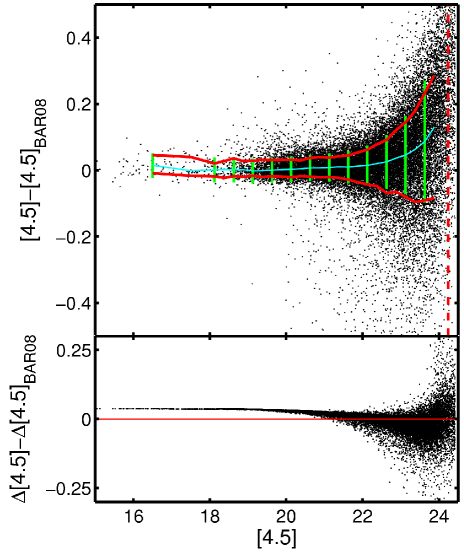
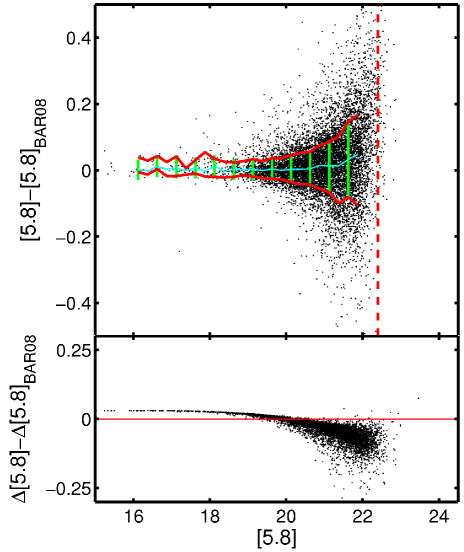
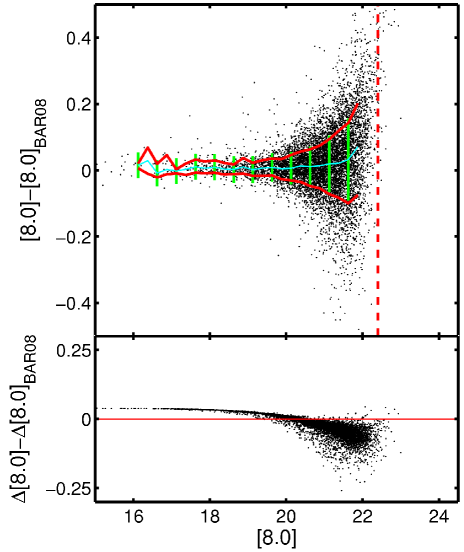
Figure 3 shows the comparison of the photometric magnitudes in the four bands for both catalogs. In both cases the flux was measured on circular apertures and corrected to total magnitudes using aperture corrections. We have corrected the comparison by a constant value of -0.05 mag in [3.6] and [4.5], and by -0.04 mag and -0.03 mag in [5.8] and [8.0], respectively. Such small offsets are attributed to slight differences in the data reduction (final absolute calibration, frame stacking, registering and mosaicking) and in the aperture corrections. Despite the small offsets, the overall results in the four IRAC bands are in good agreement. Note that the average photometric error in our catalog for each magnitude bin (green bars) encloses 1 of the values around the median difference (red and cyan lines).
The lower panel of each plot in Figure 3 shows the comparison of the photometric errors in BAR08 and in our catalog. Our quoted photometric uncertainties tend to differ from BAR08, specially at faint magnitudes. In contrast with that paper, we have considered zero-point and WCS uncertainties, resulting on slightly larger uncertainties (0.05 mag) in our catalog for bright sources up to [3.6][4.5]21 mag and [5.8][8.0]19 mag. At fainter magnitudes, the photometric uncertainties increase with magnitude at a faster rate in the catalog of BAR08. The cause for this difference is the procedure to measure the background noise. Similarly to BAR08, we estimated this value from the sky variance measured in circular apertures at different locations of the images that are empty of sources (§4.3). However, the definition of an empty region depends on the limits of source detection. Therefore, given our higher detection fraction, our sky regions would contain, in principle, lower signal pixels effectively decreasing the rms. In addition, our photometric procedure estimates uncertainties on a source-by-source basis studying the background around each object in a independent way, while BAR08 relied on SExtractor photometric errors and applied a correction to them based on the average properties of the mosaic. Nevertheless, our estimates of the photometric errors are consistent with the observed scatter of the comparison between our photometry and that measured by BAR08.
4. Multi-wavelength photometry: the Rainbow catalog
Using the whole dataset available in the EGS field, we created a multi-wavelength photometric catalog for the IRAC selected sample described in the previous Section. For that purpose, we used the Rainbow software package, described in detail in PG05 and PG08. This software was created to: (1) cross-correlate multi-band catalogs and obtain consistent (aperture matched) photometry on the different bands to build a UV-to-FIR SED; (2) estimate stellar parameters, such as photometric redshifts, stellar masses, and SFRs from those SEDs. In the rest of this Section we will describe the photometry procedure, and in Paper II we will present the methods to estimate photometric redshifts, stellar masses, and SFRs out the SEDs.
4.1. Cross-correlation and source deblending
The Rainbow code starts from a primary selection catalog (in our case, IRAC selected) and obtains merged photometry and spectroscopy in other bands. The first step is to identify the counterparts of the IRAC sources in the other bands, where SExtractor catalogs have been built following typical procedures. These catalogs are cross-correlated to the 3.6+4.5 m positions using a 2″ search radius. An exception to this rule are the MIPS, radio and X-ray catalogs. For the MIPS and radio bands, we used a 2.5″ and 3″ radius, respectively, recognizing possible alignment and center estimation problems of the order of one pixel. For the latter, instead of using the WCS of the X-ray sources, we cross-matched to the positions of the IRAC counterparts (given in Laird et al. 2009) using a 1″ radius. These authors used as reference the IRAC catalog of BAR08, which cover a slightly lower area than ours. Thus, for sources outside of the BAR08 mosaic we cross-matched to the X-ray coordinates using a 2″ radius. (see § 5.2 for more details).
The IRAC sources are identified in this way with objects in all the other catalogs. One of the optical catalogs (typically the deepest; in the EGS, the Subaru -band data) is used as a reference to narrow the following cross-correlations and alleviate confusion problems present in the IRAC images. As the cross-correlation to the catalog of spectroscopic redshifts is done to the coordinates of the counterpart in the reference (optical) band, it is possible to choose a more reliable 0.75″ search radius for this catalog.
Before the cross-matching procedure is carried out between a pair of images, these are re-aligned locally within a 4′4′ square region using the positions of several sources (typically more than 20) as reference. The mean rms between the central coordinates of matched sources in optical/NIR images is typically 0.1″ and 0.2″ between the IRAC and the ground-based images. This procedure allows to overcome small misalignment problems between the frames, and assures a reliable identification of counterparts, and an accurate positioning of the photometric aperture in all bands. It also allows to obtain reliable photometry (in the appropriate aperture) even if the source is very faint and/or undetected in an individual image.
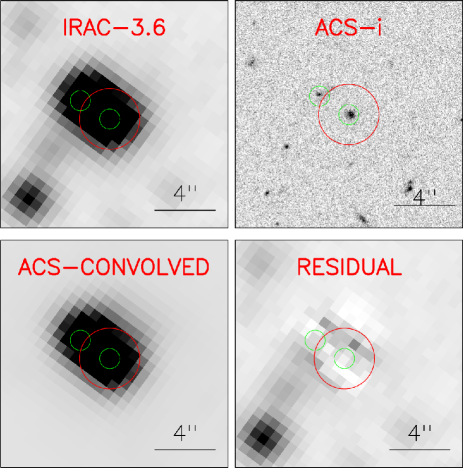
The combination of the remarkable depth and the 2″ FHWM of the IRAC observations inevitably leads to issues of source confusion, specially around crowded environments. However, based on the (ground-based) reference image, it is possible to deblend IRAC sources which have not been separated by SExtractor in the original IRAC images and lie at least 1″ away (half the FWHM, chosen as our resolution criterion). HST images reveal that the multiplicity is larger, but the deconvolution of sources separated by less than 1″ is very uncertain. When multiple counterparts are found in the optical/NIR images during the cross-matching, the IRAC photometry is recomputed following a deconvolution method similar to that used in Grazian et al. (2006), Wuyts et al. (2008), Williams et al. (2009) or Wang et al. (2010).
In our case, first, the coordinates of the photometric aperture are re-positioned to that of the optical/NIR counterparts. Then, the PSF of the higher resolution image is convolved to the IRAC PSF, and the flux of each source is scaled to match that of the real IRAC sources measured in 0.9″ apertures (after re-centering to the positions of the optical counterparts). Finally, total magnitudes are computed applying an aperture correction of [1.300.07,1.020.08,1.20.10,1.440.14] mag in the [3.6,4.5,5.8,8.0] m bands, respectively. Figure 4 illustrates the deconvolution procedure using a HST/ACS image as reference. The red and green apertures depict the standard 2″ aperture (for isolated sources) and the 0.9″ aperture, respectively. Pixel-by-pixel variations in the residual from subtracting the model PSF do not exceed a 5 within the 0.9″ and 2″ apertures. We also checked that the average rms (3) is well within the photometric error of the sources. The analysis of an average PSF, derived from observed sources across the image, indicates that for the typical separation between blended sources, 2.2″ (1.8″ for 75 of them), the flux contamination from the nearby neighbor does not exceed a 10 for sources with a flux ratio around 1:2-3. Approximately 75 of the blended sources present flux ratios lower than 1:3.5.
After applying the deblending method, our IRAC selected catalog contains 76,936 (113,023) sources to [3.6]23.75 (24.75). This means that we were able to deblend 8% of the sources in the original IRAC catalog built with Sextractor (presented in § 3.1), and 16% of the final catalog of 76,936 sources were deblended (typically, each blended sources was a combination of 2 sources).We find no significant difference in the brightness distribution of the blended sources compared to the resolved sources.
In the following sections, and in Paper II, we will analyze the SEDs and physical properties of the IRAC sources, concentrating in the sample with [3.6]23.75 mag, which count with more accurate IRAC photometry (SNR8). Therefore, this will be the working sample for the rest of the paper unless explicitly stated otherwise. Nonetheless, all the procedures discussed in the following are also applied to the sources down to [3.6]24.75 mag. Although these objects are not included in the accompanying catalog (presented in § 6, restricted to the most reliable detections), it is possible to retrieve their data through our online database (see §6.3).
4.2. Merged photometry
The photometry is carried out in the same (Kron) elliptical aperture in all bands. The parameters of that aperture are obtained from a reference image (the same as for the cross-matching procedure) whose resolution is representative of the entire dataset. Normally, this reference image is a ground-based optical/NIR frame with a PSF of approximately 1-1.5″, which is easy to translate to other ground-based images avoiding aperture issues.
The bands are sorted according to depth to facilitate the cross-match to the optical bands. The typical aperture band for the majority of the sources (83% of the sample) is the Subaru -band, followed by the CFHTLS -band (4%), MMT -, (3 each) and MOIRC- (2%). For the remaining 5% of the sources, the aperture is computed from other bands (CFHTLS-r, , V505) that account for less than 1% of the total each. The Subaru imaging was preferred to the CFHTLS as primary aperture band due to the uniform coverage of the whole IRAC mosaic (the CFHTLS frames cover only 60% of the IRAC survey). In order to ensure that the aperture radius is always large enough to enclose the full PSF profile in all ground-based images, we established a minimum aperture radius equal to the worse value of the seeing (1.5″). Once the best photometric aperture is defined, if no counterpart is found in one band but data exist at that position, the flux is measured within the same aperture. Note that the local WCS re-centering of the images allows an accurate positioning of that aperture. In this way we recover fluxes for very faint sources whose detection was missed by SExtractor. When the counter-part source is too faint to be detected, the sky-rms value is stored to be used as an upper limit in the SED analysis.
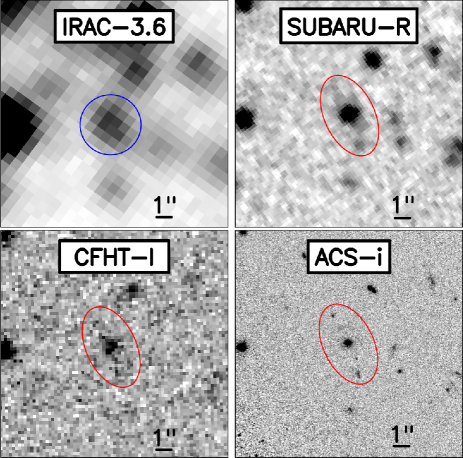
Some bands are deliberately excluded from the merged photometric measurement described above due to a significant difference of the resolution compared with the reference band or because images are not available. For all these bands, the photometry is obtained differently and later incorporated in the merged catalog during the cross-correlation procedure. For the four IRAC channels, the optical/NIR Kron apertures are typically not large enough to enclose the entire PSF. Therefore, we keep the values measured in §3.1 with aperture photometry. Given the comparatively large PSFs of the MIPS (24 , 70 ) and GALEX (FUV, NUV) images, the flux measurement in these bands was carried with IRAF-DAOPHOT and SExtractor, respectively (see PG05 and PG08). Figure 5 illustrates the different resolutions and aperture sizes involved in the photometric measurement (see also the captions in Figure 9,10,11 and 12).
The HST -ACS bands were included in the general photometric procedure. Although the much higher resolution may lead to multiple cross identifications even when compared with the optical ground based images, the high spatial resolution (after the local re-alignment described above) allows a reliable cross-matching within 0.15″ (rms of the local WCS solution for HST images). As shown in Figure 5, apertures were placed correctly even when multiple counterparts are identified, and the photometry includes the fluxes from all them. We have conducted an additional test to check the accuracy of the ACS photometry measured with this method. We compared the observed photometry to synthetic magnitudes derived from SED templates fitted to the multi-band photometry (except ACS) of spectroscopically confirmed galaxies. We find a very small offset ( mag) and a scatter consistent with the typical photometric errors in the bands (see §3.1.3 of Paper II for more details).
The NIR source catalog of the Palomar/WIRC survey (Bundy et al., 2006) is also included in the merged photometric catalog, although no images are available to match apertures. In this case, we use the SExtractor MAG_AUTO value of the closest neighbor in the - and -bands.
4.3. Photometric uncertainties
The uncertainties in the photometry are derived simultaneously to the process of flux measurement in each individual band. As mentioned in §3.1, the photometric errors obtained using SExtractor often underestimate the true background noise due to signal correlation on adjacent pixels (Labbé et al. 2003, Gawiser et al. 2006). In order to properly account for this effect, we estimated the flux uncertainties in three different ways, as described in PG08 (Appendix A). First, we measured the background noise in a circular corona of 5 ″ width around each source. This procedure is similar to that used by SExtractor and provides uncertainties . In addition, we measured the average sky signal on non-connected artificial apertures built with random pixels around each source, with the same size as the photometric aperture, and containing only pure sky pixels (rejecting pixels 5 the rms obtained with the first method). Finally, we also estimated the background noise following the method by Labbé et al. (2003). The flux measured on several photometric apertures around the source, identical to the one employed for the photometry, is fitted to a Gaussian function to yield the rms background fluctuation. The sky background is set to the resulting average value of the three methods, and the final photometric uncertainty is set to the largest estimate, typically, the one measured with the second method.
5. Properties of the merged photometric catalog
The exposure time of the IRAC mosaics in the four channels is remarkably homogeneous across the mosaic. However, the coverage of the strip at other wavelengths is patchy and discontinuous (see Figure 1). For the remaining of this Section and in Paper II, we will differentiate between the region of the IRAC image covered by the CFHTLS, and the rest. The CFHTLS/IRAC common region (52.1653.20∘ & 214.04∘215.74∘) has been also surveyed with Subaru, the CFHT12k instrument, MMT/Megacam, HST /ACS, HST /NICMOS, and GALEX , so it constitutes the zone with the highest data quality (hereafter, main region), where the SEDs are sampled with the highest band coverage. The area of this region is 0.35 deg2 (68% of the total) and contains 53,030 (76,936) sources down to [3.6]23.75 (24.75). The 0.13 deg2 outside the main region (hereafter, flanking regions), also present a solid SED coverage, relying mostly in the MMT and SUBARU bands. Nevertheless, it lacks some of the best quality data (taken with ACS and MOIRCS), and the fraction of surveyed area by the WIRC- bands is 15% lower. There are 23,906 (35,416) sources in the flanking regions with [3.6]23.75 (24.75). Table 2 summarizes the number of sources in the catalog according to different limiting magnitudes and area constraints.
| [3.6]23.75a | [3.6]24.75b | |
|---|---|---|
| Prior to deblending | 70,048 | 99,618 |
| After deblending | 76,936 | 113,023 |
| Mainc/ Flanking regions | 53,030/23,906 | 77,607/35,416 |
Note. —
, 85% completeness level.
, 3 limiting magnitude.
, The main region is defined as: 52.1653.20∘ & 214.04∘215.74∘. The Flanking regions consist of the remaining area.
, Only these sources have been included in the final catalog presented in § 6.
, A larger, although less complete, sample including all the sources down to [3.6]24.75 can be accessed through the web interface Rainbow Navigator (§ 6.3).
Note that the bulk of the optical SED coverage is based on CFHTLS and MMT data (the CFHT12k-BRI data are 2 mag shallower). On average numbers, their respective filter sets cover a similar wavelength range with comparable data quality (see Tables 1 and 4). Also, the subtle differences in the shape of the and band filters of each survey improve the quality of the SED coverage for the sources in the main region. The most remarkable difference between the two surveys is found in the homogeneity of data; whereas the CFHTLS present a nearly uniform data quality across the mosaic, the MMT data show larger variations between the four pointings (e.g., g(5)=26-25 mag, FWHM″ ; see Zhao et al. 2009 for more details). Unfortunately, the lowest quality pointings (shallower data and highest seeing) are precisely those covering the flanking regions (mainly the north region, 53.20∘). Furthermore, a small area in the north and south regions of the MMT mosaic (10% of the total) is not observed in the g and u bands, respectively. Thus, comparatively, the average data quality in the flanking regions is slightly lower than in the main region.
5.1. Multi-band detection and color properties.
Table 4 shows the fraction of the entire IRAC catalog detected in the different bands compiled for this work. We give specific values for different sub-samples divided as a function of brightness in the selection band, detection level (SNR), and location in the IRAC mosaic. The majority of sources are detected in the 4 IRAC channels. However, while most sources (90%) have reliable detections at 3.6 and 4.5 m, only half of the sample is detected with SNR5 at the two longer wavelengths. Note that the photometry at 5.8 and 8.0 m was not performed independently (see §3.1).
The fraction of IRAC sources detected in the optical bands is also elevated (95%) for the majority of the bands. However, cutting the measurements at SNR5, the efficiency decreases to 85% for the deepest CFHTLS, MMT, Subaru and ACS bands, and to 50%-60% for the and bands (in both CFHTLS and MMT data) and the shallower CFHT bands. For the GALEX data, the detection is typically lower than 10% and 25% in the FUV and NUV bands, respectively. Around 12% and 6% of the sources are matched to high quality spectroscopic redshift estimates in the main and flanking regions, respectively. The lower efficiency in the flanking regions is caused by the inhomogeneous DEEP2 coverage of the IRAC mosaic.
The NIR coverage of the strip surveyed by IRAC is also discontinuous. The WIRC catalog provides the most uniform coverage, including 40% and 100% of the area in the main region in the J and K bands, respectively. The fraction of IRAC sources detected in each band is very similar, 50-60% (20% with SNR5). The deepest NIR observations are those taken in CAHA- and Subaru-MOIRCS- bands. The latter covers 1/4 of the main region up to 1 mag deeper than the WIRC- data, presenting a much higher detection fraction, 90% (70% with SNR5). The CAHA- data covers 40% of the main region recovering 30% (SNR5) of the IRAC detections, a slightly larger fraction than WIRC-.
We note that for most bands, the fraction of sources detected with SNR5 can be significantly higher than the overall value. In the shallowest bands, this is caused by the higher photometric uncertainties (e.g., the WIRC J and K bands). However, for most bands this is the result of the enhanced detection achieved with the forced photometric measurement. For each IRAC source undetected in a given image, but having a counterpart in any other band, we still measure the flux in the same aperture at the position of the counterpart. With this method we increase the detection efficiency at fainter magnitudes recovering sources that would be missed otherwise. However, given the extreme faintness of these sources, some of the measurements produce low significance detections (SNR2). As a precaution, to preserve the overall quality of the SED, we do not include these values (photometric uncertainties 0.4 mag) in the SED fitting procedure, nor in the estimate of the physical parameters in Paper II. Nevertheless, we keep these values as they can be useful as upper limits. Another estimate of the limiting magnitude in each band is obtained from the the value of the sky rms in failed forced measurements (i.e., those for which the measured flux in the aperture is negative).
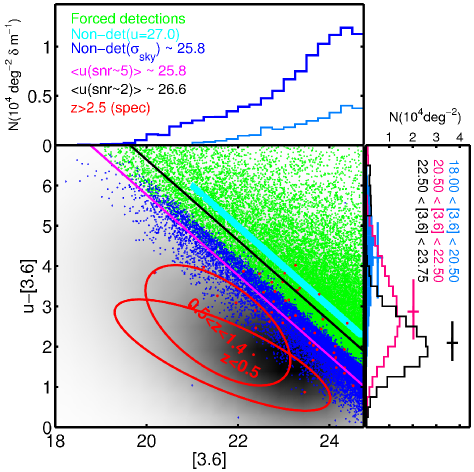
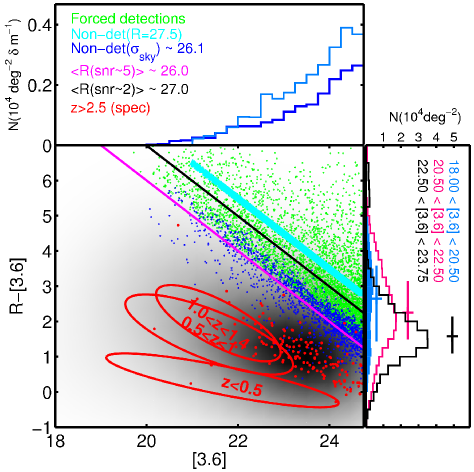
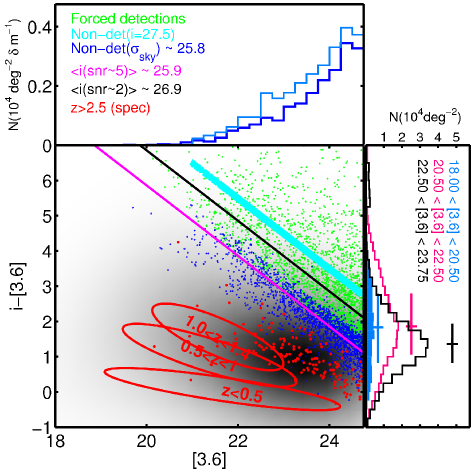
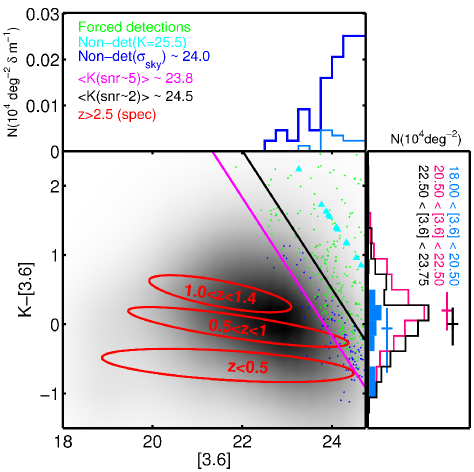
Figure 6 illustrates the characteristics of the different flux measurements in four bands probing representative wavelengths in the UV-to-NIR range. The central panel of each plot shows a color-magnitude diagram in [3.6] vs R and K, respectively. The grey-scale density map depicts the distribution of standard (non-forced) photometric measurements, typically detected with SNR5 (magenta line). Forced detections for which we obtain a valid flux or a sky rms value are shown as green and blue dots, respectively. The cyan markers are sources detected in IRAC only (for which we assign arbitrary magnitudes in each band). For the deep R and bands, which present the highest detection efficiency, forced measurements account for less than 5% of the flux measurements, and present a median SNR2 (black line). In the band, the source density for a similar limiting magnitude is much lower, and consequently the fraction of forced detections is higher, around 20%.
The upper panels in each quadrant of Figure 6 shows the fraction of undetected sources in each band. In the and bands these sources make up for 4% of the total sample. Most of them are IRAC-only sources (plotted in cyan), whereas the rest are at least marginally detected in one other (typically red) band, but the forced measurement fails for the particular band shown in the plot (blue). The fraction of undetected sources in the band (and other shallower optical bands, e.g., CHFT12K-BRI) increases to 10%, being in this case dominated by failed forced measurements at the positions of R or detections. These kind of measurement are also predominant for undetected sources in the -band.
Note that some of the IRAC-only sources are relatively bright, 21[3.6]22. Most of them are detected in deep -band observations. However, there are a few galaxies detected only in the IRAC bands (typically the faintest ones). The nature of these interesting sources, potential candidates to massive high redshift galaxies, will be explored in a future paper.
Figure 6 also shows the color distribution of IRAC sources in bins of [3.6] mag (right panels in each quadrant), and spectroscopically confirmed galaxies in several redshift bins (red ellipses and dots in the central panels). The general trend with color in the R and bands is that faint IRAC sources are on average bluer than brighter ones. The median colors for the faintest [3.6] bin, 22.50[3.6]23.75, are R[3.6]1.6 and [3.6]1.4. These colors are similar to those of galaxies at 1z1.5. This is consistent with the fact that the median redshift for the IRAC-3.6+4.5 m magnitude limited sample ([3.6]23.75) is z1 (See Paper II and PG08). Note also that most of the forced detections in the R-band would qualify as IRAC extremely red objects (by the criteria of Yan et al. 2004, -[3.6]4.0), that targets dusty starbursts or passively evolving galaxies at z1.5.
In general, all galaxies tend to become redder in opticalIRAC colors with increasing redshifts. Indeed, for a typical galaxy SED, the observed optical bands shift into the (fainter) UV whereas the [3.6] mag becomes brighter as it approaches the stellar bump at 1.6 m rest-frame (for z1.2). Therefore, it is not surprising that the [3.6] median color is redder ([3.6]2.1, typical of a z1 galaxy) than the median color involving the bands. Note also that the observed UV progressively shifts into the Lyman break, producing the large fraction of z2.5 (red dots in the top-left quadrant of Figure 6) galaxies that are u-dropouts. Finally, we find that the [3.6] color presents an almost constant value as a function of [3.6] mag for a given redshift range, becoming progressively redder as we move to higher redshifts: [3.6]0 at z0.5 and [3.6]0 at z1. Again, this is consistent with the fact that both and [3.6] transit through the peak of the stellar bump for z1, changing their relative positions (see, e.g., Huang et al. 2004). An interesting consequence of the red [3.6] colors of high-z galaxies is that IRAC-3.6 m observations are equivalent, in terms of source densities, to a -selected sample down to slightly deeper limiting magnitudes.
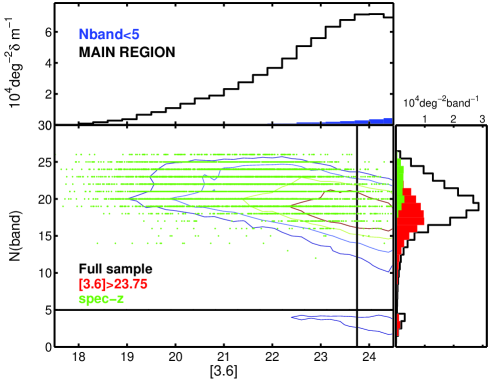
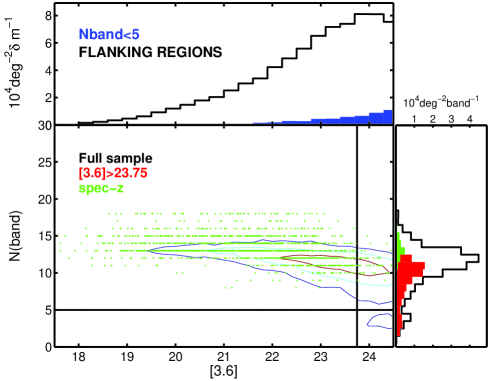
Figure 7 shows the density map (central panel) and histograms (right panel) of the number of photometric bands with measured fluxes, N(band), in the main (left) and flanking regions (right). Typically, the SED of a galaxy in the main region has a median of 19 photometric data points. The average spectral coverage is 8 bands larger than in the flanking regions, mainly due to the lack of data from the CFHTLS and NIR surveys. Galaxies with an available spectroscopic redshift (24 mag; green dots) typically present the highest band coverage (22 and 14 bands in the main and flanking regions, respectively), since they are relatively bright in the optical. Interestingly, the faintest IRAC sources, [3.6]23.75 mag (red histogram), present a relatively high band coverage, N(band)17 in the main region. In most cases, these are low significance detections in the deepest optical/NIR bands where the forced photometric measurement (see § 4.2) is able to recover a flux (see, e.g., Figure 9). On the opposite side, there is a non-negligible number of IRAC-faint but optically-bright sources with more than 19 photometric data points. These constitute a population of blue dwarf galaxies at intermediate redshift easily detected in the optical but with faint IRAC counterparts (i.e., not very massive).
The upper panel of Figure 7 shows the [3.6] magnitude distribution for the full sample (black) and for sources with poor spectral coverage (N(band)5; blue histogram). The latter defines a clearly isolated group in the density contours (central panel) and in the histograms (right panel) of Figure 7. These sources represent less than 3% (4%) of the sample up to [3.6]23.75 (24.75). Most of them are clear IRAC-only detections (as the ones discussed in Figure 6) relatively bright in [3.6,4.5]. However, some of the faintest sources can be affected by contamination of spurious sources (we give more details on these sources in § 5.3).
5.2. FIR, X-Ray and radio counterparts
| Source | Area | Fraction | Total |
|---|---|---|---|
| (1) | (2) | (3) | (4) |
| Chandra/ACIS | 0.67 deg2 | 0.70 | 1023 (77%) |
| MIPS-24 m (f60Jy) | 0.53 deg2 | 0.59 | 10771 |
| MIPS-70 m (f3500Jy) | 0.50 deg2 | 0.61 | 868 |
| VLA 20 cm | 0.73 deg2 | 0.46 | 590 (52%) |
Note. —
Sources drawn from Laird et al. (2009). These include, 815 high reliability identifications (based on a previous match to the IRAC catalog of BAR08) and 176 previously un-identified sources.
The area of the survey refer to the GTO+FIDEL observations that reduced for this paper.
Sources drawn from Ivison et al. (2007).
(1) Name of the band. (2) Total area of the survey. (3) Fraction of the survey area overlapping with the IRAC mosaic. (4) Number of sources with IRAC counterparts ([3.6]23.75) and fraction of recovered sources from the whole catalog.
Table 4 shows the fraction of IRAC sources in our sample ([3.6]23.75) detected in the X-ray, FIR and radio surveys within the overlapping area. About 30% (20% with SNR5 detections) of the IRAC sources are detected at 24 m (SNR5 reached at 60 Jy), 10% (2% with SNR5) at 70 m (SNR5 reached at 3.5 mJy), 1% in the X-rays and 1% at 20 cm. For the radio and X-ray surveys, we cross-matched our sample to the catalogs of Ivison et al. (2007) and Laird et al. (2009), respectively. As explained in § 4, the cross-match to the radio catalog was performed using a 3″ radius, whereas for the X-ray catalog we followed a two step identification. First, we divided the X-ray sample attending to the availability of pre-identified IRAC counterparts (Laird et al. used the IRAC catalog of BAR08 as reference). For the galaxies identified in IRAC, we used a 1″ cross-matching radius, whereas for the other we used a more conservative 2″ radius. With this procedure we found 848 out of the 882 galaxies with IRAC counterparts in their catalog (815 among the 830 with high reliability flag; see Laird et al. 2009 for more details). The remaining galaxies were either outside of the N(frame)20 region or too close to a bright star. In addition, we were able to identify 175 additional X-ray sources in the area of our mosaic not covered by the data of BAR08, i.e., we recover a total of 1023 out of 1325 X-ray sources from the catalog of Laird et al. For the the MIPS-24 m and 70 m and radio surveys, we identify 10758, 868 and 590 (out of 1122) sources, respectively. Noticeably, about 20% and 54% of the sources detected in MIPS-24 m and 70 m present a multiple IRAC counterparts (typically 2-3) and 6% in X-ray and Radio.
All of these surveys cover an area larger than the IRAC observations, but none of them fully cover the IRAC strip (although the X-ray and MIPS-24 m data cover 90% of the area). Table 3 shows the total area covered by the X-ray, MIPS and radio surveys, the fraction that area in common with the IRAC mosaic, and the number of sources with an IRAC counterpart in our catalog. All the sources in the different surveys located within the area covered by IRAC are detected in our catalog (with the exception of a few objects too close to bright stars).
Note that despite the larger area of the VLA observations, this survey covers only 40% of the region surveyed by IRAC. In fact the data are limited only to the upper region of the IRAC mosaic (53.10∘; see Figure 1).
5.3. Catalog reliability
In this Section we analyze in more detail the sources with a poor spectral coverage to asses the reliability of the IRAC catalog as a function of the magnitude in the [3.6] band.
First we test the reliability with the widely-used method of comparing the number of detections at faint levels in the original and a negative image. This test reveals that only 1% of the sources up to [3.6]23.75 mag are spurious.
However, this procedure is conceived to detect faint spurious sources based on the assumption of a symmetric noise, whereas most of the spurious detections are concentrated around bright regions as a consequence of PSF and saturation artifacts and an excessive deblending. Therefore, we chose to follow a different approach to analyze the reliability of the catalog based on the fact that faint [3.6, 4.5] detections lacking a measurable counterpart in other bands are potential candidates for spurious detections.
As discussed in § 5, we find a nearly isolated group of sources detected in N(band)4. Most of these sources are IRAC-only detections (cyan histogram of Figure 6) that, in the absence of low significance optical detections to validate them, could be artifacts of the source extraction procedure.
The visual inspection of galaxies with N(band)4 reveals a clear dichotomy. We find that these sources are either strongly clustered around bright stars and extended sources (typically low-z galaxies), or uniformly distributed across the image. Most of the sources in the first group are easily identified as spurious, whereas for the isolated sources, their high SNR (5-10) and the visual inspection seem to favor that they are real. We dealt with the reliability of sources with N(band)4 by considering spurious all detections in a 20″ -30″ radius region around the brightest objects ([3.6]16-15 mag). Up to [3.6]23.75, approximately half the N(band)4 sources are spurious by this criteria, accounting for less than a 2% of the total sample. Nevertheless, even for the more conservative scenario, the sum of all N(band)4 detections constitutes less than 4% of the sample in the main region. Finally, we also check the reliability of these sources by studying how many of them are simultaneously detected at both 3.6 and 4.5 m. Unfortunately, we find that some real detections are missed at 4.5 m due to the slightly worse image quality, while some of the spurious sources are detected in both images in regions where the density of artifacts is larger (i.e., around bright stars).
Summarizing, we conclude that the overall reliability of the catalog is very high (97%) and that the contamination by spurious sources is strictly restricted to the surrounding areas of very bright sources. For the sake of completeness, we do not remove the sources with N(band)4 from the sample. Instead, we include in the data catalog (Table 6) both the number of bands in which the source was detected (N(band)) and a flag indicating if the source is located in the vicinity of a bright object (see §6.2).
5.4. Star-galaxy separation
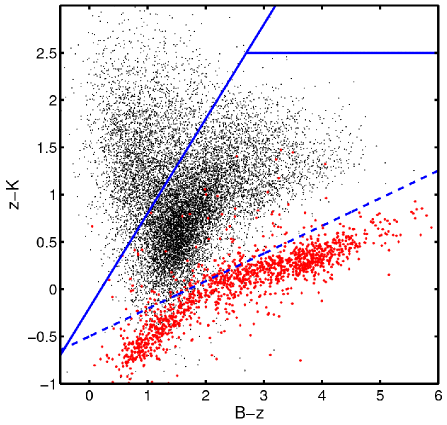
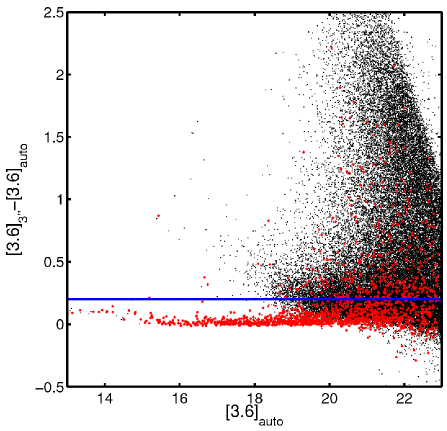
Following PG08, we used eight different photometric and morphological criteria to identify stars in the merged photometric catalog: (1) the average of SExtractor star/galaxy separation parameter (stellarity) for all bands where the source is detected; (2) when available, the stellarity parameter and FWHM of the source in the HST images is also considered as an independent, more reliable, criterion. (3,4) the IRAC-based color-magnitude criteria criteria of Eisenhardt et al. (2004) and Barmby et al. (2004). (5) the concentration parameter (i.e., the difference of the [3.6] mag measured in a 3″ radius aperture and the SExtractor MagAuto), (6) the color-color and (7) color-magnitude criteria of Eisenhardt et al. (2004, this time based on optical and NIR bands). (8) The BzK criteria of Daddi et al. (2004). In spite of using multiple stellarity criteria, the heterogeneous band coverage makes difficult the simultaneous application of the 8 criteria (e.g., the HST data cover only 40% of the full area). For this reason, we chose the bulk of the criteria to be based on IRAC or optical colors, which are available for the majority of the sources independently of the region in which they are located. We verify that at least 5 criteria can be estimated for 86% of the sources with [3.6]23.75.
A source was identified as a star if 3 or more of the stellarity criteria are satisfied. Based on this method, we found 2913 stars. Among them, we are able to identify 69 of the spectroscopically confirmed stars. The rest of them satisfy at least 1 or 2 of the stellarity criteria. Figure 8 illustrates the efficiency of the IRAC morphological criteria by Eisenhardt et al. (2004) and the BzK criteria of Daddi et al. (2004). Red dots indicate sources with N(criteria)3. Clearly, the BzK criterion is more efficient identifying stars over a wider magnitude range. Note that, as discussed in PG08, an IRAC selected catalog down to 23.75 only includes a minor fraction of stars (less than 5% at all magnitudes), the majority of them at bright magnitudes (40 at [3.6]18).At the faintest magnitudes, the overall dimming of the objects could lead us to identify some stars as galaxies due to the lack of applicable criteria. However, we find that both the galactic and stellar number counts in the IRAC bands are in good agreement with those presented in Fazio et al. (2004) down to our limiting magnitude. From the relative distribution of galaxies and stars we also find that the fraction of stars makes up for only 3 of all sources at magnitudes fainter than the the median of the sample ([3.6]=22.4).
6. Data catalogs and database access
The catalog with the multi-band photometry for all the IRAC-3.6+4.5 m selected sample in the EGS is presented in Table 5. Additional information regarding the photometry of the sources and other properties described in the paper are given in Table 6. Furthermore, we also present here a web-based interface to access our database containing all the results presented in this and the companion paper. The web tool is publicly available for the entire astronomical community.
As explained in § 3.2, the catalogs presented in this paper are restricted to the 76,936 sources with [3.6]23.75, the 85 completeness level, which count with accurate IRAC photometry (SNR8). As explained in § 3, our sample is extracted from the area of the IRAC mosaic counting with a frame coverage larger than 20 (4ks in the IRAC-3.6 m band). Nevertheless, a deeper, although less complete, catalog without any magnitude restriction can be accessed through the online database (§6.3). In the following subsections we describe the contents of Tables 5 and 6 and we present Rainbow Navigator.
6.1. Table 5: photometric catalog
These are the fields included in Table 5:
-
•
Object: Unique object identifier starting with irac000001. Objects labeled with an underscore plus a number (e.g, irac000356_1) are those identified as a single source in the IRAC catalog built with Sextractor, but deblended during the photometric measurement carried out with the Rainbow software (see § 4.1). Note that, although the catalog contains 76,936 elements, the identifiers do not follow the sequence irac000001 to irac076185. This is because the catalog is extrated from a larger reference set by imposing coordinate and magnitude constraints. The table is sorted according to this unique identifier.
-
•
: J2000.0 right ascension and declination in degrees.
-
•
zspec: Spectroscopic redshift determination drawn from the DEEP2 spectroscopic survey or the catalog of LBGs of Steidel et al. (2003).
-
•
qflag: Spectroscopic redshift quality flag from 1 to 4. Sources with qflag3 have a redshift reliability larger than 80%.
-
•
FUV, NUV, ,…: Effective wavelengths (in nanometers), magnitudes and uncertainties (in the AB system) for each of the 30 photometric bands compiled for this paper. The band-passes are GALEX FUV and NUV, CFHTLS , MMT , CFHT12k BRI, ACS and , Subaru , NICMOS ,, MOIRCS , WIRC , CAHA- IRAC 3.6-8.0, and MIPS-24 m and 70 m. The bands are sorted according to the effective wavelength of the filter. We refer to section §3 for details on the photometric measurement and error calculation. The magnitudes do not include zero-point corrections (see Paper II, § 3.1.3). A value of the magnitude equal to -99.0 with error equal to 0.0 indicates a not valid photometric measurement. A negative error indicates that the source was undetected by Sextractor but a positive flux was obtained when forcing the measurement at that position using the appropriate aperture (see § 4.2). An error equal to 0.0 indicates that the source was undetected and the forced measurement returned a negative flux. In this case, the value of the magnitude is an upper limit equal to the sky-rms (1) in the photometric aperture (see § 4.2).
6.2. Table 6: photometric properties catalog
These are the fields included in Table 6:
-
•
Object: Unique object identifier (the same as in the photometric catalog in Table 5).
-
•
: J2000.0 right ascension and declination in degrees.
-
•
N(bands,detect): Number of UV-to-NIR in which the source is detected.
-
•
N(bands,forced): Number of UV-to-NIR in which the source is a priori undetected, but the forced photometry is able to recover a valid flux.
-
•
Flag: Quality flag indicating that the source is located in the vicinity of a bright object. Sources detected only in the IRAC bands (N(band)5) and close to a bright ([3.6]16) source are likely to be spurious (see § 5.3). The values of the flag indicate: (5) source within 70″-100″of the brightess saturated stars in the field, (4) source within 30″of a [3.6]15 source, (3) source within 20″of a 15[3.6]16 source, (2) source within 15″of a 16[3.6]17 source, (1) source within 10″of a 17[3.6]18 source. (0) source un-flagged.
- •
-
•
Region: Region of the field in which the source is located (§ 5): A value of 1 or 0 indicates that the source is in the Main or Flanking region, respectively. The Main region is defined as the area of the IRAC mosaic within 52.1653.20 and 214.04, the Flanking regions are those containing the remaining area.
6.3. Rainbow Database Navigator
The photometric catalog presented here and the inferred stellar parameters discussed in Paper II are obtained using the Rainbow software (see PG05, PG08). The program includes different sub-routines for each task, and the output of each step serves as the input for the next. After the data processing, both the input (images, spectra, templates) and the resulting catalogs are stored in a database with individual sources as building blocks. On doing so, we achieve several goals: (1) each object is fully characterized with all the available information; (2) the data can be easily sorted and retrieved according to several criteria; (3) the data are homogeneously stored, which allows a straightforward combination with data from other Rainbow fields and projects (such as those in PG05 or PG08).
In order to provide worldwide access to the data stored in our database, we have developed a publicly available web interface, dubbed Rainbow Navigator888http://rainbowx.fis.ucm.es. Here we briefly describe the main features of the utility. A detailed description of its capabilities can be found at the website.
Rainbow Navigator is essentially a user-friendly web interface to a database containing all the data products resulting from the process of creating and analyzing the IRAC-selected catalog presented in this two papers, from the initial source detection to the estimate of the stellar parameters.
As many other astronomical query interfaces (e.g, NED, SIMBAD), Rainbow Navigator allows to retrieve the information for single sources searching for the source name or by coordinates. It also allows to create subsets of the complete catalog based on multiple constraints over the multi-band photometry, the redshifts or the stellar parameters. In addition, we have incorporated a cross-matching tool that allows to compare catalogs uploaded by the user to the IRAC-selected sample stored in the database, returning the sources in common. Rainbow Navigator also has an on-the-fly utility to create sky maps of a selected area, including point-and-click access to the individual sources.
Furthermore, an interesting feature that we do not include in the public catalog for the sake of simplicity is the possibility of retrieving observed and rest-frame synthetic magnitudes over a predefined grid of 52 different filters covering the whole spectral range from the UV to the radio wavelengths. These values are computed by convolving the best fitting template (see Paper II) for each source with the appropriate filter transmission curve.
Each source of the catalog has its own data sheets that provides all the available information including not only the photometry, the redshifts or the stellar parameters, but also detailed information of the stellarity, synthetic magnitudes, the multiplicity in other bands, jointly with the unique identification and coordinates of the counterparts in each given band. The tool also provides postage stamps of the source in each of the available bands, that can be modified on-the-fly or combined to create simple false color images. Furthermore, each page includes a figure depicting the full SED showing the fit of the optical and IR data jointly with the best fitting templates.
Figures 9-12 show examples of the multi-band postage stamps, the UV-to-FIR SED and fitting templates, and the clickable map utility for a few galaxies at different redshifts. The postage stamps also illustrate the different photometric measurements in each band (aperture matched and circular apertures) and the forced detections for very faint sources (see, e.g., the source in Figure 11).
Rainbow Navigator has been conceived to serve as a permanent repository for future versions of the catalogs containing improvements over the previous results (the present version is data release 1), and also to similar data products in other cosmological fields (such as GOODS-N and GOODS-S, presented in PG08). Currently, it provides public access to the IRAC-selected catalog in the EGS presented in this paper, and also a similar release of the data described in PG08 for a small piece of the central region of the GOODS-S region.
7. Summary
We presented an IRAC-3.6+4.5m selected catalog in the EGS characterized with multi-wavelength photometry. The sample contains 76,936 sources with [3.6]23.75 (85 completeness of the sample) covering an area of 0.48 deg2. The IRAC sources are characterized with FUV NUV BRI [3.6]-[8.0] photometry. In addition, we have cross-correlated the sample with X-ray data (Laird et al., 2009, AEGIS-X), Spitzer/MIPS 24 m and 70 m FIR photometry, and VLA-20cm radio data (AEGIS20; Ivison et al. 2007). Secure spectroscopic redshifts are also included in the catalog for 7,636 sources with [3.6]23.75 obtained from the DEEP2 Survey and Steidel et al. (2003, LBGs at z3). The data described in this paper are publicly available, and will be part of future extended analysis and projects. The main results of this work are summarized below.
-
•
The extraction of the IRAC sample presented in this paper was limited to region with exposure times 4 ks. The average survey depth is 10 ks. Aperture photometry was performed in the 4 IRAC bands simultaneously allowing us to obtain upper limit fluxes for undetected sources in the [5.8] and [8.0] bands. We removed spurious detections masking areas around bright stars. The estimated 85% completeness level for point sources is [3.6,4.5]23.75 and [4.5,5.8]22.25. The 3 limiting magnitude estimated from the sky-rms is [3.6,4.5]24.75 and [4.5,5.8]22.90. We also validated the quality of the photometry by comparing our results with the catalog of Barmby et al. (2008), finding good agreement in both magnitudes ( 0.05 mag) and uncertainties (§ 3.3). Some small systematics were found in this comparison, which can be attributed to the slightly different reduction versions and the limiting depth of the source extractions.
-
•
We described in detail our custom photometric procedure Rainbow, developed to measure photometry in multi-wavelength data in a consistent way. The main steps followed by our photometry software are: (1) re-calibration of the local (5′5′) astrometric solution for each pair of images, improving the accuracy of the cross-identification of sources to a limit below 0.1″ (0.2″) between optical-NIR (IRAC-ground based) images. (2) Deconvolution of blended IRAC sources (16% of the entire catalog) separated by more than 1″ , using the positions of the optical/NIR counterparts as reference. The IRAC photometry of deblended sources is accurate to 0.03-0.10 mag, depending on the flux ratio between neighbors (§ 4.1). (3) Measurement of consistent aperture matched photometry for a wide range of ground and space based observations, with different depths and resolutions (§ 4.2); (4) Obtaining (forced) flux measurements and upper limits for faint, undetected (in a direct analysis of each image) sources (§ 4.2). (5) Computing robust photometric errors that take into account variations in the sky rms and signal correlation (§ 4.3).
-
•
The inhomogeneous multi-wavelength coverage of the region covered by IRAC and the differences in depth of the various datasets justifies the split of the complete sample in two complementary regions. The main region (covering 0.35 deg2), delimited by the footprint of the CFHTLS image, constitutes the region with the highest data quality. Here the SEDs present a median coverage of 19 bands, including high resolution imaging from HST (for 50% of the region) and deep NIR data from Subaru-MOIRCS (for 25% of the region). Nearly 70% of the complete sample presented in this paper is located in the main region. In the flanking regions (0.13 deg2), the optical-to-NIR coverage is still robust, but the median band coverage is reduced to 11 bands, lacking the high resolution HST data and the deepest NIR observations.
-
•
The overall detection efficiency of counterparts for the IRAC sources ([3.6]23.75) in other bands is high: more than 85% of the sources are detected (with SNR5) in the deepest optical data (- or -bands) and 70% in the deepest (MOIRCS) -band images. Our method to perform (forced) photometric measurements for a priory undetected sources allows us to recover 10–20% additional sources in the shallowest images. Despite the large fraction of IRAC sources detected in all other bands, we find that 2% of the sample is detected in IRAC only, some of them at relatively bright magnitudes 21[3.6]22 and with high SNR.
-
•
Around 10% of the sample counts with reliable spectroscopic redshifts. Nearly 20 and 2 of the sources are detected in the MIPS-24 m and MIPS-70 m data, respectively. This allows a detailed analysis of their IR-based SFRs. In addition, we recover 1023 of the X-ray sources in the catalog published by Laird et al. (2009, 77% of their complete catalog) and 590 radio sources from the catalog published by Ivison et al. (2007, 52% of their entire sample).
-
•
We presented the publicly available web-interface, Rainbow Navigator, to the database containing all the data products from this and the companion paper. The interface allows the access to the data using customizable queries on the photometry and derived parameters. Furthermore, it provides additional capabilities to inspect the data, such as the creation of on-the-fly clickable sky maps or the cross-match of the IRAC sample presented here to a user-provided catalog. We have made a significant effort to develop a useful and accessible tool that maximizes the legacy value of our catalogs in the EGS, and the future Rainbow based projects in other relevant fields (e.g., PG08). The online version of the catalog (IRAC-DR1) contains a deeper, although less complete, sample limited to [3.6]25.
-
•
In Paper II, we make use of the very detailed UV-to-FIR SEDs presented here to estimate photometric redshifts, stellar masses and SFRs.
Acknowledgments
We acknowledge support from the Spanish Programa Nacional de Astronomía y Astrofísica under grant AYA2009-10368. PGP-G acknowledges support from the Ramón y Cajal Program financed by the Spanish Government and the European Union. Partially funded by the Spanish MICINN under the Consolider-Ingenio 2010 Program grant CSD2006-00070: First Science with the GTC. Support was also provided by NASA through Contract no. 1255094 issued by JPL/Caltech. This work is based in part on observations made with the Spitzer Space Telescope, which is operated by the Jet Propulsion Laboratory, Caltech under NASA contract 1407. Observations reported here were obtained at the MMT Observatory, a joint facility of the Smithsonian Institution and the University of Arizona. GALEX is a NASA Small Explorer launched in 2003 April. We gratefully acknowledge NASA’s support for construction, operation, and scientific analysis of the GALEX mission. This research has made use of the NASA/IPAC Extragalactic Database (NED) which is operated by the Jet Propulsion Laboratory, California Institute of Technology, under contract with the National Aeronautics and Space Administration. Based in part on data collected at Subaru Telescope and obtained from the SMOKA, which is operated by the Astronomy Data Center, National Astronomical Observatory of Japan.
References
- Barmby et al. (2008) Barmby, P., Huang, J., Ashby, M. L. N., et al. 2008, ApJS, 177, 431
- Barmby et al. (2004) Barmby, P., Huang, J., Fazio, G. G., et al. 2004, ApJS, 154, 97
- Barro et al. (2009) Barro, G., Gallego, J., Pérez-González, P. G., et al. 2009, A&A, 494, 63
- Bertin & Arnouts (1996) Bertin, E. & Arnouts, S. 1996, A&AS, 117, 393
- Bundy et al. (2006) Bundy, K., Ellis, R. S., Conselice, C. J., et al. 2006, ApJ, 651, 120
- Capak et al. (2004) Capak, P., Cowie, L. L., Hu, E. M., et al. 2004, AJ, 127, 180
- Caputi et al. (2007) Caputi, K. I., Lagache, G., Yan, L., et al. 2007, ApJ, 660, 97
- Coil et al. (2004) Coil, A. L., Newman, J. A., Kaiser, N., et al. 2004, ApJ, 617, 765
- Colina & Bohlin (1994) Colina, L. & Bohlin, R. C. 1994, AJ, 108, 1931
- Cristóbal-Hornillos et al. (2003) Cristóbal-Hornillos, D., Balcells, M., Prieto, M., et al. 2003, ApJ, 595, 71
- Daddi et al. (2004) Daddi, E., Cimatti, A., Renzini, A., et al. 2004, ApJ, 617, 746
- Daddi et al. (2007) Daddi, E., Dickinson, M., Morrison, G., et al. 2007, ApJ, 670, 156
- Davis et al. (2003) Davis, M., Faber, S. M., Newman, J., et al. 2003, in Presented at the Society of Photo-Optical Instrumentation Engineers (SPIE) Conference, Vol. 4834, Society of Photo-Optical Instrumentation Engineers (SPIE) Conference Series, ed. P. Guhathakurta, 161–172
- Davis et al. (2007) Davis, M., Guhathakurta, P., Konidaris, N. P., et al. 2007, ApJ, 660, L1
- Eisenhardt et al. (2004) Eisenhardt, P. R., Stern, D., Brodwin, M., et al. 2004, ApJS, 154, 48
- Faber et al. (2003) Faber, S. M., Phillips, A. C., Kibrick, R. I., et al. 2003, in Society of Photo-Optical Instrumentation Engineers (SPIE) Conference Series, Vol. 4841, Society of Photo-Optical Instrumentation Engineers (SPIE) Conference Series, ed. M. Iye & A. F. M. Moorwood, 1657–1669
- Fazio et al. (2004) Fazio, G. G., Ashby, M. L. N., Barmby, P., et al. 2004, ApJS, 154, 39
- Gawiser et al. (2006) Gawiser, E., van Dokkum, P. G., Herrera, D., et al. 2006, ApJS, 162, 1
- Giavalisco et al. (2004) Giavalisco, M., Ferguson, H. C., Koekemoer, A. M., et al. 2004, ApJ, 600, L93
- Grazian et al. (2006) Grazian, A., Fontana, A., de Santis, C., et al. 2006, A&A, 449, 951
- Huang et al. (2004) Huang, J., Barmby, P., Fazio, G. G., et al. 2004, ApJS, 154, 44
- Huang et al. (2009) Huang, J., Faber, S. M., Daddi, E., et al. 2009, ApJ, 700, 183
- Iglesias-Páramo et al. (2007) Iglesias-Páramo, J., Buat, V., Hernández-Fernández, J., et al. 2007, ApJ, 670, 279
- Ilbert et al. (2006) Ilbert, O., Arnouts, S., McCracken, H. J., et al. 2006, A&A, 457, 841
- Ilbert et al. (2009) Ilbert, O., Capak, P., Salvato, M., et al. 2009, ApJ, 690, 1236
- Ivison et al. (2007) Ivison, R. J., Chapman, S. C., Faber, S. M., et al. 2007, ApJ, 660, L77
- Kajisawa et al. (2009) Kajisawa, M., Ichikawa, T., Tanaka, I., et al. 2009, ApJ, 702, 1393
- Kron (1980) Kron, R. G. 1980, ApJS, 43, 305
- Labbé et al. (2003) Labbé, I., Franx, M., Rudnick, G., et al. 2003, AJ, 125, 1107
- Laird et al. (2009) Laird, E. S., Nandra, K., Georgakakis, A., et al. 2009, ApJS, 180, 102
- Le Fèvre et al. (2005) Le Fèvre, O., Vettolani, G., Garilli, B., et al. 2005, A&A, 439, 845
- Lotz et al. (2006) Lotz, J. M., Davis, M., Faber, S. M., et al. 2006, ArXiv Astrophysics e-prints
- Mancini et al. (2009) Mancini, C., Matute, I., Cimatti, A., et al. 2009, A&A, 500, 705
- Martin et al. (2005) Martin, D. C., Fanson, J., Schiminovich, D., et al. 2005, ApJ, 619, L1
- McLeod et al. (2006) McLeod, B., Geary, J., Ordway, M., et al. 2006, in Scientific Detectors for Astronomy 2005, ed. J. E. Beletic, J. W. Beletic, & P. Amico, 337–+
- Miyazaki et al. (2007) Miyazaki, S., Hamana, T., Ellis, R. S., et al. 2007, ApJ, 669, 714
- Muzzin et al. (2009) Muzzin, A., Marchesini, D., van Dokkum, P. G., et al. 2009, ApJ, 701, 1839
- Nandra et al. (2005) Nandra, K., Laird, E. S., Adelberger, K., et al. 2005, MNRAS, 356, 568
- Oke et al. (1995) Oke, J. B., Cohen, J. G., Carr, M., et al. 1995, PASP, 107, 375
- Pérez-González et al. (2005) Pérez-González, P. G., Rieke, G. H., Egami, E., et al. 2005, ApJ, 630, 82
- Pérez-González et al. (2008) Pérez-González, P. G., Rieke, G. H., Villar, V., et al. 2008, ApJ, 675, 234
- Pozzetti et al. (2007) Pozzetti, L., Bolzonella, M., Lamareille, F., et al. 2007, A&A, 474, 443
- Quadri et al. (2007) Quadri, R., Marchesini, D., van Dokkum, P., et al. 2007, AJ, 134, 1103
- Reach et al. (2005) Reach, W. T., Megeath, S. T., Cohen, M., et al. 2005, PASP, 117, 978
- Reddy et al. (2006) Reddy, N. A., Steidel, C. C., Erb, D. K., Shapley, A. E., & Pettini, M. 2006, ApJ, 653, 1004
- Rieke et al. (2004) Rieke, G. H., Young, E. T., Engelbracht, C. W., et al. 2004, ApJS, 154, 25
- Rodighiero et al. (2007) Rodighiero, G., Cimatti, A., Franceschini, A., et al. 2007, A&A, 470, 21
- Rowan-Robinson et al. (2008) Rowan-Robinson, M., Babbedge, T., Oliver, S., et al. 2008, MNRAS, 386, 697
- Salim et al. (2007) Salim, S., Rich, R. M., Charlot, S., et al. 2007, ApJS, 173, 267
- Santini et al. (2009) Santini, P., Fontana, A., Grazian, A., et al. 2009, A&A, 504, 751
- Scoville et al. (2007) Scoville, N., Aussel, H., Brusa, M., et al. 2007, ApJS, 172, 1
- Steidel et al. (2003) Steidel, C. C., Adelberger, K. L., Shapley, A. E., et al. 2003, ApJ, 592, 728
- Steidel et al. (1996) Steidel, C. C., Giavalisco, M., Pettini, M., Dickinson, M., & Adelberger, K. L. 1996, ApJ, 462, L17+
- Villar et al. (2008) Villar, V., Gallego, J., Pérez-González, P. G., et al. 2008, ApJ, 677, 169
- Walcher et al. (2008) Walcher, C. J., Lamareille, F., Vergani, D., et al. 2008, A&A, 491, 713
- Wang et al. (2010) Wang, W., Cowie, L. L., Barger, A. J., Keenan, R. C., & Ting, H. 2010, ApJS, 187, 251
- Williams et al. (1996) Williams, R. E., Blacker, B., Dickinson, M., et al. 1996, AJ, 112, 1335
- Williams et al. (2009) Williams, R. J., Quadri, R. F., Franx, M., van Dokkum, P., & Labbé, I. 2009, ApJ, 691, 1879
- Wolf et al. (2001) Wolf, C., Dye, S., Kleinheinrich, M., et al. 2001, A&A, 377, 442
- Wuyts et al. (2007) Wuyts, S., Labbé, I., Franx, M., et al. 2007, ApJ, 655, 51
- Wuyts et al. (2008) Wuyts, S., Labbé, I., Schreiber, N. M. F., et al. 2008, ApJ, 682, 985
- Yan et al. (2004) Yan, H., Dickinson, M., Eisenhardt, P. R. M., et al. 2004, ApJ, 616, 63
- York et al. (2000) York, D. G., Adelman, J., Anderson, Jr., J. E., et al. 2000, AJ, 120, 1579
- Zhao et al. (2009) Zhao, Y., Huang, J., Ashby, M., Fazio, G., & Miyazaki, S. 2009, Research in Astronomy and Astrophysics, 9, 1061
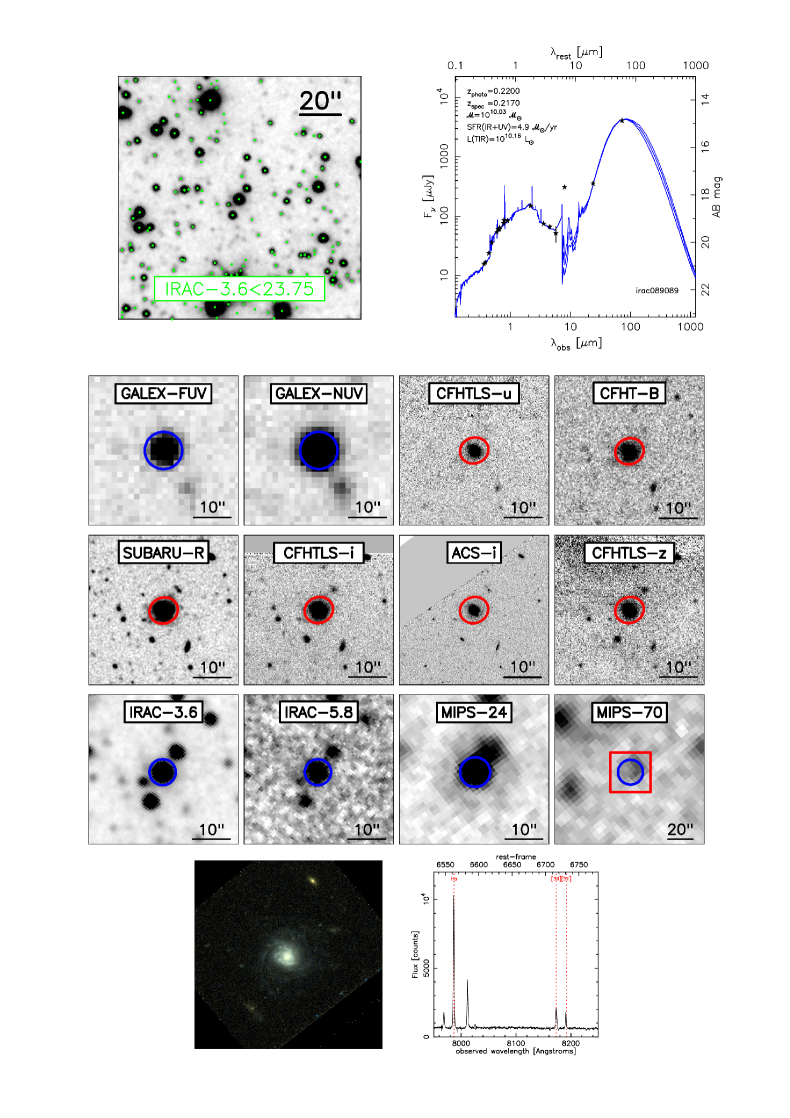
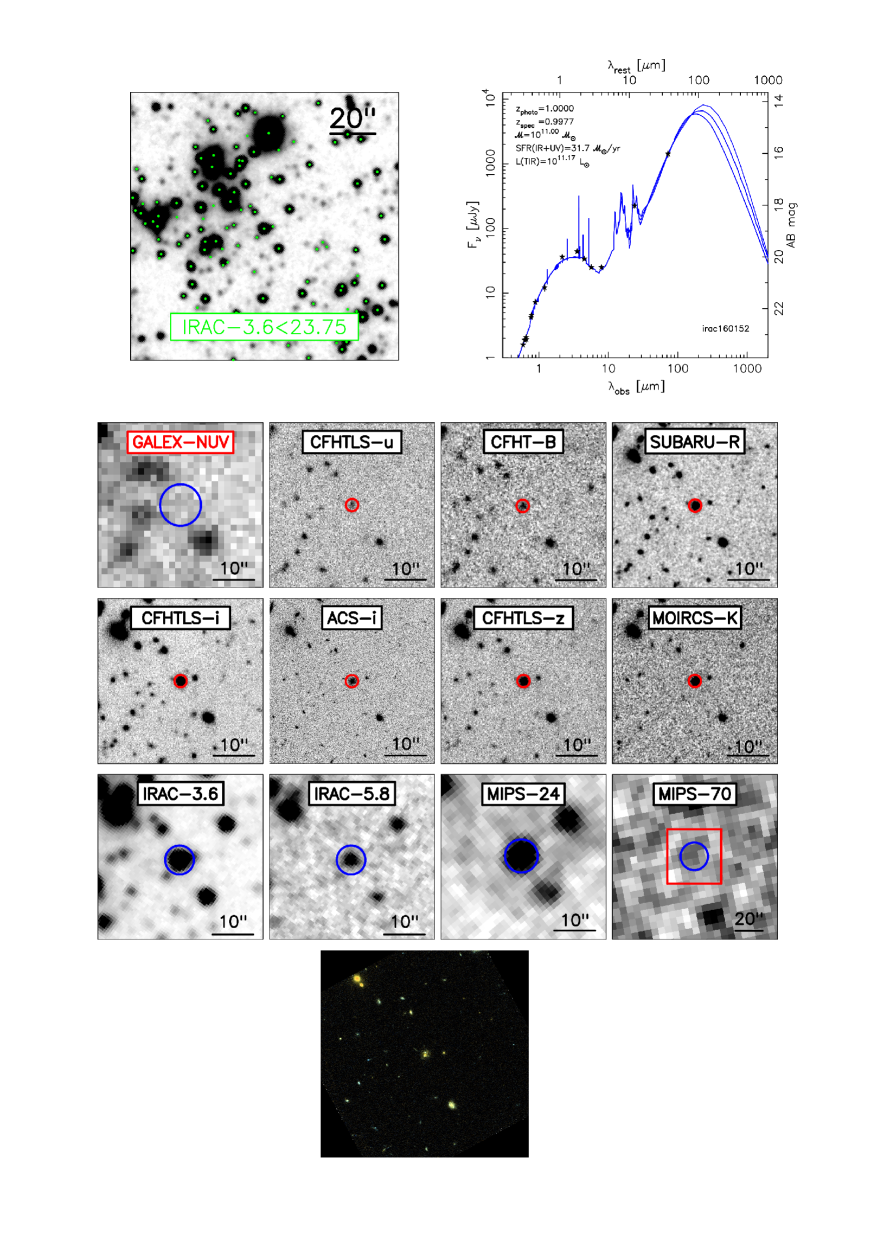
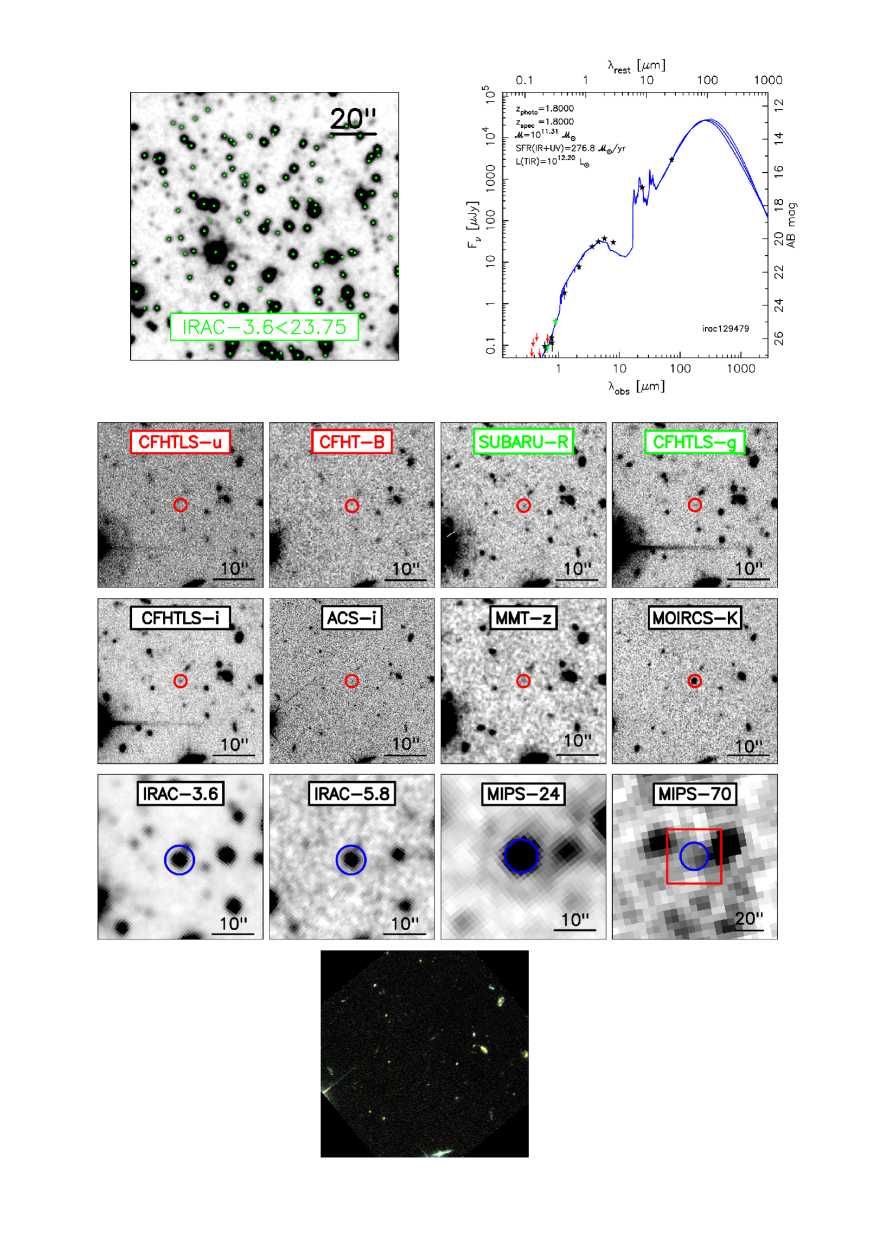
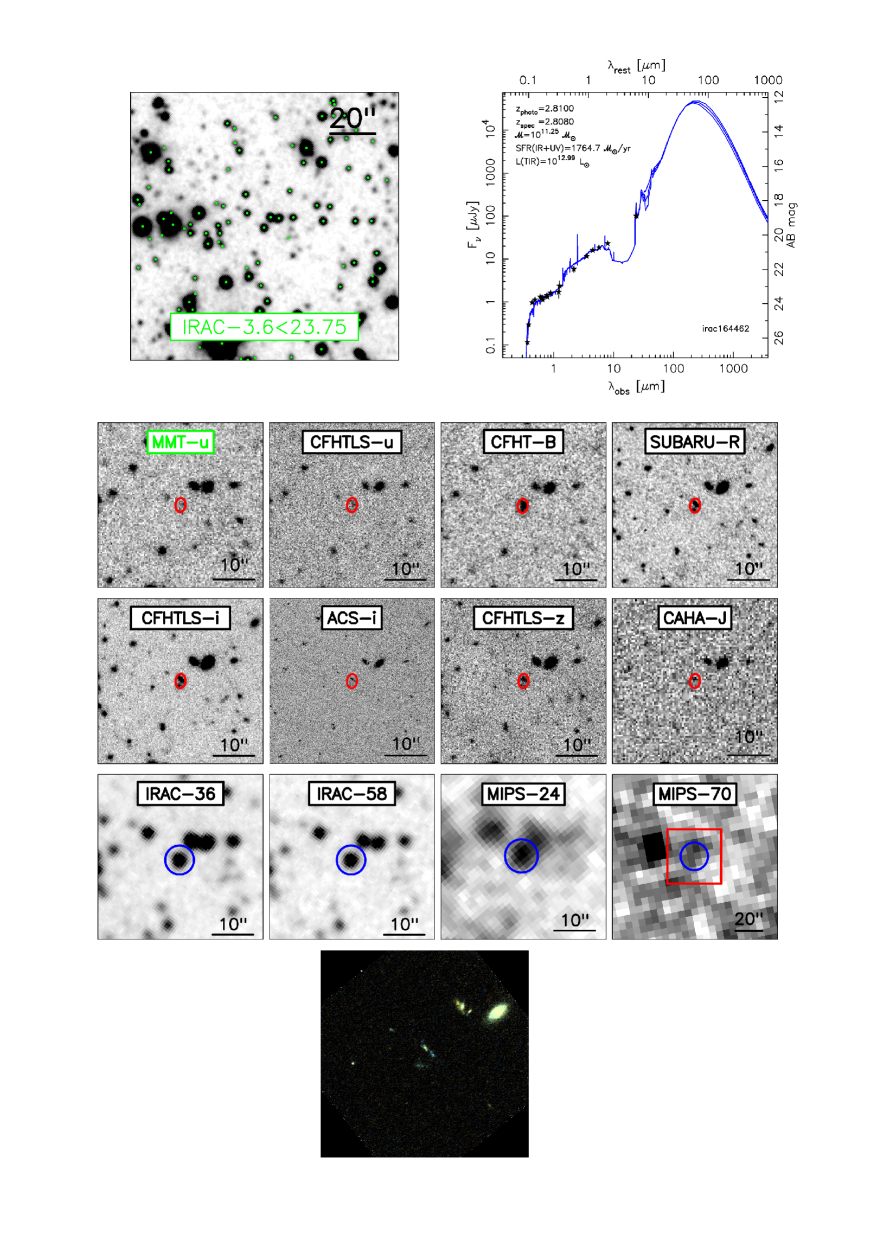
| Band | MAIN REGION (0.35 deg2) | FLANKING REGIONS (0.13 deg2) | |||||||||||||||||||
|---|---|---|---|---|---|---|---|---|---|---|---|---|---|---|---|---|---|---|---|---|---|
| Area | [3.6]23.75 [53,030] | [3.6]24.75 [77,607] | Area | [3.6]23.75 [23,906] | [3.6]24.75 [35,416] | ||||||||||||||||
| stats | ALL/SNR5(%) | stats | ALL/SNR5(%) | stats | ALL/SNR5(%) | stats | ALL/SNR5(%) | ||||||||||||||
| (1) | (2) | (3) | (4) | (5) | (6) | (7) | (8) | (9) | (10) | (11) | (12) | ||||||||||
| X-ray† | 0.31,1.24 nm | 0.97 | … | 717 (1.3%) | … | 718 (1.3%) | 0.93 | … | 307 (1.2%) | … | 307 (1.2%) | ||||||||||
| FUV | 0.154 | 0.99 | 27.90 | 58.8/7.9 | 28.03 | 57.4/6.1 | 0.15 | 27.71 | 59.6/7.7 | 27.83 | 58.3/6.8 | ||||||||||
| NUV | 0.232 | 0.99 | 26.28 | 74.2/25.8 | 26.60 | 70.8/20.2 | 0.15 | 26.26 | 75.2/26.7 | 26.57 | 72.5/23.7 | ||||||||||
| 0.363 | 1.00 | 25.53 | 88.4/52.8 | 25.85 | 86.1/44.1 | 1.00 | 25.39 | 89.6/64.3 | 25.69 | 88.0/57.8 | |||||||||||
| 0.381 | 1.00 | 25.30 | 88.2/53.9 | 25.60 | 85.2/44.2 | … | … | … | … | … | |||||||||||
| CFH-B | 0.440 | 1.00 | 25.03 | 89.6/55.2 | 25.33 | 87.1/45.6 | 1.00 | 24.94 | 87.3/53.1 | 25.27 | 83.7/43.0 | ||||||||||
| g | 0.481 | 1.00 | 25.08 | 96.1/85.1 | 25.44 | 95.0/80.3 | 1.00 | 25.12 | 96.6/84.9 | 25.49 | 95.5/80.5 | ||||||||||
| 0.486 | 1.00 | 24.86 | 95.4/83.6 | 25.20 | 94.0/78.2 | … | … | … | … | … | |||||||||||
| 0.592 | 0.56 | 24.58 | 94.7/83.5 | 24.92 | 93.9/78.7 | … | … | … | … | … | |||||||||||
| 0.626 | 1.00 | 24.50 | 97.1/89.3 | 24.85 | 96.0/84.2 | … | … | … | … | … | |||||||||||
| R | 0.652 | 1.00 | 24.44 | 97.0/88.5 | 24.80 | 95.8/82.5 | 1.00 | 24.36 | 97.4/87.7 | 24.74 | 96.5/81.9 | ||||||||||
| CFH-R | 0.660 | 1.00 | 24.49 | 95.3/71.5 | 24.85 | 93.1/60.2 | 1.00 | 24.36 | 91.6/73.7 | 24.76 | 88.4/63.0 | ||||||||||
| 0.769 | 1.00 | 24.00 | 95.3/85.4 | 24.41 | 94.2/78.3 | … | … | … | … | … | |||||||||||
| i | 0.782 | 1.00 | 24.09 | 97.4/90.3 | 24.51 | 96.1/83.8 | 1.00 | 24.13 | 96.4/81.1 | 24.54 | 94.6/70.2 | ||||||||||
| 0.807 | 0.56 | 24.12 | 96.7/80.7 | 24.52 | 94.7/69.3 | … | … | … | … | … | |||||||||||
| CFH-I | 0.813 | 1.00 | 24.03 | 94.1/68.6 | 24.45 | 90.1/54.5 | 1.00 | 23.97 | 89.2/61.1 | 24.43 | 84.1/47.5 | ||||||||||
| 0.887 | 1.00 | 23.79 | 93.3/66.2 | 24.23 | 89.1/51.2 | … | … | … | … | … | |||||||||||
| z | 0.907 | 1.00 | 23.96 | 96.0/77.7 | 24.44 | 92.7/64.9 | 1.00 | 23.95 | 97.5/85.5 | 24.44 | 95.3/75.4 | ||||||||||
| 1.10 | 0.04 | 23.87 | 84.6/65.4 | 24.25 | 88.9/55.6 | … | … | … | … | … | |||||||||||
| - | 1.21 | 0.40 | 23.29 | 93.7/38.5 | 23.74 | 88.4/27.1 | … | … | … | … | … | ||||||||||
| WIRC- | 1.24 | 0.42 | 22.43 | 62.8/16.6 | 22.49 | 46.1/11.7 | 0.32 | 22.31 | 57.9/20.4 | 22.35 | 41.1/14.1 | ||||||||||
| 1.59 | 0.04 | 24.71 | 92.3/80.8 | 25.18 | 91.7/69.4 | … | … | … | … | … | |||||||||||
| 2.11 | 0.46 | 22.43 | 75.8/6.7 | 22.74 | 67.0/4.6 | 0.26 | 22.17 | 67.3/7.3 | 22.39 | 59.6/5.0 | |||||||||||
| 2.15 | 0.26 | 24.64 | 95.5/73.8 | 25.14 | 89.8/52.9 | … | … | … | … | … | |||||||||||
| WIRC- | 2.17 | 0.97 | 21.76 | 62.6/27.1 | 21.82 | 42.6/16.3 | 0.80 | 21.42 | 45.3/18.4 | 21.45 | 42.4/14.4 | ||||||||||
| IRAC-36 | 3.56 | 1.00 | 22.54 | 100.0/99.2 | 23.18 | 100.0/84.5 | 1.00 | 22.52 | 100.0/97.8 | 23.17 | 100.0/80.6 | ||||||||||
| IRAC-45 | 4.51 | 1.00 | 22.62 | 99.8/95.3 | 23.26 | 98.9/75.3 | 1.00 | 22.63 | 99.3/91.1 | 23.27 | 97.1/70.5 | ||||||||||
| IRAC-58 | 5.69 | 1.00 | 22.50 | 89.7/41.1 | 22.89 | 78.4/28.0 | 1.00 | 22.45 | 87.1/38.6 | 22.80 | 75.5/26.4 | ||||||||||
| IRAC-80 | 7.96 | 1.00 | 22.62 | 85.8/34.4 | 22.97 | 73.8/23.5 | 1.00 | 22.51 | 82.6/32.9 | 22.83 | 71.1/22.6 | ||||||||||
| MIPS-24 | 23.84 | 0.91 | 19.58 | 31.5/20.2 | 19.71 | 29.7/18.1 | 0.93 | 19.36 | 29.9/19.1 | 19.49 | 25.2/15.1 | ||||||||||
| MIPS-70 | 72.49 | 0.80 | 15.79 | 13.1/1.5 | 15.81 | 7.5/5.7 | 0.86 | 15.57 | 13.6/1.2 | 15.57 | 6.7/4.7 | ||||||||||
| VLA† | 2E06 | 0.74 | … | 380 (1%) | … | 380 (1%) | 0.42 | … | 210 (1%) | … | 210(1%) | ||||||||||
| [3.6]23.75 [53,030] | [3.6]24.75 [77,607] | [3.6]23.75 [23,906] | [3.6]24.75 [35,416] | ||||||||||||||||||
| Redshifts† | 0.64-0.91 | 0.94 | 6191 | 12.0% | 6420 | 8.4% | 0.84 | 1445 | 6.0% | 1481 | 4.2% | ||||||||||
Note. — Detection efficiency for the sources IRAC-3.6+4.5m sample in the different bands compiled for this work. The analysis is divided in 2 zones: the main region, defined as the overlapping area between the IRAC and the CFHTLS mosaics (52.1653.20∘ and 214.04∘), and the flanking regions.
For these catalogs, we quote only the number of sources detected in IRAC, and the percentage of total IRAC sample that they represent.
(1) Band name.
(2) Effective wavelength of the bands in microns.
(3) Fraction of the main region covered by the observations in each band.
(4,6) Median and quartiles of the magnitude distribution in each band for main region sources with [3.6]23.75 and [3.6]24.75, respectively.
(5,7) Percentage of IRAC sources in the main region detected in each band at any magnitude (ALL) and with SNR5. These values are computed in areas fully covered by both the IRAC mosaic and the observations in each band.
(8) Same as (3) in the Flanking regions.
(9,11) Same as (4,6) in the Flanking regions.
(10,12) Same as (5,7) in the Flanking regions.
| Object | zspec | qflag | FUV | NUV | B | R | CFH-R | I | |||||||||||
|---|---|---|---|---|---|---|---|---|---|---|---|---|---|---|---|---|---|---|---|
| (mag) | (mag) | (mag) | (mag) | (mag) | (mag) | (mag) | (mag) | (mag) | (mag) | (mag) | (mag) | (mag) | (mag) | (mag) | |||||
| (err) | (err) | (err) | (err) | (err) | (err) | (err) | (err) | (err) | (err) | (err) | (err) | (err) | (err) | (err) | |||||
| J110 | H160 | - | WIRC- | - | WIRC- | [3.6] | [4.5] | [5.8] | [8.0] | [24] | [70] | ||||||||
| (mag) | (mag) | (mag) | (mag) | (mag) | (mag) | (mag) | (mag) | (mag) | (mag) | (mag) | (mag) | (mag) | (mag) | (mag) | |||||
| (err) | (err) | (err) | (err) | (err) | (err) | (err) | (err) | (err) | (err) | (err) | (err) | (err) | (err) | (err) | |||||
| (1) | (2) | (3) | (4) | (5) | (6) | (7) | (8) | (9) | (10) | (11) | (12) | (13) | (14) | (15) | (16) | (17) | (18) | (19) | (20) |
| (21) | (22) | (23) | (24) | (25) | (26) | (27) | (28) | (29) | (30) | (31) | (32) | (33) | (34) | (35) | |||||
| (36) | (37) | (38) | (39) | (40) | (41) | (42) | (43) | (44) | (45) | (46) | (47) | (48) | (49) | (50) | |||||
| irac003270_1 | 215.43892696 | 53.08455063 | 0.00000 | 2 | 153.9 | 231.6 | 362.6 | 381.1 | 439.0 | 481.4 | 486.3 | 592.4 | 625.8 | 651.8 | 660.0 | 769.0 | 781.5 | 807.3 | 813.3 |
| 26.370 | 25.785 | 24.068 | 24.028 | 23.629 | 23.959 | 23.712 | -99.000 | 23.423 | 23.404 | 23.401 | 22.905 | 22.862 | -99.000 | 22.824 | |||||
| 0.000 | -0.127 | 0.079 | 0.033 | 0.051 | 0.039 | 0.018 | 0.000 | 0.017 | 0.036 | 0.040 | 0.018 | 0.040 | 0.000 | 0.034 | |||||
| 887.1 | 907.0 | 1103.3 | 1593.2 | 1209.4 | 1235.5 | 2114.6 | 2145.3 | 2161.3 | 3561.2 | 4509.6 | 5689.4 | 7957.6 | 23844.0 | 72493.7 | |||||
| 22.467 | 22.718 | -99.000 | -99.000 | -99.000 | -99.000 | -99.000 | -99.000 | 22.197 | 21.593 | 21.853 | 22.810 | 22.378 | 19.545 | -99.000 | |||||
| 0.028 | 0.045 | 0.000 | 0.000 | 0.000 | 0.000 | 0.000 | 0.000 | 0.380 | 0.051 | 0.044 | 0.263 | 0.189 | 0.238 | 0.000 | |||||
| irac003278 | 215.42614011 | 53.09447161 | 0.00000 | 0 | 153.9 | 231.6 | 362.6 | 381.1 | 439.0 | 481.4 | 486.3 | 592.4 | 625.8 | 651.8 | 660.0 | 769.0 | 781.5 | 807.3 | 813.3 |
| 27.016 | 25.598 | 23.354 | 22.688 | 21.342 | 20.683 | 20.461 | -99.000 | 19.216 | 19.434 | 18.969 | 18.041 | 17.870 | -99.000 | 17.928 | |||||
| -0.633 | -0.295 | 0.071 | 0.015 | 0.041 | 0.029 | 0.010 | 0.000 | 0.011 | 0.019 | 0.030 | 0.010 | 0.029 | 0.000 | 0.029 | |||||
| 887.1 | 907.0 | 1103.3 | 1593.2 | 1209.4 | 1235.5 | 2114.6 | 2145.3 | 2161.3 | 3561.2 | 4509.6 | 5689.4 | 7957.6 | 23844.0 | 72493.7 | |||||
| 17.583 | 17.661 | -99.000 | -99.000 | -99.000 | -99.000 | -99.000 | -99.000 | 17.303 | 18.011 | 18.417 | 18.841 | 19.341 | -99.000 | -99.000 | |||||
| 0.010 | 0.029 | 0.000 | 0.000 | 0.000 | 0.000 | 0.000 | 0.000 | 0.010 | 0.038 | 0.036 | 0.033 | 0.046 | 0.000 | 0.000 | |||||
| irac003291_1 | 215.44043562 | 53.08128671 | 0.85700 | 4 | 153.9 | 231.6 | 362.6 | 381.1 | 439.0 | 481.4 | 486.3 | 592.4 | 625.8 | 651.8 | 660.0 | 769.0 | 781.5 | 807.3 | 813.3 |
| 29.948 | 27.232 | 25.312 | 25.157 | 24.623 | 24.680 | 24.423 | -99.000 | 23.579 | 23.457 | 23.350 | 22.529 | 22.463 | -99.000 | 22.390 | |||||
| -4.101 | -0.624 | 0.196 | 0.092 | 0.114 | 0.055 | 0.031 | 0.000 | 0.021 | 0.034 | 0.036 | 0.014 | 0.036 | 0.000 | 0.032 | |||||
| 887.1 | 907.0 | 1103.3 | 1593.2 | 1209.4 | 1235.5 | 2114.6 | 2145.3 | 2161.3 | 3561.2 | 4509.6 | 5689.4 | 7957.6 | 23844.0 | 72493.7 | |||||
| 22.130 | 22.295 | -99.000 | -99.000 | -99.000 | -99.000 | -99.000 | -99.000 | 20.449 | 20.391 | 20.721 | 21.007 | 21.247 | 18.860 | -99.000 | |||||
| 0.021 | 0.041 | 0.000 | 0.000 | 0.000 | 0.000 | 0.000 | 0.000 | 0.106 | 0.050 | 0.054 | 0.054 | 0.067 | 0.118 | 0.000 | |||||
| irac003310 | 215.42129738 | 53.09430607 | 0.00000 | 0 | 153.9 | 231.6 | 362.6 | 381.1 | 439.0 | 481.4 | 486.3 | 592.4 | 625.8 | 651.8 | 660.0 | 769.0 | 781.5 | 807.3 | 813.3 |
| 22.626 | 22.577 | 21.787 | 21.681 | 21.104 | 20.817 | 20.706 | -99.000 | 20.323 | 20.344 | 20.301 | 20.033 | 19.985 | -99.000 | 19.978 | |||||
| 0.026 | -0.017 | 0.053 | 0.012 | 0.041 | 0.029 | 0.010 | 0.000 | 0.014 | 0.020 | 0.030 | 0.013 | 0.029 | 0.000 | 0.030 | |||||
| 887.1 | 907.0 | 1103.3 | 1593.2 | 1209.4 | 1235.5 | 2114.6 | 2145.3 | 2161.3 | 3561.2 | 4509.6 | 5689.4 | 7957.6 | 23844.0 | 72493.7 | |||||
| 19.983 | 20.085 | -99.000 | -99.000 | -99.000 | -99.000 | -99.000 | -99.000 | 19.779 | 20.339 | 20.757 | 21.294 | 19.695 | 19.436 | -99.000 | |||||
| 0.013 | 0.030 | 0.000 | 0.000 | 0.000 | 0.000 | 0.000 | 0.000 | 0.063 | 0.039 | 0.039 | 0.102 | 0.045 | 0.165 | 0.000 | |||||
| irac003313 | 215.43553774 | 53.08200958 | 0.00000 | 0 | 153.9 | 231.6 | 362.6 | 381.1 | 439.0 | 481.4 | 486.3 | 592.4 | 625.8 | 651.8 | 660.0 | 769.0 | 781.5 | 807.3 | 813.3 |
| 25.415 | 25.293 | 24.750 | 24.473 | 24.155 | 24.501 | 24.269 | -99.000 | 24.029 | 23.998 | 24.069 | 23.517 | 23.433 | -99.000 | 23.539 | |||||
| 0.000 | -0.147 | 0.131 | 0.067 | 0.082 | 0.044 | 0.024 | 0.000 | 0.035 | 0.056 | 0.072 | 0.023 | 0.048 | 0.000 | 0.067 | |||||
| 887.1 | 907.0 | 1103.3 | 1593.2 | 1209.4 | 1235.5 | 2114.6 | 2145.3 | 2161.3 | 3561.2 | 4509.6 | 5689.4 | 7957.6 | 23844.0 | 72493.7 | |||||
| 23.198 | 23.437 | -99.000 | -99.000 | -99.000 | -99.000 | -99.000 | -99.000 | -99.000 | 21.783 | 21.891 | 22.385 | 22.479 | -99.000 | 16.266 | |||||
| 0.043 | 0.054 | 0.000 | 0.000 | 0.000 | 0.000 | 0.000 | 0.000 | 0.000 | 0.048 | 0.057 | 0.403 | 0.383 | 0.000 | 1.282 |
Note. — (1) Object unique identifier in the catalog. The catalog is sorted by this field.
(2,3) Right Ascension and Declination (J2000) in degrees.
(4) Spectroscopic redshift determination drawn from (Davis et al. 2007; 8,000 galaxies) and (Steidel et al. 2003; LBGs at z3).
(5) Quality flag of the spectroscopic redshift (4=99.5%, 3=90%, 2=uncertain, 1=bad quality). Only redshifts with qflag2 have been used in the analysis.
(6-50) Effective wavelength of the FUV NUV BRI [3.6]-[8.0] [24] [70] bands in nanometer. Observed magnitude with the associated uncertainty as measured in the apertured matched procedure (see § 4). All magnitudes refer to the AB photometric system.
Negative values of the photometric uncertainty are for forced photometric detections. Magnitudes 0 with uncertainty equal to 0.00 are non-detections; for these bands the photometry indicates the magnitude of (see § 4.2). (This table is available in its entirety in a machine-readable in the online version. A portion is shown here for guidance.)
| Object | N(bands,detect) | N(bands,forced) | Flag | Stellarity | Region | ||
|---|---|---|---|---|---|---|---|
| (1) | (2) | (3) | (4) | (5) | (6) | (7) | (8) |
| irac003270_1 | 215.43910540 | 53.08468920 | 18 | 1 | 0 | 0 | 1 |
| irac003278 | 215.42614011 | 53.09447161 | 18 | 2 | 0 | 7 | 1 |
| irac003291_1 | 215.44058360 | 53.08123980 | 18 | 2 | 0 | 0 | 1 |
| irac003310 | 215.42129738 | 53.09430607 | 19 | 1 | 1 | 0 | 1 |
| irac003313 | 215.43553774 | 53.08200958 | 17 | 1 | 0 | 1 | 1 |
Note. — (1) Object unique identifier in the catalog. The catalog is sorted by this field.
(2,3) Right Ascension and Declination (J2000) in degrees.
(4) Number of optical-to-NIR bands (with effective wavelengths below 8.0m) in which the object is detected.
(5) Number of optical-to-NIR bands (with effective wavelengths below 8.0m) in which the object is a priori un-detected, but the forced photometry (see § 4.2) recovers a valid flux.
(6) Quality flag indicating the proximity of a very bright source in the vecinity of the source. Sources detected in very few bands (N(band)5) and located nearby a bright source are likely to be spurious detections (see § 3.2).
(7) Sum of all the stellarity criteria satisfied (see § 5.4). A source is classified as star for Stellarity2.
(8) Region of the field in which the source is located: 1 for the Main region, 0 for the Flanking regions.
(This table is available in its entirety in a machine-readable in the online version. A portion is shown here for guidance.)