119–126
Chemical signature of gas-rich disc-disc mergers at high redshift
Abstract
We performed numerical simulations of mergers between gas-rich disc galaxies, which result in the formation of late-type galaxies. Stars formed during the merger end up in a thick disc that is partially supported by velocity dispersion and has high ratios at all metallicities. Stars formed later end up in a thin, rotationally supported disc which has lower ratios. While the structural and kinematical properties of the merger remnants depend strongly upon the orbital parameters of the mergers, we find a clear chemical signature of gas-rich mergers.
keywords:
galaxies: evolution, galaxies: formation, galaxies: interactions, galaxies: structure1 Introduction
Mergers of late-type galaxies have long been associated with the formation of early-type galaxies ([Toomre(1977), Toomre 1977]). However, numerical simulations of major collisions between disc galaxies (e.g. [Naab & Burkert(2003), Naab & Burkert 2003]), which lead to the formation of ellipticals, have assumed a low ratio gas/stars representative of low-redshift galaxies. Going back in time, we expect to find fewer and fewer stars, and therefore a more important gaseous component. We have simulated mergers of gas-rich disc galaxies, with different mass ratios and orbital parameters ([Brook et al.(2007), Brook et al. 2007]; [Richard et al.(2010), Richard et al. 2010]). Our main goal is to find out if there is a clear observational signature of gas-rich disc-disc mergers.
| Run | mass ratio | |||||
|---|---|---|---|---|---|---|
| M12 | 2:1 | 30.0 | 0 | 0, 0, 15 | 0.94 | |
| M12orb | 2:1 | 30.0 | 0 | 0, 50, 15 | 0.67 | |
| M12z | 2:1 | 30.0 | 100 | 0, 0, 15 | 0.83 | |
| M1290 | 2:1 | 90.0 | 0 | 0, 0, 15 | 0.96 | |
| rM12 | 2:1 | 210.0 | 0 | 0, 0, 15 | 0.91 | |
| M11 | 1:1 | 30.0 | 0 | 0, 0, 15 | 0.88 | |
| M13 | 3:1 | 30.0 | 0 | 0, 0, 15 | 0.92 | |
| M110 | 10:1 | 30.0 | 0 | 0, 0, 15 | 0.85 |
2 The Numerical Simulations

All simulations were performed using the chemo-dynamical algorithm GCD+ ([Kawata & Gibson(2003a), Kawata & Gibson(2003b), Kawata & Gibson 2003a, 2003b]). The initial conditions consist of two galaxies with exponential gas discs embedded in dark matter halos. The most massive galaxy (Gal1) has total mass of (except for simulation M11). The mass of the second galaxy (Gal2) depends on the mass ratio chosen for the simulation. Fig. 1 shows the initial configuration of the system. Gal1 is at rest at . Gal2 is located at , with velocity (except for simulations M12orb and M12z). The baryon/DM mass fraction is 17%. Table 1 lists the parameters used for each simulation. The last column lists the gas fraction at the beginning of the simulation. In each case, the collision leaves a very chaotic system, which then relaxes to a “quiescent state” where the final structure is well-established, and the star formation rate has dropped significantly.
3 Results
We have computed the star formation rate for all simulations (Fig. 2). In all cases, a major starburst invariably occurs during the merger. After the starburst, the star formation steadily drops, as the system relaxes and a disc forms. We define two stellar populations: old stars, which are formed before and during the starburst, and young stars, which include all stars formed after the merger, when the starburst is completed.

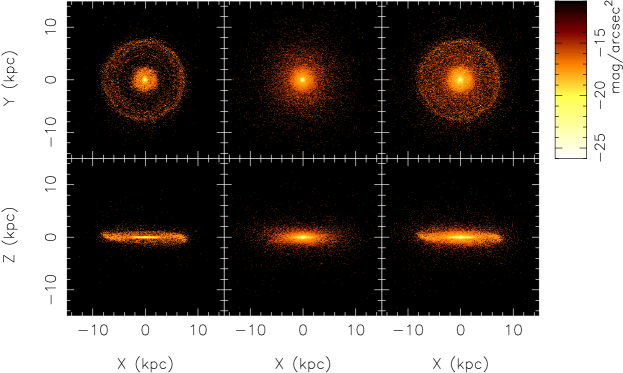
Fig. 3 show the luminosity maps of the final remnant for simulation M12. The left panels show young stars, the middle panels show old stars, and the right panels show all stars. Young and old stars form discs that have comparable radii, but the edge-on views (bottom panels) clearly shows that the young disc is thin, while the old disc is thick. Most simulations result in the formation of a thin disc made of young stars, and a thick disc made of old stars. except simulations M12z and M11 which show more elliptical-like remnants. In several cases, the merger resulted in the formation of a ring made of young stars. Simulations M1290 and rM12 form a central bar made of both old and young stars. From this analysis, we conclude that the structural properties of the remnants are strongly dependent of the initial conditions.
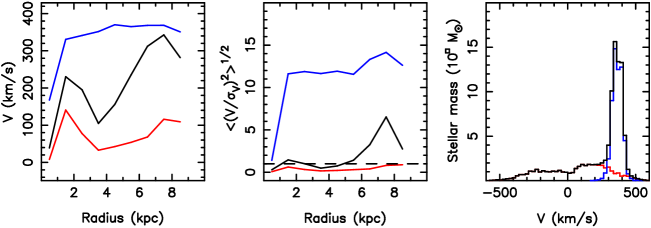
Fig. 4 shows the kinematical properties for simulation M12. We calculated for each population the average rotational velocity and its dispersion in radial bins. The left panel shows the rotation curves. In all cases, the old stars have a lower mean rotational velocity than the young stars. The middle panel shows versus radius. In all cases, we find for young stars, indicating the presence of a massive, rotationally supported disc. Most cases have , for old stars, indicating the presence of a “hot disc” supported by internal motions, but simulations M1290, rM12, and M110 all have , indicating that the old stars are also rotationally supported. The right panel shows histograms of the stellar mass versus rotation velocity. In most cases, the young stars are concentrated in a narrow region of the histogram, while the old stars are spread in velocity. The young component is counter-rotating for simulation M11, and partly counter-rotating for simulation M12z. We conclude that the kinematical properties of the remnants are strongly dependent of the initial conditions.
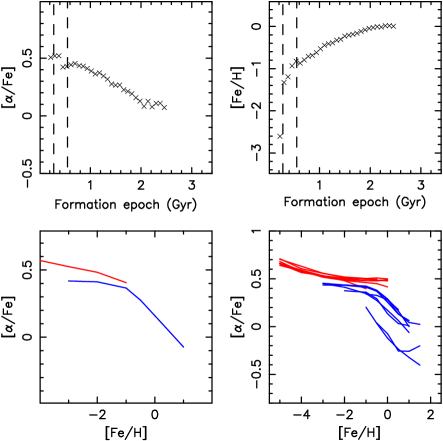
The chemical properties are presented in Fig. 5. The top panels show and versus formation epoch for simulation M12. decreases with time, while increases strongly before and during the merger, and keeps increasing, but more slowly, after the merger. The bottom left panel shows versus for simulation M12. Old stars have larger -element abundance than young stars, up to a relatively high metallicity (). decreases with time as the metallicity increases, until it reaches the values found in the thin disc. This decrease of is slowed near the beginning of the collision, as the starburst leads to a large number of Type II SNe, that enrich the gas in -elements. After the starburst, Type Ia SNe become effective, and enrich the gas in iron. This explains why gradually decreases after the collision. The bottom right panel shows versus metallicity for all 8 simulations. The results for old stars (red curves) are nearly identical for all simulations. Hence, the mergers leave a clear chemical signature: the old stars, located in the thick disc and the halo, have a ratio that remains constant at with increasing up to high metallicities (), while the young stars, located in the thin disc, have a lower ratio which decreases with increasing metallicities.
References
- [Brook et al.(2007)] Brook, C., Richard, S., Kawata, D., Martel, H., & Gibson, B. K. 2007, ApJ, 658, 60
- [Kawata & Gibson(2003a)] Kawata, D., & Gibson, B. K. 2003a, MNRAS, 340, 908
- [Kawata & Gibson(2003b)] Kawata, D., & Gibson, B. K. 2003b, MNRAS, 346, 135
- [Naab & Burkert(2003)] Naab, T., & Burkert, A. 2003, ApJ, 597, 893
- [Richard et al.(2010)] Richard, S., Brook, C. B., Martel, H., Kawata, D., Gibson, B. K., & Sánchez-Blásquez, P. 2010, MNRAS, 402, 1489
- [Toomre(1977)] Toomre, A., 1977, in Evolution of Galaxies and Stellar Populations, eds. B. M. Tinsley & R. B. Larson, (New Haven: Yale University Observatory), p. 401