DEEP, WIDE-FIELD CCD PHOTOMETRY FOR
THE OPEN CLUSTER NGC 3532
Abstract
We present the results of a deep, wide-field CCD survey for the open cluster NGC 3532. Our new photometry effectively covers a one square degree area and reaches an unprecedented depth of to reveal that NGC 3532 is a rich open cluster that harbors a large number of faint, low-mass stars. We employ a number of methods to reduce the impact of field star contamination in the cluster color-magnitude diagrams, including supplementing our photometry with data from the 2MASS catalog. These efforts allow us to define a robust sample of candidate main sequence stars suitable for a purely empirical determination of the cluster’s parameters by comparing them to the well-established Hyades main sequence. Our results confirm previous findings that NGC 3532 lies fairly near to the Sun [; pc] and has an extremely low reddening for its location near the Galactic plane []. Moreover, an age of Myr has been derived for the cluster by fitting a set of overshooting isochrones to the well-populated upper main-sequence. This new photometry also extends faint enough to reach the cluster white dwarf sequence, as confirmed by our photometric recovery of eight spectroscopically identified members of the cluster. Using the location of these eight members, along with the latest theoretical cooling tracks, we have identified additional white dwarf stars in the color-magnitude diagram that have a high probability of belonging to NGC 3532. Reassuringly, the age we derive from fitting white dwarf isochrones to the locus of these stars, Myr, is consistent with the age derived from the turnoff. Our analysis of the photometry also includes an estimation of the binary star fraction, as well as a determination of the cluster’s luminosity and mass functions.
1 Introduction
NGC 3532 (equinox J2000.0, 11:05:33, 58:43:48; , ) is a beautifully expansive, very rich open cluster located in the constellation Carina, only three degrees from the star Carinae. The earliest known studies of the cluster’s characteristics include the works by Trumpler (1930), Wallenquist (1931), Martin (1933), and Rieke (1937). They determined, in order of author, the cluster’s distance, photographic magnitudes, spectral types and distance, photovisual magnitudes and positions, and spectroscopic parallaxes.
More recently, there have been a few published photometric and kinematic investigations, based on photoelectric and/or photographic observations, of the cluster’s properties. The earliest known in-depth study of NGC 3532 was by Koelbloed (1959), who presented the first photoelectric photometry in the fledgling Johnson system for 83 stars and derived proper motion estimates for some of the brighter stars in the field. Despite the small stellar sample, Koelbloed was able to robustly estimate a cluster distance modulus of (432 pc) using the main-sequence fitting technique and assign values of and 100 Myr for its reddening and age, respectively, based on the appearance of the stars in its color magnitude diagram (CMD).
Additional photoelectric photometry for NGC 3532 in the Johnson system has been presented in the years since Koelbloed’s study. These include the investigations by Butler (1977), Fernandez & Salgado (1980), Johansson (1981), and Claria & Lapasset (1988). Wizinowich & Garrison (1982) expanded on the broadband data available for this cluster by including observations in the Kron-Cousins filters in addition to Johnson . Moreover, a handful of photoelectric analyses of NGC 3532 has been presented in a variety of other niche filter systems. Most notable of these are the observations of Eggen (1981), Johansson (1981), and Schneider (1987), the data on the and Washington photometric systems presented by Claria & Lapasset (1988) and Claria & Minniti (1988), respectively, and Geneva photometry given by Rufener (1988).
Arguably, the most comprehensive of all the photometric investigations listed above (in terms of depth and sky coverage) is that of Fernandez & Salgado (1980) who presented a broadband CMD for NGC 3532 consisting of 700 stars extending down to . Most of their photometry (), however, was extracted from photographic plates, while the rest were obtained individually using a photomultiplier. Nonetheless, their stellar sample was sufficient to allow them to estimate a total cluster mass of , which strongly suggests a much larger cluster population extending to fainter magnitudes than observed in their data. The cluster parameters they derive are in good agreement with those given by Koelbloed (1959); namely, , , and an age of Myr.
Motivated by the surprising lack of more recent photometric investigations for such a seemingly rich and expansive open cluster, we have undertaken an extensive project to obtain deep, wide-field, multi-epoch observations of NGC 3532. There are two primary goals for these new data. First, we wish to construct modern CCD-based CMDs for the cluster that extend as faint as and utilize multiple color indices for all stars within an approximate one square degree area surrounding the cluster center. This new photometry provides a nearly complete census of the cluster population, including its white dwarfs, and allows us to more accurately derive its fundamental properties (i.e., distance, reddening, and age). Secondly, using -band images obtained at various epochs we endeavor to identify and characterize both the short- and long-period variable stars in the field, specifically those that belong to NGC 3532 itself.
While the present manuscript focuses on the new broadband photometry that we have obtained for the NGC 3532 field and describes our efforts to better characterize its properties, a companion paper (in preparation) will present the results of our search for cluster variable stars. An outline of the current paper is as follows. In the next section we describe the observational strategy for this project together with a discussion of the photometric and astrometric calibration procedures. Section 3 presents the cluster CMDs and compares our new, CCD-based photometry to the photoelectric data presented by previous studies. We analyze these CMDs in Section 4 in an effort to provide new estimates for the cluster properties, investigate the cluster’s white dwarf and binary population, and derive the luminosity and mass functions. Finally, we conclude by summarizing our findings in Section 5.
2 Observations
The current observations of NGC 3532 were collected at the Cerro Tololo Inter-American Observatory (CTIO) 0.9m telescope over a number of nights scheduled during the 2000A observing semester. The images were obtained using a 2048x2048 Tektronix CCD equipped with a set of broadband Johnson-Kron-Cousins filters. This detector had a read noise of , pixel scale of pixel-1, and field of view of 13.5x13.5 square arcminutes.
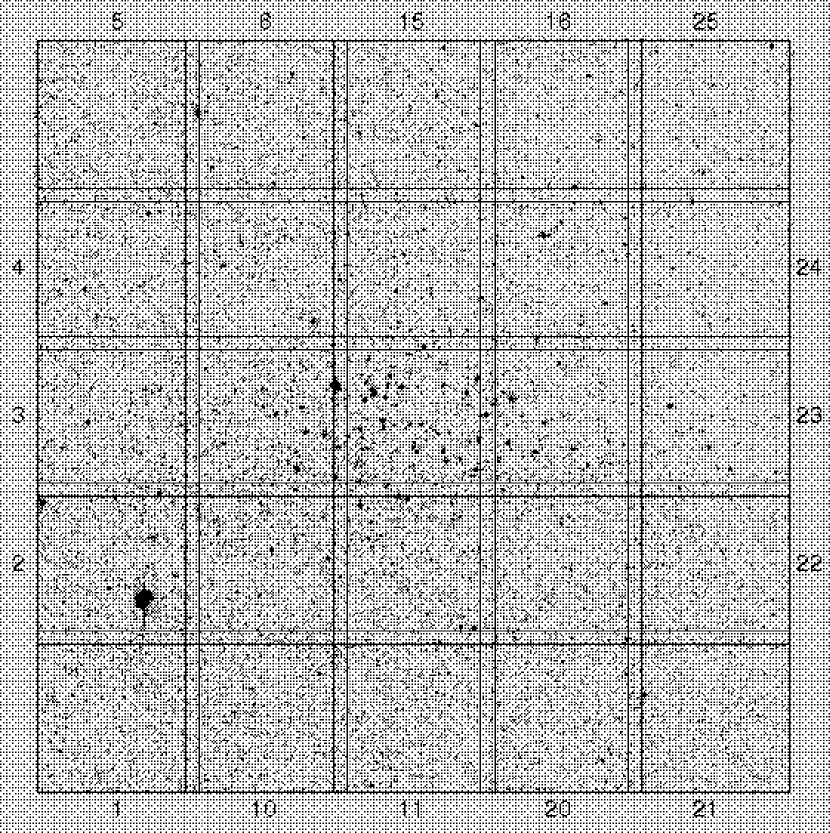
The observing strategy for this project was designed to address the overall science goals mentioned in the previous section. To obtain the deep, wide-field photometry of the cluster and its surrounding, our plan was to observe multiple fields using a varying range of exposure times in each of the filters. Note that while our program would have obviously benefited from the inclusion of -band photometry, the relatively poor short-wavelength sensitivity of the CCD meant that performing observations in the filter would have required a significant fraction of our allocated telescope time. Given the effective field of view for the Tektronix CCD, we defined a grid pattern of 25 different telescope pointings, centered on 11:05:37, 58:43:07 (J2000.0), that would combine to achieve a total one square degree sky coverage. A finding chart for the NGC 3532 field, constructed from our best seeing CCD images, that illustrates the pattern of our observations, is given in Figure 1. Note that each of these fields overlapped its neighbors by at least one arcminute to allow comparison of photometry derived for adjacent pointings. Since our desire was to obtain high-precision photometry for the majority of stars in the cluster extending much fainter than previous studies, we tailored the exposure times to achieve good signal-to-noise ratios for cluster stars ranging in magnitude between . Therefore, each of our 25 fields was observed using exposure times of 1s, 5s, 30s, 100s, and 240s. Ultimately, we were able to obtain at least one observation in , , , and using each of these exposure times for every field. Moreover, during photometric nights, a number of standard star fields from the lists of Landolt (1992) were also observed to facilitate the transformation of our instrumental photometry to the standard system.
To address the secondary goal of identifying and characterizing the variable stars in the field, our observing runs were scheduled such that -band observations could be collected over the entire 6 month period from 2000 Feb-Jul to help identify both short- and long-term variables. An outline of our observing runs is listed in Table 1, where the number of frames collected in each filter, along with the fields observed in NGC 3532 (c.f., Figure 1), is provided. Note that the run scheduled for 2000 Feb 25 - Mar 1 was devoted primarily to obtaining the cluster photometry and standard stars were observed depending on photometric conditions. For the nights of 2000 Mar 17-21, we observed all 25 of the cluster fields in the -band with the aim of obtaining at least 1 epoch of observations per field per night. Finally, the scattering of nights scheduled in 2000 Feb, Mar, Apr, May, and Jun took advantage of the CTIO Synoptic, Sidereal, and Target of Opportunity (SSTO) pilot program to collect additional -band observations of the cluster at a variety of epochs spanning the observing semester to help pick out long-term variables. Due to the limitations of the SSTO program, however, we were limited to observing no more than 3 fields per night. Hence, we identified 3 new subfields, designated fields 26, 27, and 28, that approximately overlap fields 13, 14, and 15, respectively, in Figure 1 and were selected to provide a radial sampling of the cluster stars. It is important to note that exposure times used for our cluster monitoring were identical to those listed above, namely, each field was observed using integrations of 1s, 5s, 30s, 100s, and 240s.
Overall, the observing program netted a total of 2171 frames for the NGC 3532 field (150 frames each in and 1721 frames in ). Moreover, we collected 232 observations of Landolt standard fields during photometric occasions on 5 separate nights (60 in , 64 in , and 54 in both and ). Ultimately, the observations that were obtained on these nights are used to construct the cluster CMDs that will be analyzed here, while the -band frames taken over the entire 6 month period will be used in the companion paper to search for variable stars.
All cluster and standard frames were preprocessed (i.e., bias subtraction and flat fielding) using the standard set of tasks within IRAF111IRAF is distributed by the National Optical Astronomy Observatories, which is operated by the Association of Universities for Research in Astronomy, Inc., under contract to the National Science Foundation.. Once instrumental signatures were removed from these frames, the analysis moved to extracting photometry for both the cluster and standard stars. For the latter, we relied upon standard aperture photometry using an aperture diameter of since this was the same size favored by Landolt (1992, 2009) in measuring the flux of his standard stars. For stars in the cluster fields, on the other hand, we employed the technique of PSF-fitting as part of the DAOPHOT/ALLSTAR suite of algorithms (Stetson, 1987; Stetson & Harris, 1988) to derive their instrumental magnitudes. Briefly, this technique involved detecting star-like objects in the image, constructing a model PSF from a subsample of these objects, and subsequently subtracting this model from the detections to yield a list of instrumental magnitudes, associated uncertainties, and positional information for stars in the frame. This technique was iterated upon 2-3 times using between 50 and 150 stars in each image (depending on exposure time) to construct the model point spread function. During each iteration, the subtracted image was fed back into the star detection algorithm to locate stars that might have been missed in previous runs due to the effects of crowding.
Once the instrumental photometry had been extracted from each image, it was necessary to place the PSF-based magnitudes on a more absolute, aperture-based scale similar to those derived for the standard stars. This step was accomplished using the method of concentric aperture growth-curve analysis as part of the DAOGROW package (Stetson, 1990) with the goal to derive a set of “aperture corrections” which, when applied to the PSF-determined magnitudes, allowed the measurements made on different nights and during different seeing conditions to be placed on a homogeneous, aperture-based system. The resulting aperture-corrected PSF magnitudes can be readily transformed to the standard system defined by the standard stars by employing typical calibration techniques.
In order to translate the CCD-based positions derived for the cluster and standard stars to a more meaningful -based system, we employed the positional information given in the UCAC3 catalog (Zacharias et al., 2010) as our astrometric reference. In brief, the UCAC3 catalog positions are used to derive a set of preliminary transformation equations that account for offset, scale, and rotation differences between the CCD-based and astrometric standard systems by relying on only a handful of the brightest stars in each field. Next, these initial transformation estimates are fed into the DAOMASTER task in an effort to improve their precision and accuracy by employing a set of third-order polynomials that further account for small higher-order effects (e.g., due to optical distortions, filter-induced scale differences, and/or differential refraction) in the CCD images. These transformations, which are based on a larger sample of stars in common between the CCD image and the UCAC3 astrometric reference catalog, are iterated upon until a matching tolerance of is achieved and the total number of stars in the master list stabilizes. The average RMS of the residuals resulting from the fitting process generally ranged between for each frame, which is in agreement with the characteristic accuracy of the positions in the UCAC3 catalog. In the end, this technique allowed us to derive a master -based list of detected objects for not only the cluster field, but also the fields containing the standard stars to help facilitate the matching of the photometry from frame-to-frame.
Once the master star list for NGC 3532 had been created and the astrometric transformation equations determined using these methods, the entire set of 2171 cluster frames, along with their associated PSF models and photometry lists, are were into the ALLFRAME program (Stetson, 1994) in an effort to improve upon the profile-fitted photometry by deriving a homogeneous set of positions and magnitudes for all detected objects regardless of seeing conditions, crowding effects, or filters employed.
To transform our instrumental photometry to the standard system, extinction, zero-point and color transformation coefficients were derived using iterative weighted least squares fits to the photometry for 60-80 standard stars, depending on filter. These fits also reject stars with large residuals to ensure spurious measurements do not influence the overall quality of the transformations. Equations of the form
,
,
, and
were used to transform the photometry, where the terms on the left sides of the equations represent the observed instrumental magnitudes, and those on the right are their corresponding values on the standard system. The , , and terms represent the extinction, color, and zero-point coefficients, respectively, that were each calculated on a nightly basis when standard stars were observed.
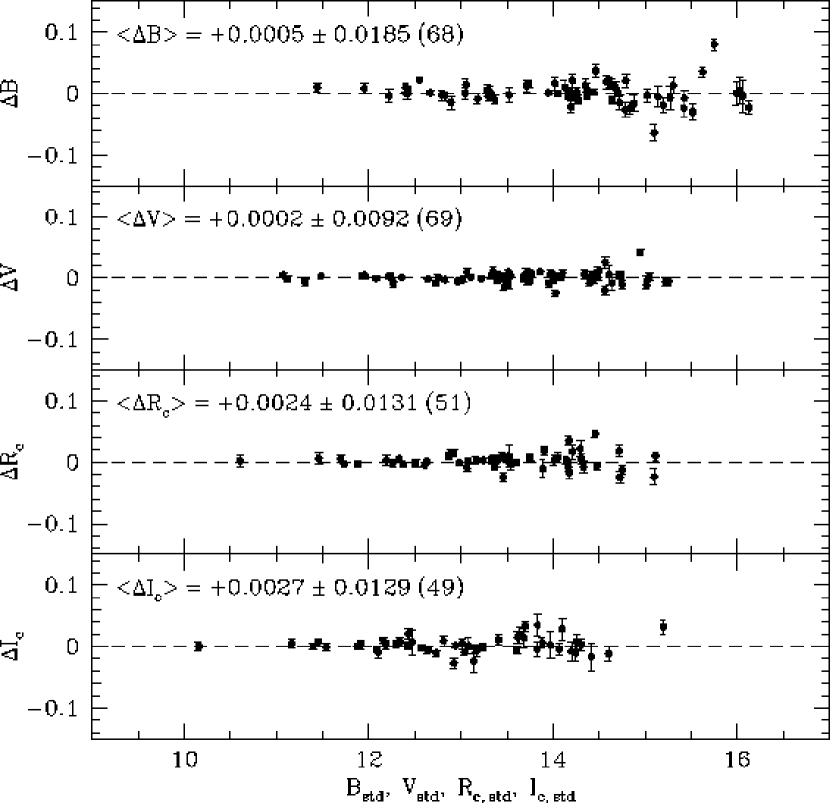
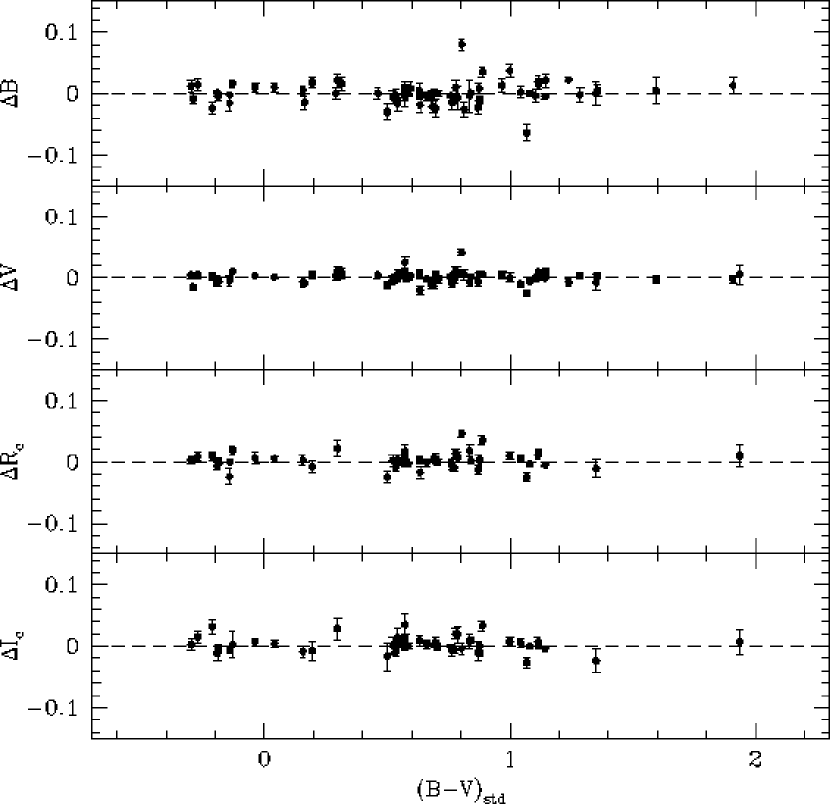
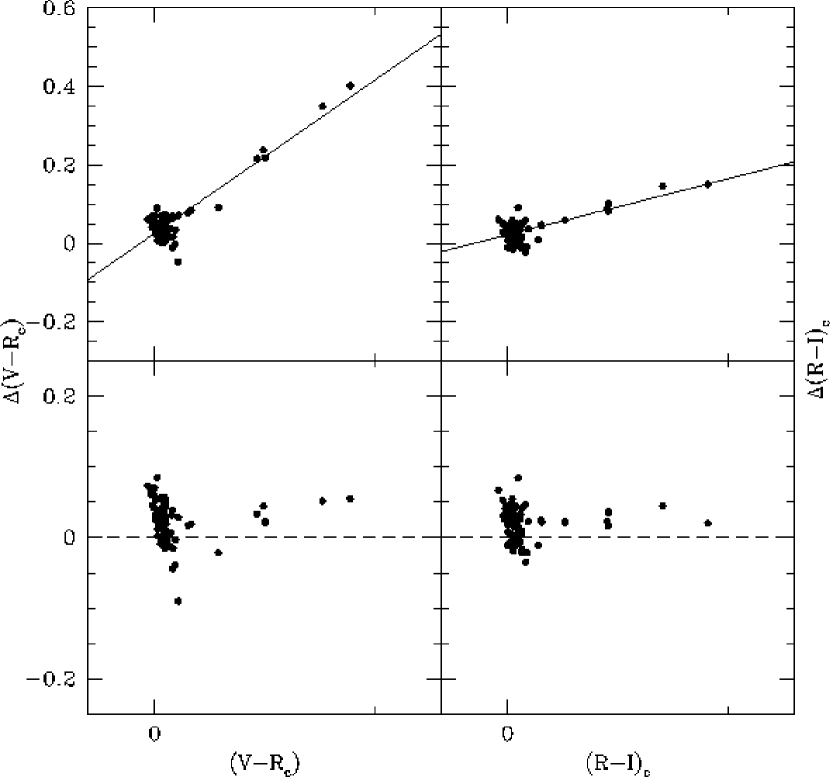
The overall quality of these photometric transforms can be tested by comparing the computed magnitudes of our observed standard stars to their counterparts on the standard system. Figures 2 and 3 show such comparisons, with the differences in the individual magnitudes, in the sense of ours minus Landolt, plotted versus standard magnitude and standard color, respectively. In each plot, we limit the number of stars based on the conditions that each must have a photometric uncertainty less than mag (standard error of the mean) and be measured at least 2 times in both data sets. Plots such as these help to identify possible trends in the residuals that would warrant the inclusion of additional terms in the transformation equations. Reassuringly, there appear to be no strong systematic differences between our recovered magnitudes and those of Landolt (2009), and the majority of data points cluster quite tightly about the loci of zero photometric difference, denoted as dashed horizontal lines. Based on the mean magnitude differences indicated in each panel of Figure 2, we deduce that the zero-points of our NGC 3532 photometry are accurate to mag or better for any given filter.
Once the photometric coefficients were determined, it was simply a matter of applying the transformation equations in reverse to yield calibrated photometry for the cluster stars. For this step, the ALLFRAME-determined, aperture-corrected PSF magnitudes for a small sample of bright stars in each image, typically those selected to construct the PSF, were first transformed to the standard system to serve as a set of local secondary standards. The calibrated photometry for this subsample is subsequently used to relate the remaining stars in each field to the standard system by determining frame-to-frame zero-point differences that may exist due to short-term variations in extinction and/or errors in the aperture corrections.
3 Results
3.1 Current Photometry
Our reductions of the entire NGC 3532 field netted both astrometric positions and photometry for 316,367 objects within a one square degree area surrounding the cluster center. An example of these data is given in Table 2. From this sample, we will consider a total of 285,990 objects for further analysis since they were detected at least once in each of the , , , and filters. The fact that the vast majority of the remaining 30,377 excluded objects () have implies they likely went undetected in one or more filters due to their extreme faintness and/or the effects of crowding.
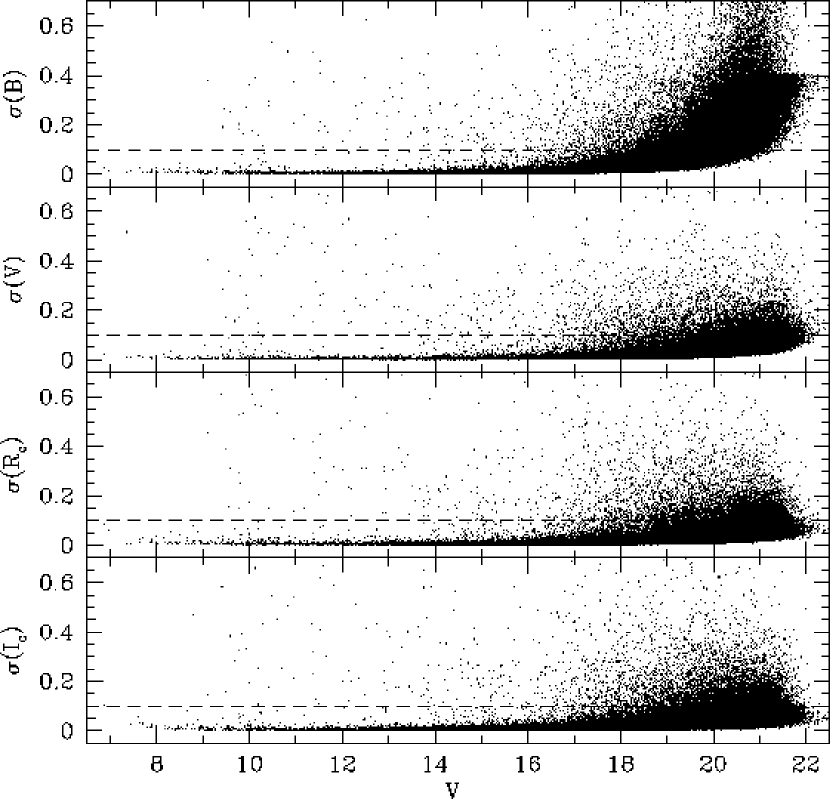
In Figure 4, we plot the uncertainties in each magnitude, , versus for the sample of objects with valid measurements in all four filters. These uncertainty values represent the standard error of the mean magnitude as computed by our reductions. Depending on the number of measurements for a particular object, is dominated by either the internal noise estimates in the photometric reductions or by the external frame-to-frame agreement in the calibrated magnitudes. Note the high precision in our photometry, with the majority of stars having for the , , and filters over the entire magnitude range. The -band uncertainties, on the other hand, begin to rise above 0.1 mag at , indicating that our observing program would have benefited from longer exposure times in in order to achieve the same depth as the other filters.
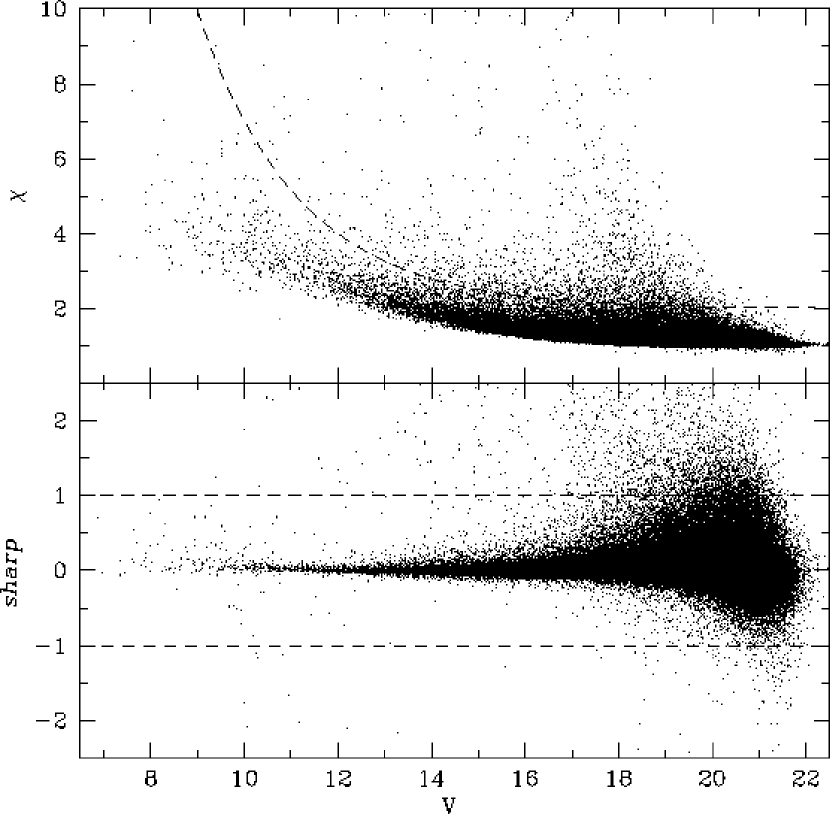
The ALLFRAME reductions also supply two image quality parameters known as and that are based on the pixel-to-pixel residuals between the model PSF and the observed brightness profile for any given object (Stetson et al., 2003). While the former can be used to separate out objects that are contaminated by image defects, bad pixels or diffraction spikes, the latter is useful for isolating legitimate stars from background galaxies. The and estimates given in Table 2 for any given entry represent the mean of those determined individually for each frame in which that object was detected. Figure 5 provides a plot of the and values versus magnitude for the same number of objects shown in Figure 4.
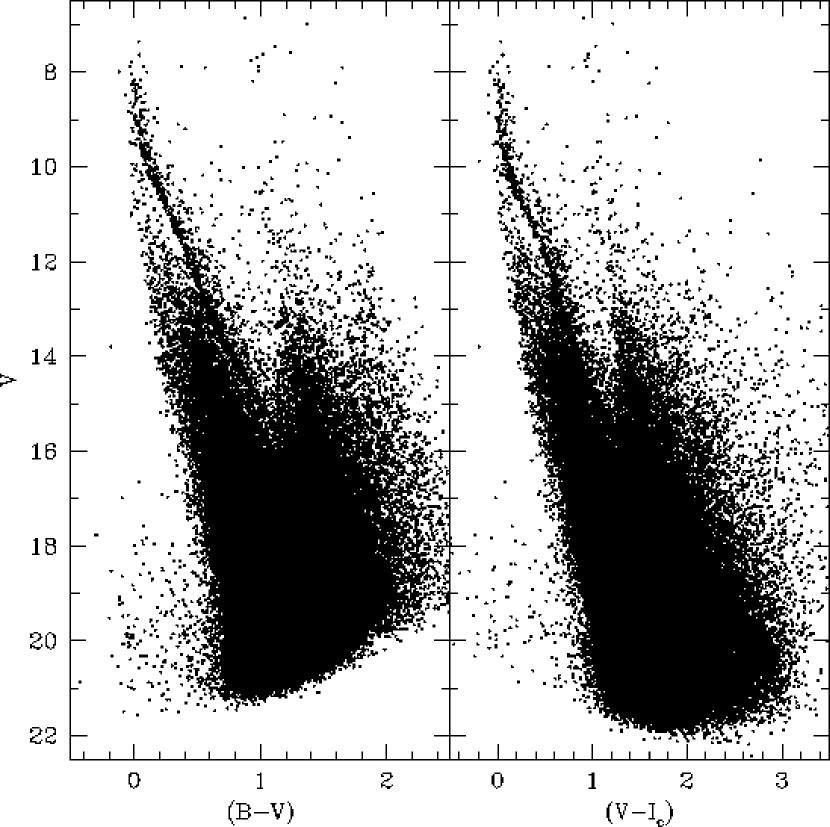
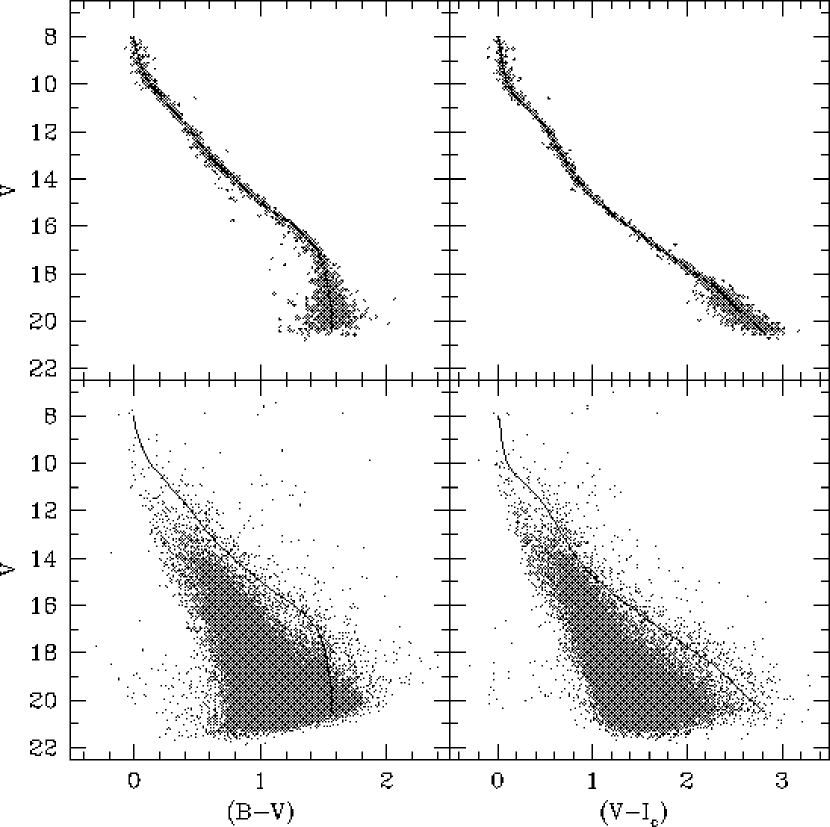
The and color-magnitude diagrams (CMDs) for NGC 3532 that result from our reductions are shown in Figure 6. In both panels we plot only those stars judged to have the highest quality photometry based on their photometric uncertainties, the number of independent measurements in each filter, and values of the ALLFRAME-computed image quality statistics, and . Specifically, we have plotted stars that have at least one measurement in any given filter together with mag, , and (we have denoted these limits by the dashed lines in Figures 4 and 5).
Upon inspection of the CMDs in Figure 6, a few things are immediately evident. First, a well-defined cluster main sequence can clearly be seen extending from the turnoff at down to where it begins to become lost in field star contamination. The significant number of field stars in the CMDs undoubtedly arises due to the low Galactic latitude of the cluster. Within the field star distribution there appear to be two separate populations; one corresponding to the field dwarfs that lies fainter and blueward of the cluster main sequence, with a second distinct population associated with field giant stars that can be identified as the plume of stars at and . These field stars begin to overlap the cluster population at , making it quite difficult to ascertain the exact location of the cluster main sequence at fainter magnitudes.
At the brightest end of each CMD there is a handful of cluster red giants at and . Such a small population of giant stars, combined with the near-vertical nature of the turnoff and upper main sequence points to the fact that NGC 3532 is a fairly young cluster (i.e., Gyr). In addition, there are two objects lying between the turnoff and giant clump at that may be cluster stars transitioning the Hertzsprung gap. A more detailed analysis of the giant star population in NGC 3532 will be given in Section 4.3.
Finally, the CMD in the left-hand panel of Figure 6 also shows the presence of several faint blue objects that we presume to be part of the white dwarf sequence of NGC 3532. Moreover, it appears that the majority of these stars are positioned in a clump lying at 20 and , with only a handful of stars extending fainter. White dwarfs as faint as are known to exist in NGC 3532 based on the investigations of Reimers & Koester (1989) and Koester & Reimers (1993). It may indeed be the case that this clump corresponds to the end of the white dwarf cooling sequence. If so, it would provide an independent method for deriving the cluster age by fitting white dwarf cooling models to the observed population. A more detailed analysis of these faint, blue objects will be given in Section 4.4.
3.2 Comparisons with Previous Photometry
A number of other photometric studies have been published for NGC 3532, though none that provide the depth and coverage of this one. Using the excellent resources available at the WEBDA website222http://www.univie.ac.at/webda/, we have been able to cross-identify stars that are in common between our study and the WEBDA database for the purpose of comparing the broadband photometry presented by previous studies for NGC 3532. Specifically, we consider the photometric data given in the following publications: Koelbloed (1959, hereafter K59) (82 stars), Butler (1977, hereafter B77) (26 stars), Fernandez & Salgado (1980, hereafter FS80) (180 stars), Johansson (1981, hereafter J81) (14 stars), Wizinowich & Garrison (1982, hereafter WG82) (68 stars), and Claria & Lapasset (1988, hereafter CL88) (12 stars). All of these investigations provided Johnson photometry for their stars, while the work of WG82 is the only one to include Cousins photometry.
Table 3 presents the correspondence between the WEBDA identification system for stars given in these studies and our own numbering system, along with the equatorial coordinates and photometric information derived as part of our analysis. In Table 4 we have listed the previously published photometry from the studies listed above for all stars in Table 3. It should be noted that due to space limitations, Table 4 only includes the data relevant to our comparisons, and excludes any information that has little or no impact on the analysis presented here (e.g., some of these studies provide colors, number of individual measurements for each star, magnitude and/or color uncertainties, etc.).
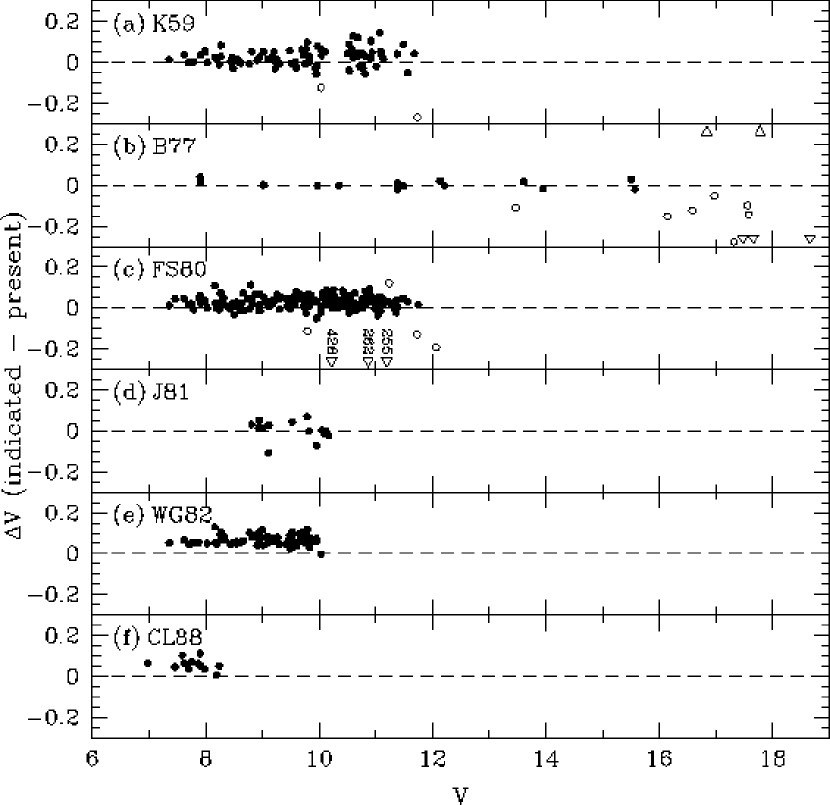
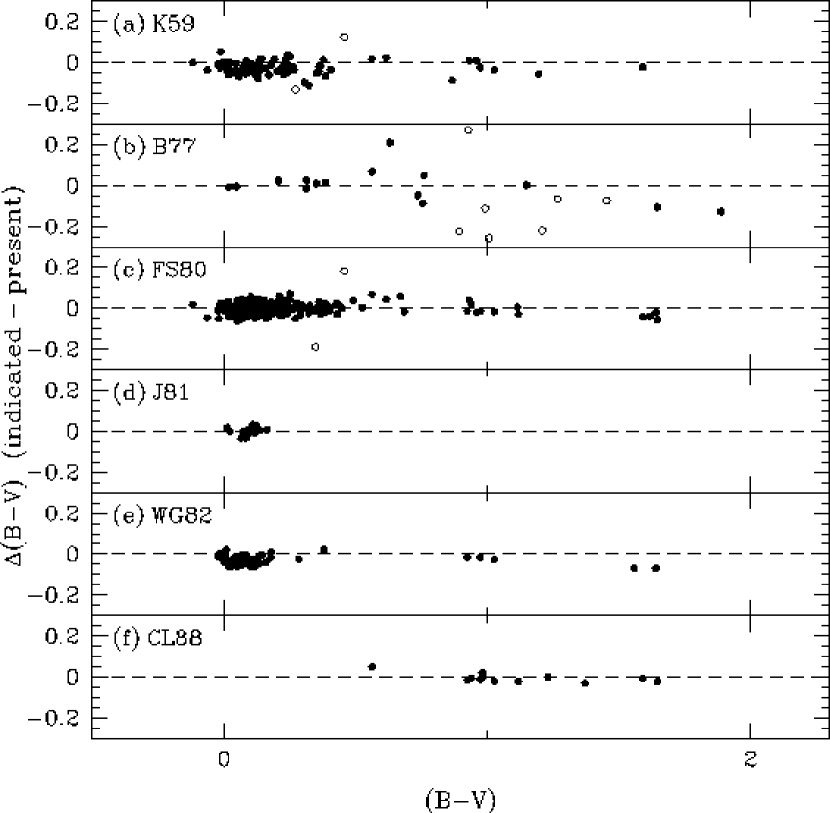
By combining the information listed in both Tables 3 and 4, we are able to create Figures 7 and 8 that show the differences in magnitudes and colors, respectively, for each of the six previous photometric studies of NGC 3532. In both figures, the magnitude and color differences plotted along the ordinates are in the sense of the indicated study minus our present data, while the abscissae give our magnitudes and colors. Some of the panels include open triangles that are meant to point to data lying beyond the ranges of these plots, and a few of these triangles are labeled with their WEBDA identification numbers for further discussion below.
An examination of our finding chart in Figure 1 reveals that WEBDA stars #426, #262, and #255 are situated very close to other bright stars; thus, the magnitudes presented by the FS80 study are likely too bright when compared with ours since their measuring aperture probably contained too much light from the neighbors. This assumption is supported by our comparisons when considering that the values for #426, #262, and #255 are all negative (, , , respectively). However, we cannot rule out that these stars may actually exhibit some variability that is the cause of such large values.
In addition to the discussions of these individual stars, we also point to the large scatter in the comparison of our magnitudes to those of B77 for stars fainter than in panel (b) of Figure 7. Indeed, B77 claims that his photometry for stars with has a high degree of uncertainty among their individual measurements due to their extreme faintness. Given this, along with the large scatter seen at the faint end of panel (b), we do not place any significance on the B77 photometry for stars with .
Furthermore, comparisons involving the photometry of WG82 exhibit some peculiarities as shown in Figure 9. There are strong systematic differences in both and between our photometry and theirs as shown in the top row of the figure. Unfortunately, no other studies of NGC 3532 using the Cousins filters exist in the literature that would help to identify which set of photometry is at fault. Based on the fact, however, that Figures 2 and 3 of the present investigation show that the recovered magnitudes of our observed standards are in very good agreement with those given by Landolt (2009), we conclude that the problem actually lies in the photometry tabulated by WG82. Rather than delve too deeply into this, we simply assume that these systematic differences can be corrected using a simple linear relationship. Based on a least-squares fit to the data we find the slopes of the lines shown in the top panels of Figure 9 to be for and for . Using this information to correct the WG82 photometry results in the plots shown in the bottom panels.
Table 5 gives our computed differences in the magnitudes and colors for the indicated studies. The “Clipped Mean” column represents a determination of the mean based on an iterative clipping scheme where all stars that lie beyond 3 times the standard deviation are rejected from the computation of the average. The stars removed in this way are indicated in both Figures 7 and 8 as open circles or open triangles. The number of stars used in each of these computations is also provided along with the number of stars rejected. Note that our mean values derived for the photometry in the B77 investigation include stars brighter than . Also note that the means given for the and colors of WG82 assume that the systematics shown in the top panels of Figure 9 have been removed.
Among the studies considered here, the one exhibiting the largest differences, both in magnitude and color, is that of WG82. Indeed, WG82 were aware of a zero-point difference between their data when compared to both K59 and FS80, despite all three of these investigations using E-region standards to calibrate their photometry. They cited declination effects in their observing equipment as a possible explanation for these differences. Whatever the reason, our value of for their study is the largest of the six. This fact, together with the earlier discussion regarding the strange systematics in their and colors (c.f., Figure 9), is an indication that their photometry for NGC 3532 should be used with caution.
3.3 Isolating the Main Sequence
The fact that NGC 3532 is projected against a very rich population of disk stars at low galactic latitude is clearly evident by the large amount of field star contamination in the CMDs shown in Figure 6. As a result, we are forced to explore various techniques that would help to reduce the impact of this field population on the CMDs and to better define the cluster main sequence towards fainter magnitudes.
Stellar proper motions can be used as a robust and reliable tool to help determine cluster membership. To this end, we have cross-referenced our photometry list with the stars in the UCAC3 catalog in an effort to better separate the field and cluster populations. There are 18,131 stars in common, with 17,076 of these judged to be legitimate single stars as based on their object classification and double star flags in UCAC3 (see Zacharias et al. 2010 for details). We further reduce the sample by 704 more stars that either have blank or null entries for their proper motions.
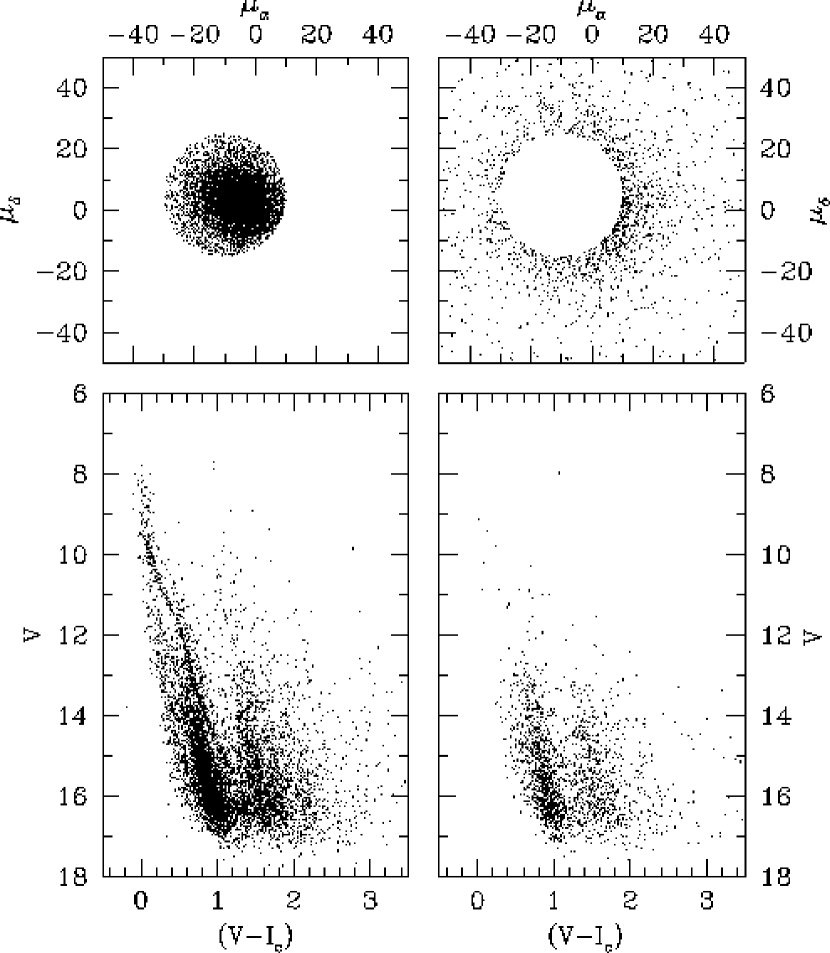
In Figure 10 we present the proper motion diagram that results from the UCAC3 data together with the CMD for stars in the NGC 3532 field that have complementary photometry. In the left-hand panels we plot only those stars within a radius of 25 mas yr-1 of the absolute proper motion for the cluster (, ; van Leeuwen, 2009), whereas the right-hand panels show stars outside this radius. Although this selection criterion does succeed in removing some of the field star contamination, especially towards the faint end of the CMD, the fact that the cluster’s absolute proper motion does not differ appreciably from that of the background field stars (assumed to be ) poses some difficulty for our attempts to isolate the main sequence. While a radius of 25 mas yr-1 may seem to be a bit too generous, additional plots such as these, which are not shown here, that use selection radii of 10, 15, and 20 mas yr-1 did further succeed in reducing the number of field stars, but at the cost of excluding more and more stars that appeared to lie on or near the NGC 3532 main sequence, particularly towards the fainter magnitudes where errors in UCAC3 proper motions begin to become quite large. Moreover, the magnitude limit of the UCAC3 catalog () clearly does not extend to the faintest areas of the CMD where the field star population begins to totally obscure the cluster main sequence (c.f., Figure 6). In the end, we are resigned to accept that we cannot rely solely upon the UCAC3 proper motion information to procure a decent sample of bona fide cluster members, at least towards the fainter end of the CMDs where the field star contamination is the heaviest.
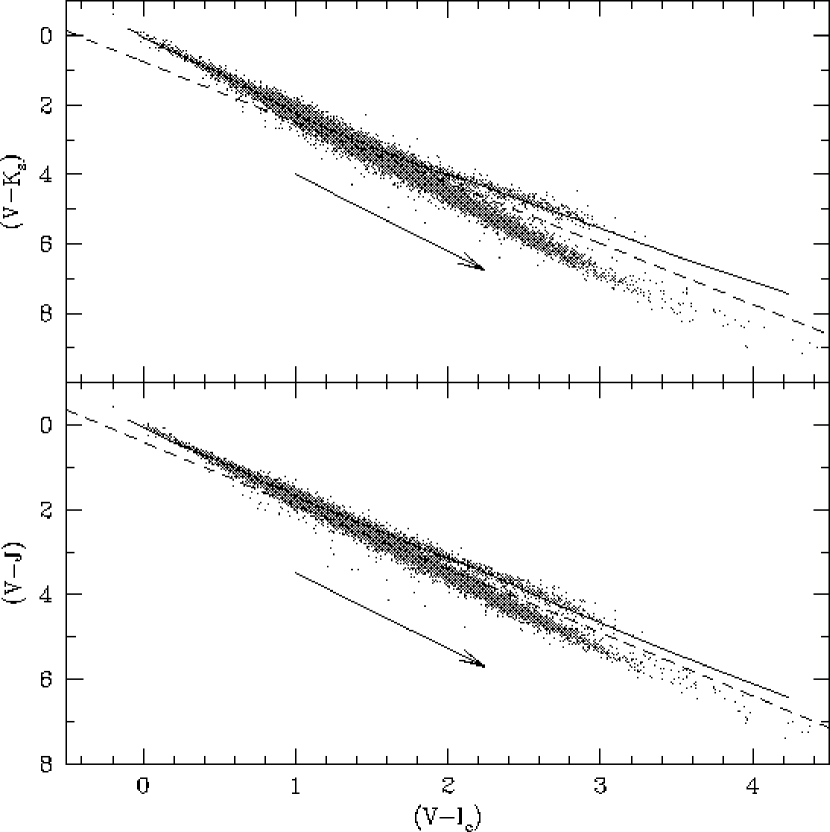
A second attempt to reduce the field star contamination involved isolating the cluster sequence from the background stars by supplementing our data with infrared photometry. To this end, we extracted the magnitudes and associated uncertainties for 67,670 stars in common between our data set and the 2MASS catalog. Our goal was to ascertain which combination of optical and/or infrared color indices produced the best possible separation between the field and cluster populations. The results of this exercise are shown in Figure 11 where we have plotted two color-color diagrams for stars in the NGC 3532 field. The diagram in the bottom panel reveals a noticeable separation between two distinct sequences of stars toward the redward end of the plot. Likewise, the diagram in the top panel shows this same separation, but to a somewhat greater degree. To help us better identify which of these sequences actually belong to the cluster itself we have overplotted the standard relations for dwarf stars (solid lines) as given by Bessell & Brett (1988), transformed to the 2MASS system using the relations of Carpenter (2001), in both panels. Based not only on the reddening vectors indicated in the plots, but also the loci of dwarfs predicted by the standard relations, we conclude that the lower branch of stars lying at in both panels correspond primarily to the population of field disk stars with various reddenings. The stars in the upper branch, on the other hand, include both legitimate cluster stars as well as some of the field dwarf stars that are situated on the blueward side of the main sequence in Figure 6.
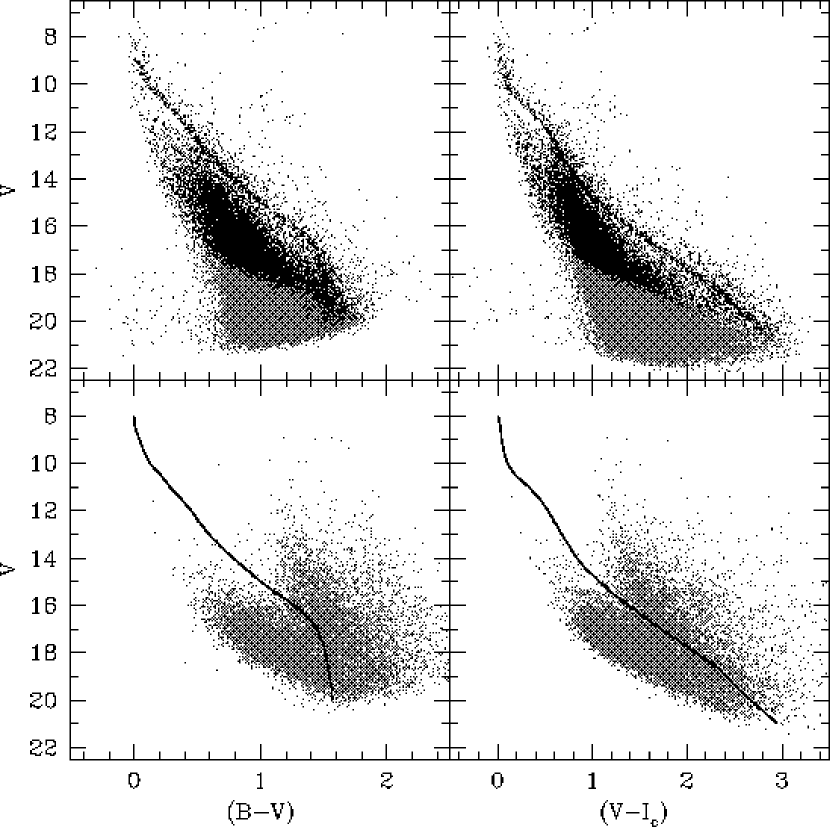
If we exclude stars lying below the dashed lines in Figure 11 and replot the CMDs for NGC 3532, as shown in the top row of Figure 12, then the cluster’s lower main sequence stands out quite clearly against the remaining field star population and can easily be traced down to . It is important to note that we have used the same criteria for plotting the CMDs as in Figure 6 but with the addition of excluding stars that have uncertainties greater than 0.2 mag in their magnitudes. Stars that satisfy these criteria are denoted by black dots in Figure 12, while those that have large uncertainties in , or lack 2MASS photometry entirely, are shown as gray dots. Note that the lack of field stars having photometry towards bluer colors in each CMD is due to the fact that these stars are just too faint to be detected by the 2MASS survey. Fortunately for us, however, their absence does not inhibit our investigation of the NGC 3532 main sequence since these stars primarily belong to the field population.
While our arbitrary selection of photometry based on the locations of stars in the color-color diagrams in Figure 11 has helped us to better define the cluster main sequence, the question remains as to whether our culling process may have also excluded some legitimate cluster members. For this reason, we show in the bottom panels of Figure 12 the stars that were rejected based on their locations below the lines in Figure 11. Unfortunately, the density of field stars in the vicinity of the lower main sequence is still too high to judge if any stars belonging to the cluster still remain, but based on the photometry we have derived for the NGC 3532 field, in combination with the 2MASS magnitudes, this is likely the best method, given the information currently available, for separating the cluster sequence from the field stars at fainter magnitudes.
In order to benefit our analysis of NGC 3532 in later sections, we will further endeavor to isolate the cluster’s main sequence from the field star population using a technique of photometric filtering. Our aim is to identify a sample comprised of stars that have a high probability of belonging to NGC 3532 and is based on the fact that they should remain within a common “envelope” in any given CMD, while the field stars will be scattered in and out of these envelopes depending on their reddenings and/or photometric uncertainties.
A first step in this process involves identifying the location of the main sequence in different CMDs by eye and removing stars that are more than 0.5 mag in color from this initial fiducial. In subsequent iterations the fiducial colors are redetermined by taking the median value over a small range in magnitude and excluding objects lying more than in color away from this median. The final fiducial is produced when these median values do not change appreciably from one iteration to the next, and the number of stars lying within the envelope defined by the fiducial remains constant.
Next, with a trial fiducial, we then compute a value for each object in a CMD as the following:
| (1) |
where is the difference in color between the th data point and the fiducial at the magnitude of the star, and and are the photometric errors in color and magnitude, respectively. The term corresponds to the slope of the main sequence at the data point and is included to account for the error in color caused by the uncertainty in magnitude. Finally, the term is included and adjusted to force the total to be roughly equal to the number of stars, N.
Using this definition, we compute three separate values for each star using its , and colors and magnitude. We then reject stars if any of their values is greater than . Transversely, a given star will be tagged as a member of the cluster by this technique only if all three of its values determined from its , , and colors are within .
The top row of Figure 13 presents CMDs for the final sample of main sequence stars that have been isolated from the field star population using our technique. Alternatively, the bottom row shows only the rejected stars (i.e., the field stars). Although a few obvious outliers still exist in the upper panels, our filtering has successfully removed a large number of field stars from the cluster main sequence. An important note, however, is that the bottom panels still show the presence of the cluster binary stars lying as much as 0.75 mag above the fiducial. Unfortunately, our filtering technique does not account for the presence of binaries, and our final sample of cluster members will, by design, include predominately single stars.
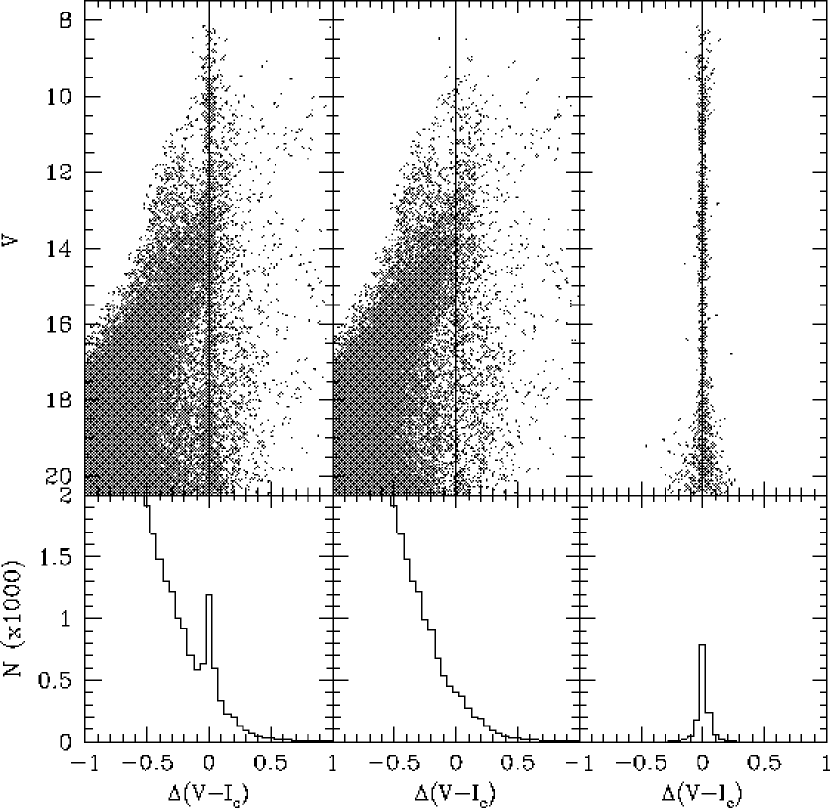
An alternative means by which to test the robustness of our photometric filtering technique is to examine the distribution of stars as a function of . Figure 14 shows a few such plots that use as the color of choice. The top row of panels show, as a function of magnitude, the values for all the stars, only the field stars, or only the cluster stars from left to right, respectively. The bottom row reveals complementary histograms of these same distributions to illustrate that once the cluster stars are removed using our filtering process, the underlying field star population shows a fairly smooth transition over the cluster main sequence region from .
4 Discussion
4.1 Previous Cluster Parameter Estimates
One of the main goals in our investigation of NGC 3532 is to derive new estimates for the cluster parameters (e.g., distance, reddening, age, etc.) that are based on the photometry presented herein. Indeed, the depth and precision of our data compared to previous works offers a number of obvious advantages for our analysis. Moreover, the combination of our data with 2MASS photometry provides high-quality observations that span a wide wavelength range and allows us to utilize different color indices to better constrain values for the cluster parameters.
Before delving into our own determination of parameters for NGC 3532, however, it is helpful to first consider some of the values for the cluster’s distance, reddening, age, and metallicity that have been derived by previous investigations. Table 6 presents a compilation of the various parameter estimates derived by the studies indicated in the first column. The final column of the table gives a brief explanation of how these parameters were determined. In some cases we also include the uncertainties in the values as quoted in the original investigations.
Interestingly, apart from the distances quoted by Robichon et al. (1999) and van Leeuwen (2009), both of which were derived using parallaxes, virtually all of the values for the distance moduli agree quite well with each other. The one exception to this is the value of given by Johansson (1981), but this is likely a direct consequence of their higher reddening compared to the other studies listed. If we instead assume , which better corresponds to the other reddening values listed in the third column, their distance modulus would increase to (assuming a reddening law). The range in distance moduli tabulated in Table 6 place the cluster between 400 and 500 pc from the Sun, making NGC 3532 one of the closest known open clusters.
The reddening for NGC 3532 likewise seems be well constrained with estimates from the various studies ranging between 0.01 and 0.1. Note that we have converted the values given by Eggen (1981), Schneider (1987), and Malysheva (1997) to assuming (Crawford, 1975). Despite its position very near the Galactic plane, the low reddening for NGC 3532 is consistent with its proximity to the Sun. For comparison, the reddening maps of Schlegel et al. (1998) give a full line of sight reddening of at Galactic coordinates corresponding to the center of the cluster. Multiplying this value by a factor of , where is the cluster’s distance, is its Galactic latitude, and the scale height of the typical dust layer (assumed to be 125 pc; Bonifacio et al., 2000) results in if pc. While this is a somewhat crude upper limit to the reddening for NGC 3532, it serves to support the remarkably low values that have been previously suggested.
Four independent estimates for the cluster’s metallicity exist in the literature. While two of these have been derived from high-resolution spectroscopic analysis of cluster giant stars (Luck, 1994; Gratton, 2000), the other two given by Piatti et al. (1995) and Twarog et al. (1997) are based on calibrations of DDO color indices versus [Fe/H]. Reassuringly, all four [Fe/H] determinations are in good agreement and point to a near-solar metallicity for the cluster. For this reason, we will adopt [Fe/H]= for NGC 3532 in the subsequent analysis.
4.2 Empirically Derived Distance and Reddening
We begin our determination of the distance and reddening for NGC 3532 by comparing the locus of cluster stars in the , , and CMDs to the well-established main sequence for the Hyades. The Hyades sample used here is based on the collection of so-called “hi-fidelity” members presented by de Bruijne et al. (2001), who derived distances to individual stars based on secular parallaxes. These secular parallaxes are times more precise than the original parallax estimates given in the catalog, thus providing better constraints on the absolute magnitudes of the Hyades members. The photometry we employ for the Hyades comes from Pinsonneault et al. (2004) who assembled data from various sources to produce a catalog of color indices for the de Bruijne et al. (2001) “hi-fi” sample. There is, however, one point to make regarding the photometry tabulated by Pinsonneault et al. (2004), in that Taylor & Joner (2005) found systematic differences between their data and Pinsonneault et al.’s for Hyades stars in common. This result is strengthened when comparing the homogeneous photometry for a large sample of Hyades stars given by Joner et al. (2006) to the photometry tabulated by Pinsonneault et al. (2004) (c.f., Fig 23 in An et al. 2007). For this reason, we have opted to use the photometry of Joner et al. (2006) for 42 out of 92 stars in the Hyades sample, while the photometry for the remaining stars comes from Pinsonneault et al. (2004), but transformed to the Joner et al. (2006) system using a simple linear relationship.
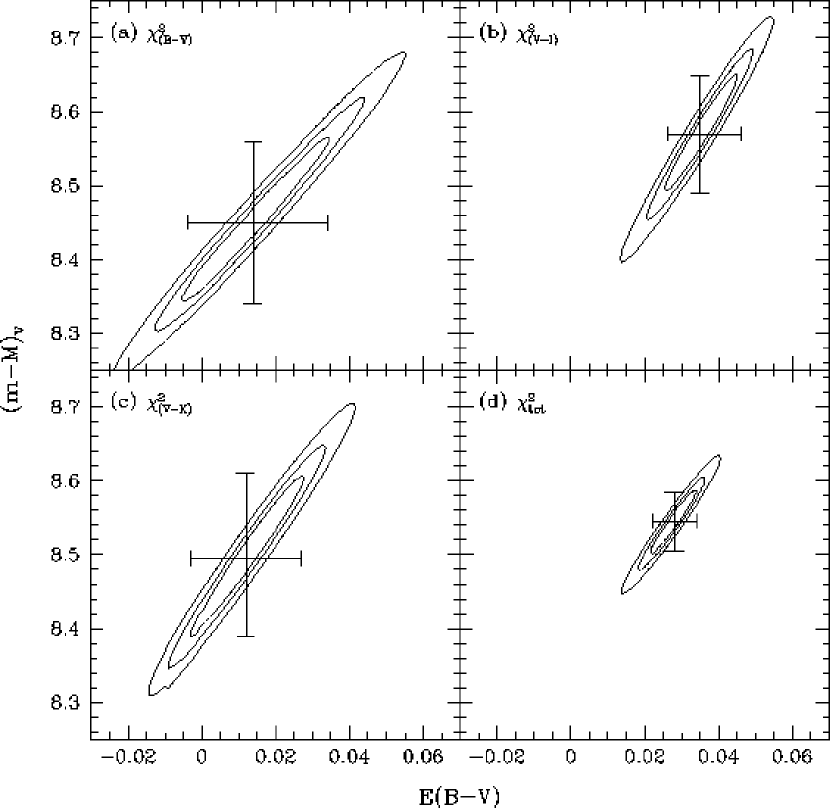
The distance and reddening for NGC 3532 are derived simultaneously by fitting the main sequence fiducial for the cluster, derived in Section 3.3, to a sample of unevolved Hyades members (i.e., stars having , , and ). This technique is akin to the one described by Richer et al. (1997) in their derivation of the distance and reddening to the globular cluster M 4. To account for the metallicity difference between NGC 3532 ([Fe/H]=) and the Hyades ([Fe/H=; Paulson et al., 2003), we adjust the colors of the cluster fiducial redward by , , and . The goodness of fit contours are shown in Figure 15 from separately fitting our NGC 3532 fiducial to the empirical Hyades main sequence on the , , and planes (i.e., , , and , respectively). The lower right-hand panel of the same figure shows the combination of values resulting from all 3 fits (). The contours in each panel designate the 68.3%, 95.4%, and 99.7% (1, 2, and 3) confidence levels of our fits based on 2 free parameters while the error bars correspond to the uncertainties in distance and reddening when each parameter is considered separately.
Clearly, the combination of fits involving all 3 color indices yields much tighter constraints on the cluster distance and reddening. The parameters that minimize the distribution shown in the lower right-hand panel of Figure 15 occur at and . This translates to , , and when using the reddening coefficients for different bandpasses given by Schlegel et al. (1998) assuming a reddening law. These values are in superb agreement with most of the modern distance and reddening estimates listed in Table 6 for NGC 3532 that use photometry for their derivations. Moreover, our estimated distance modulus is consistent with those derived from parallaxes to within 2 sigma.
4.3 Upper Main Sequence, Giant Stars, and Age
With the good constraints on the distance and reddening for NGC 3532, we can now use theoretical models to estimate the age of the cluster. Generally, this method involves determining which isochrone model of an appropriate metallicity best reproduces both the shape of the cluster turnoff as well as the luminosity of the red giant stars. In practice, this method seems simple, but in reality the reliable modeling of main sequence and giant stars, particularly for a cluster seemingly as young as NGC 3532, is sometimes problematic due to various physics involved in computing the theoretical models for the different types of stars.
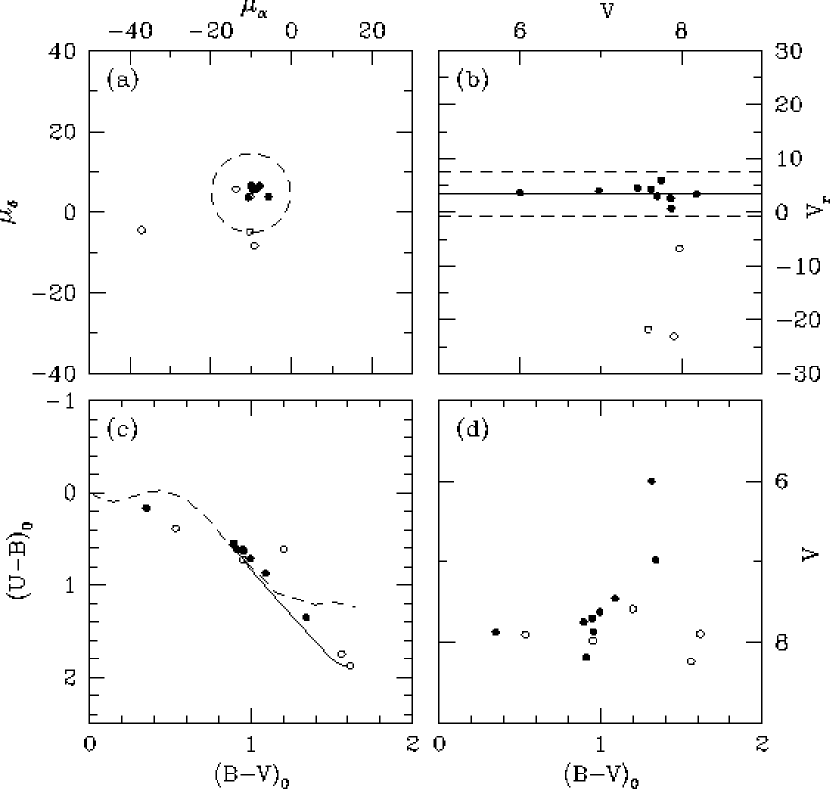
Our CMDs for NGC 3532 in Figure 6 show the cluster has a well populated turnoff region, but only a handful of giant stars. In addition, the fact that the cluster is situated in a region of high field star density means that some of the assumed red giant stars in the upper right portion of the CMDs may not belong to the cluster at all. For this reason, we have isolated a sample of candidate red giants from the cluster CMDs for further analysis. Assuming the cluster giants have and , we find that 14 stars from our database meet these criteria. The photometric, astrometric, and kinematic properties of these 14 candidate giant stars are listed in Table 7. The information presented in this table is meant to include or exclude these stars as bona fide members of the cluster based on their observed properties. We also include photometry in the table from FS80. In addition, the proper motion information was extracted from the Tycho-2 catalog (Høg et al., 2000) with radial velocities from González & Lapasset (2002) and Mermilliod et al. (2008).
In Figure 16 we provide several different plots illustrating our membership selection criteria. In the top two panels we use the kinematic information from Table 7 to isolate members from non-members. Specifically, we consider a star to be a member of NGC 3532 if its proper motion is within a radius of 10 mas yr-1 from the cluster mean (van Leeuwen, 2009) and it has a radial velocity within km s-1 of the mean of km s-1 (González & Lapasset, 2002). Based on the color-color diagram and CMD in the lower panels of Figure 16, it would appear that the stars we have excluded based on their kinematic properties alone correspond mostly to those that lie far from the primary cluster sequences. As a result of this exercise, we conclude that 9 of the 14 stars in the giant region of the CMD are actual cluster members.
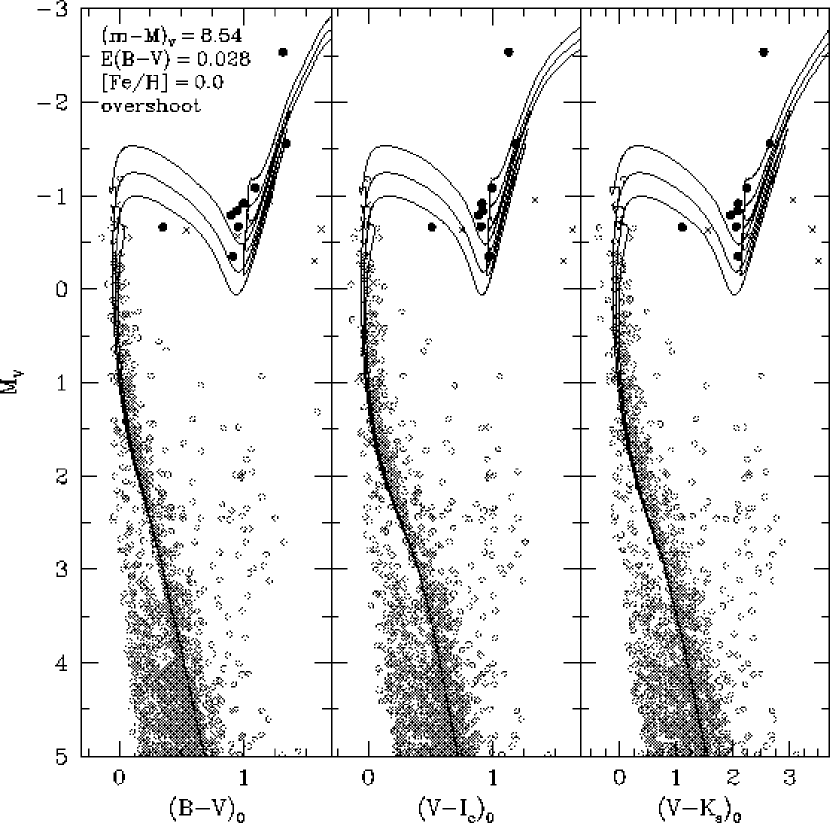
With a sample of giant stars that are legitimate members of the cluster, we can now move to fitting model isochrones to the photometry for NGC 3532 to derive its age. For this purpose, we employ the latest BaSTI stellar evolutionary models (Pietrinferni et al., 2004) for two reasons. First, they are among the most current available in terms of input physics and color-temperature relations and offer models that include convective core overshooting. Secondly, the BaSTI models treat all evolutionary phases, including white dwarf cooling sequences (Salaris et al., 2010); this fact proves advantageous in the next section when we will compare such models to the observed properties of white dwarfs in NGC 3532.
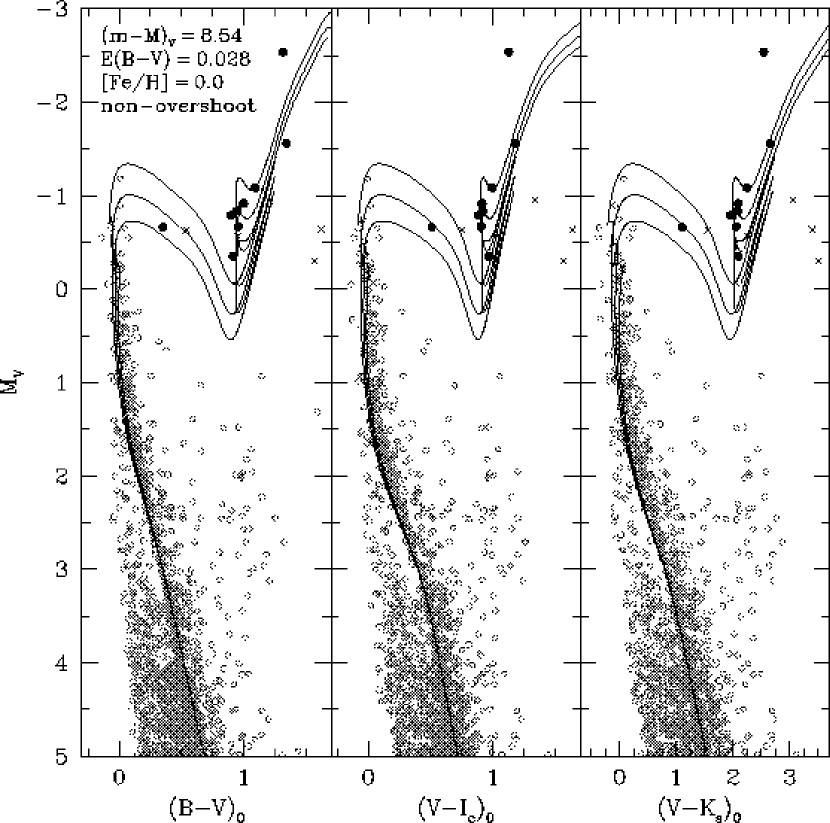
Based on the results presented in previous sections, we have chosen to fix the parameters for NGC 3532 at , , and [Fe/H]=0.0 and explore which isochrones from the BaSTI library provide the best fit to the turnoff. In Figures 17 and 18 we compare such isochrone models, both with and without treatment of convective core overshooting, to the observed CMDs for the cluster. For the CMD we have transformed the colors of the BaSTI isochrones to the 2MASS system using the relations of Carpenter (2001). The overshooting models with ages of 250, 300, and 350 Myr shown in Figure 17 appear to fit the turnoff and upper main sequence of the cluster quite nicely, but they tend to lie systematically redward of the giant stars (filled circles). The non-overshooting models in Figure 18 with ages of 200, 250, and 250 Myr, on the other hand, arguably do a better job of matching the colors of the giant stars, but they lie consistently on the blueward side of the main sequence for in all three CMDs. Moreover, although not shown here, we have employed the isochrones of Girardi et al. (2002) to fit the observed CMDs and discovered that they provide virtually the same interpretation of the data as the BaSTI models.
Given that the location and shape of the giant branch is greatly influenced by the adopted convective mixing length in the model computations and color transformations, we are inclined to favor a cluster age that is derived mainly from fitting the upper main sequence and turnoff. Therefore, since the overshooting isochrone provides a better fit to the CMDs in these regions, we estimate the age of NGC 3532 to be Myr.
4.4 White Dwarfs
The existence of white dwarfs in NGC 3532 has been known for quite some time. In their systematic search for white dwarf stars in young open clusters, Reimers & Koester (1989) used deep photographic observations of the cluster to identify 7 objects as candidate white dwarfs. Subsequent spectroscopic followup of these objects revealed 3 of them to be legitimate white dwarfs belonging to the cluster. Spurred by the surprising lack of cluster white dwarfs in their initial study, Koester & Reimers (1993) revisited their search by enlarging the observed area around NGC 3532. Indeed, they identified 3 additional objects as cluster white dwarfs, thus bringing the total number to 6.
More recently, Dobbie et al. (2009) presented a thorough analysis of these 6 known white dwarfs using low-resolution, high signal-to-noise spectroscopy. Their observations allowed them to derive precise temperature and surface gravity estimates by fitting spectral models to the observed Balmer line profiles. Moreover, their inclusion of -band photometry of the cluster field, extending to , permitted a reevaluation of membership and lead to the conclusion that only four of the six white dwarfs discovered by Reimers & Koester (1989) and Koester & Reimers (1993) have distance moduli comparable to the cluster itself. Furthermore, Dobbie (2010) has identified, via spectroscopy, 3 more faint blue objects as possible white dwarfs that may belong to the cluster.
Given that our CMD for NGC 3532 in Figure 6 shows an abundance of objects at the faint blue end, it is worthwhile investigating the possibility that a large number of these may be white dwarf members of the cluster. Such an analysis will be beneficial for two reasons. First, increasing the number of known white dwarf stars in open clusters places tighter constraints not only on the masses of their progenitor stars, but also on the initial-final mass relationship. Secondly, the comparison of the location of these stars in the CMD with white dwarf cooling models allows us to derive a cluster age that is free from uncertainties in the treatment of convective core overshooting. Age estimates such as this have only been possible recently with the use of wide field observations obtained on large aperture telescopes that are able to extend faint enough to reach the end of the white dwarf cooling sequence in nearby open clusters (see, for example, the works of Kalirai 2001a, 2001b).
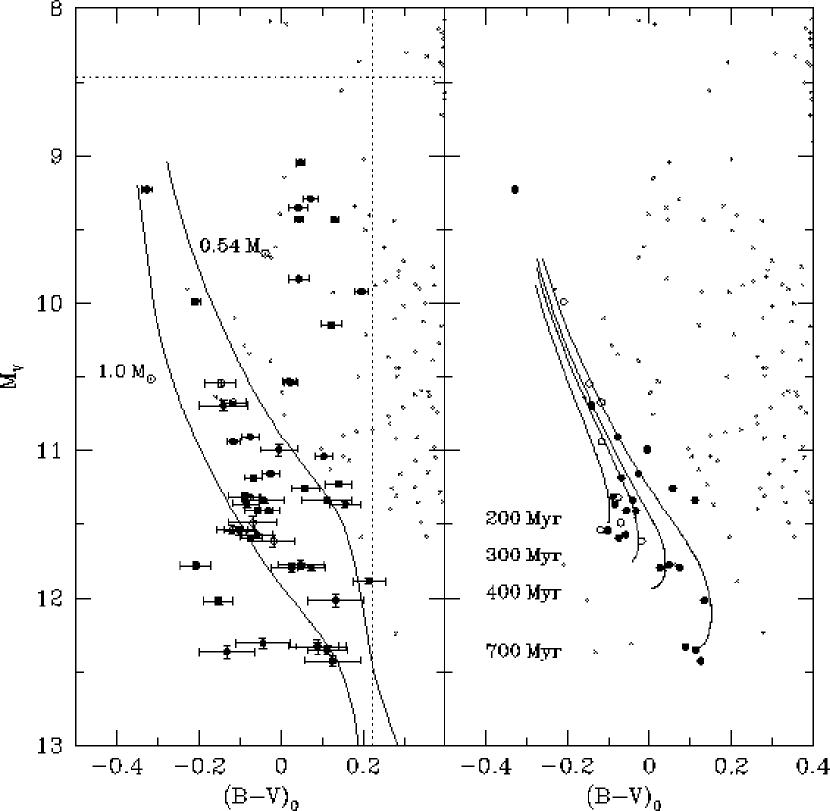
In Figure 19 we present an enlarged portion of the cluster CMD centered on the region where white dwarfs should reside. To single out potential cluster members, we begin by considering only those objects having and . As shown in the figure (denoted by dotted vertical and horizontal lines once reddening and distance have been accounted for), these limits exclude the vast majority of the field dwarf stars that contaminate the CMD below the cluster main sequence. These criteria leave us with 78 objects that have photometry of reasonably high precision (i.e., assuming the limits of ). Upon visually inspecting these candidates in the cluster finding chart (c.f., Figure 1), we can immediately exclude 28 of them as false detections due to their close proximity to much brighter stars, diffraction spikes, or known defects in the CCD.
The remaining 50 objects are shown in the left-hand panel of Figure 19 as either filled or open circles with error bars denoting their photometric uncertainties. Note the prominent clump of objects lying at and in the figure. To help us further isolate more of these objects as potential cluster white dwarfs, we overplot the BaSTI cooling models for and (Salaris et al., 2010) in the figure and exclude stars that lie outside of the region they bracket. These 32 remaining stars are shown in the right-hand panel of Figure 19 with filled circles denoting stars that have high probability of being new cluster white dwarfs while open circles shown the location of known white dwarfs in the cluster field from previous studies (Reimers & Koester, 1989; Koester & Reimers, 1993; Dobbie, 2010). Also plotted in this panel are the BaSTI white dwarf isochrones for 200, 300, 400, and 700 Myr. Clearly, the three youngest isochrones terminate at absolute magnitudes comparable to the faintest members of the clump. The 700 Myr isochrone, on the other hand, does terminate at the location of the faintest candidates in our sample, but the bright end of the same isochrone extends too far to the red from the known white dwarfs in the cluster for us to accept such a high age.
Based upon our photometric uncertainties at the faint end (approaching mag for stars as faint as ), together with the uncertainty in our derived cluster distance modulus, we can deduce that the white dwarf cooling age for the cluster is somewhere between 200 and 400 Myr. Note that this age range corresponds nicely to the age derived when fitting the cluster turnoff when using either the overshooting or non-overshooting models. However, the quality of our photometry, combined with the paucity of white dwarfs in the faint, blue region of the NGC 3532 CMD, prevents us from placing tighter constraints on the cluster’s age using this technique. Undoubtedly, it would prove useful to obtain high-quality spectroscopic observations of our white dwarf candidates to better locate the termination of the white dwarf cooling sequence.
4.5 Binary Stars
The impact of unresolved binary stars on a cluster CMD is commonly seen as the broadening of the main sequence towards brighter magnitudes. Indeed, it is well known that clusters containing a large number of equal-mass binary systems exhibit a secondary main sequence displaced by as much as mag relative to the single-star main sequence (see, for example, the CMDs for M 67 in Montgomery et al. 1993).
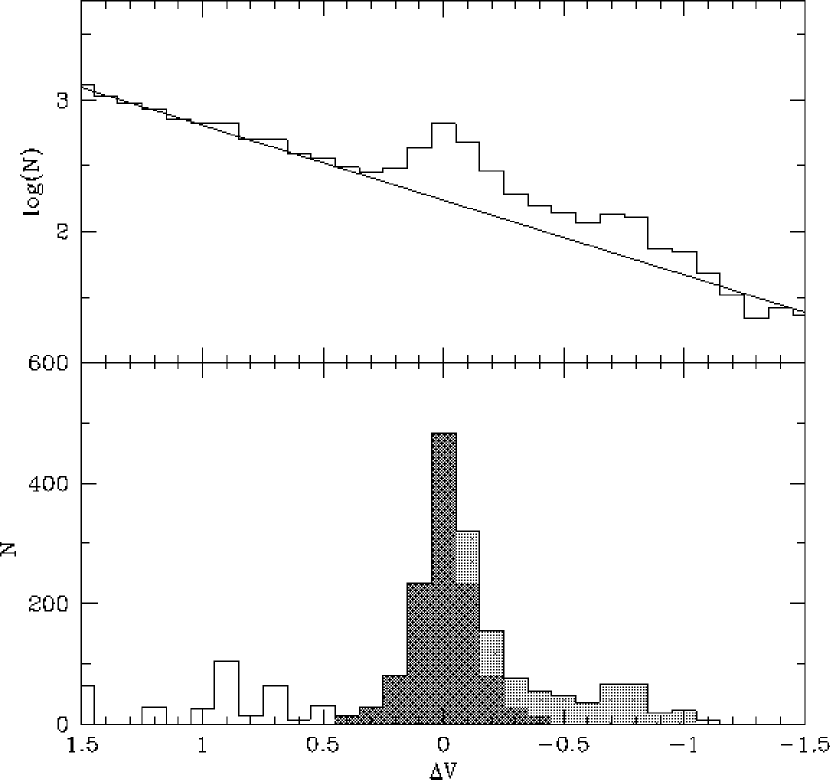
The existence of binary stars in NGC 3532 is most clearly evident in Figure 12 as a scattering of dots lying parallel to the cluster main sequence in our CMDs. To determine the approximate binary fraction for NGC 3532 we begin by taking the difference in magnitude () between our derived fiducial sequence and the individual stars within the range of . The resulting histogram of the number of stars as a function of is shown in the upper panel of Figure 20. While the peak located at corresponds to the single stars in NGC 3532, the binary population easily reveals itself as the excess in the distribution towards brighter magnitudes with the secondary peak at caused by a small number of equal mass systems. Before we can derive a robust estimate for the binary fraction, however, we must compensate for the field star contribution to the histogram. This has been done by fitting a linear relationship to the distribution of bins outside the area occupied by singles and binaries (specifically, ). Once the field star contribution is removed, the resulting histogram, shown in the lower panel of Figure 20, be a reasonable representation of both the single and binary star population in NGC 3532.
Assuming that the distribution of single stars approximates a Gaussian, we have simply reflected the bins at about the axis to obtain the dark gray area denoted in the lower panel. The remaining objects situated between 0.0 and in (denoted by the light gray shaded area) should, therefore, approximate the number of binaries in the cluster. The resulting binary fraction can be obtained by simply summing the area indicated by the light gray region of the plot (447 stars) and dividing by the total area below the histogram between (1641 stars). Based on this technique, our computed binary fraction for NGC 3532 is therefore , where the error represents a combination of Poisson statistics and uncertainties associated with the removal of the field star distribution. Due to the fact, however, that a number of spectroscopic binaries show no appreciable brightening relative to the single-star main sequence (see, for example, the HR diagram for the Hyades in Fig. 20 of Perryman et al., 1998), our derived binary frequency for NGC 3532 should be treated as a lower limit.
4.6 Luminosity and Mass Functions
The unprecedented depth and spatial coverage of our NGC 3532 photometry motivates us to investigate the cluster’s dynamical state via its luminosity and mass functions (LF and MF, respectively). The sample of objects considered for this endeavor is based on the collection of cluster stars that have been isolated from the field population using the photometric filtering technique described in Section 3.3. Constructing the LF for NGC 3532 is simply a matter of counting the number of main sequence stars that lie within the range of using a bin size of 1 mag. To account for incompleteness in the photometry toward fainter magnitudes, we have added stars to the original CCD images in an attempt to recover them using our reduction techniques. Briefly, these artificial stars were added uniformly over several trials to the short- and long-exposure -band images for fields 1, 5, 13, 20, and 25 (see Figure 1). The final completeness corrections to our luminosity function represents a combination of the results from these trials for all 5 fields. The results of this exercise imply that our photometry remains complete at the bright end (i.e., ) and complete for magnitudes as faint as . Note that we also estimate uncertainties in these completeness corrections using the techniques described in Bolte (1989).
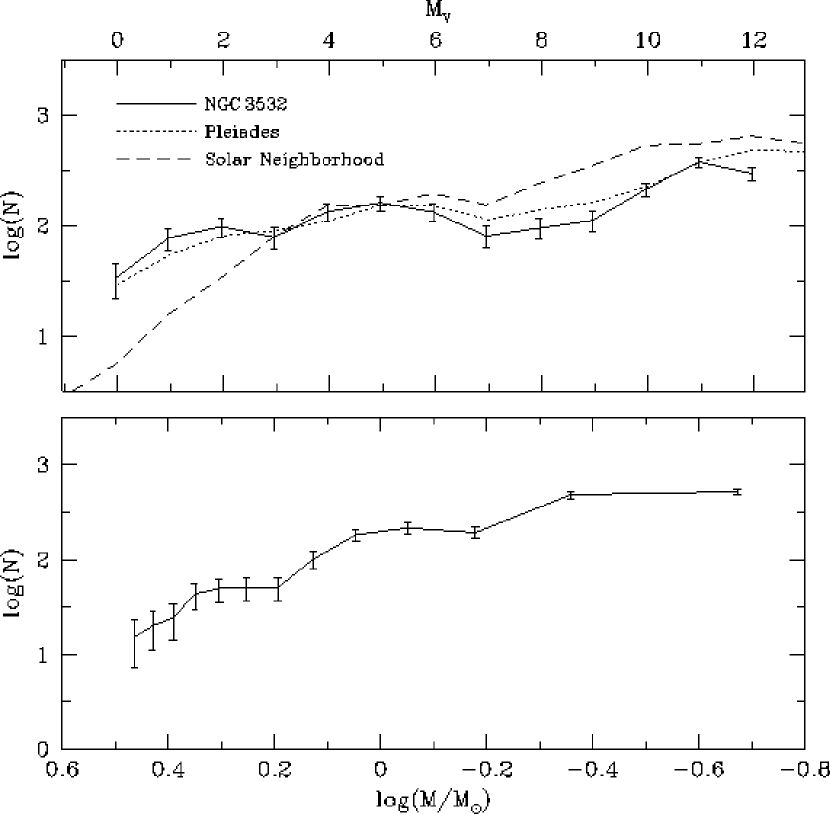
The final, incompleteness-corrected LF for the cluster is shown in the top panel of Figure 21 as a solid line. The error bars for denote a combination of uncertainties arising from simple counting statistics and the errors in the completeness corrections. Note that the LF for NGC 3532 exhibits a small “bump” around where there is a slight overabundance of stars compared to adjacent magnitudes. This feature may be due to an imperfect removal of field stars from our photometric filtering technique. Indeed, inspection of the CMDs shown in Figure 12 reveals that the field disk population crosses over the cluster main sequence within this magnitude range. We argue, however, that the bump is largely a real feature of the LF and that the decrease in the number of stars in the magnitude bin corresponds to the so-called “Wielen dip.” This same type of depression, which has been attributed to a change in the slope of the mass-luminosity relation for stars in this magnitude range, can also be seen in the LFs for stars in the solar neighborhood (Wielen, 1974; Wielen et al., 1983; Reid et al., 2002) and other open clusters such as the Pleiades (Lee & Sung, 1995) and Praesepe (Hambly et al., 1995). To better illustrate this, as well as compare our NGC 3532 LF to other stellar populations, we have overplotted the LFs for the Pleiades (Lee & Sung, 1995) and the solar neighborhood (Reid et al., 2002) in the top panel of Figure 21 as dotted and dashed lines, respectively.
Upon integrating the LF and accounting for the handful of giant and white dwarf stars in the cluster, we obtain a cluster population of stars. However, this estimate is predominately based on single stars and does not include the sizable population of binary stars () that we estimate in Section 4.5. Thus, if we account for binary systems, the total population of stars in NGC 3532 rises to .
The MF for NGC 3532 can be derived by using the slope of the mass-luminosity relation predicted from the same 300 Myr overshooting isochrone employed in Section 4.3 to fit the cluster’s main sequence. The result is shown in the bottom panel of Figure 21 and covers a range in mass from (the limit of our photometry) to (the main-sequence turnoff). The best-fit slope we derive for this mass range is , which corresponds quite closely to that for the solar neighborhood ( Salpeter, 1955). We argue, however, that the actual MF for NGC 3532 should be better described by a broken power law with a much shallower slope at the low-mass end (i.e. ) and a steeper slope for more massive stars. Assuming this is the case, we find the best-fit values to be and for the low- and high-mass stars, respectively. Such a drastic change in slope at the two mass extremes is likely indicative of a mass segregation effect within the cluster. We note, however, that the lowest mass bins of the MF show a very flat distribution. Part of this may be due to the fact that we were forced to extrapolate the BaSTI isochrone beyond its lowest tabulated mass () for these two bins. Moreover, the bolometric corrections used to translate the isochrone luminosity to could be in error by as much as 0.5 mag for such low-mass stars. The combination of these two effects lead us to doubt the reliability of the MF at the extreme low-mass end.
5 Summary
In this investigation we have presented the results of a large, accurate, and homogeneous photometric survey of the open cluster NGC 3532 covering approximately one square degree on the sky. Due to its location near the Galactic plane, the resulting CMDs revealed the presence of a large number of field stars that virtually masked the cluster’s lower main sequence. Thanks to a merger of infrared photometry from the 2MASS catalog with our data set, we have been able to isolate a well-populated cluster main sequence that extends as faint as . Moreover, our photometric filtering technique has allowed us to further separate out cluster members from the field star population to permit an accurate determination of the cluster’s distance and reddening. Our findings support previous evidence that the cluster is fairly nearby ( pc) and exhibits a remarkably low reddening [] despite its location in the disk. Moreover, a robust estimate of the cluster’s age ( Myr) has been derived by fitting the latest BaSTI model isochrones to the well-populated upper main sequence.
The depth of our photometry has permitted the discovery of a number of new objects in the faint, blue region of the CMD, the majority of which we believe to belong to the cluster’s white dwarf sequence. This belief is confirmed by the photometric recovery of eight previously known white dwarf stars that were discovered spectroscopically by Reimers & Koester (1989); Koester & Reimers (1993); Dobbie (2010). Moreover, a noticeable drop in the number of white dwarfs beyond lead us to assume that our photometry has extended faint enough to probe the termination of the white dwarf cooling sequence. While confirmation of this would require additional deeper photometric observations together with spectroscopic followup, the age of Myr we derive by fitting this termination point agrees quite well with that obtained from analyzing the turnoff region.
We have also made a preliminary investigation of the luminosity function, mass function, and binarity of the stellar population contained within NGC 3532. Based on our analysis of the luminosity function for NGC 3532, we find a decrease in the number of stars at . This effect, known as the “Wielen dip”, can also be seen in the luminosity functions for stars both in the field, as well as other open clusters such as Praesepe and the Pleiades. The total number of stars in NGC 3532, as derived by integrating the luminosity function, has been determined to be around 1900, but we note that our estimate does not include a sizable number of binary stars that comprises approximately of the total cluster population. While the cluster’s overall mass function is best fit with a power law that has a slope close to the Salpeter value (), we argue that it is better represented by two separate slopes for the high and low star stars. Based on this argument, we find that stars with masses less than have a much shallower slope than the Salpeter value, which would imply that our observations do not cover the full extent of the cluster, or a number of low mass members have evaporated from the cluster due to the effects of mass segregation.
References
- An et al. (2007) An, D., Terndrup, D. M., Pinsonneault, M. H., Paulson, D. B., Hanson, R. B., & Stauffer, J. R. 2007, ApJ, 655, 233
- Bessell & Brett (1988) Bessell, M. S., & Brett, J. M. 1988, PASP, 100, 1134
- Bolte (1989) Bolte, M. 1989, ApJ, 341, 168
- Bonifacio et al. (2000) Bonifacio, P., Caffau, E., & Molaro, P. 2000, A&AS, 145, 473
- Butler (1977) Butler, C. J. 1977, MNRAS, 178, 159 (B77)
- Carpenter (2001) Carpenter, J. M. 2001, AJ, 121, 2851
- Claria & Lapasset (1988) Claria, J. J., & Lapasset, E. 1988, MNRAS, 235, 1129 (CL88)
- Claria & Minniti (1988) Claria, J. J., & Minniti, D. 1988, The Observatory, 108, 218
- Crawford (1975) Crawford, D. L. 1975, AJ, 80, 955
- de Bruijne et al. (2001) de Bruijne, J. H. J., Hoogerwerf, R., & de Zeeuw, P. T. 2001, A&A, 367, 111
- Dobbie et al. (2009) Dobbie, P. D., Napiwotzki, R., Burleigh, M. R., Williams, K. A., Sharp, R., Barstow, M. A., Casewell, S. L., & Hubeny, I. 2009, MNRAS, 395, 2248
- Dobbie (2010) Dobbie, P. D., 2010, private communication
- Eggen (1981) Eggen, O. J. 1981, ApJ, 246, 817
- Fernandez & Salgado (1980) Fernandez, J. A., & Salgado, C. W. 1980, A&AS, 39, 11 (FS80)
- Girardi et al. (2002) Girardi, L., Bertelli, G., Bressan, A., Chiosi, C., Groenewegen, M. A. T., Marigo, P., Salasnich, B., & Weiss, A. 2002, A&A, 391, 195
- González & Lapasset (2002) González, J. F., & Lapasset, E. 2002, AJ, 123, 3318
- Gratton (2000) Gratton, R. 2000, Stellar Clusters and Associations: Convection, Rotation, and Dynamos, Proceedings from ASP Conference, Vol. 198, p. 225
- Hambly et al. (1995) Hambly, N. C., Steele, I. A., Hawkins, M. R. S., & Jameson, R. F. 1995, MNRAS, 273, 505
- Høg et al. (2000) Høg, E., et al. 2000, A&A, 355, L27
- Johansson (1981) Johansson, K. L. V. 1981, A&AS, 43, 421 (J81)
- Joner et al. (2006) Joner, M. D., Taylor, B. J., Laney, C. D., & van Wyk, F. 2006, AJ, 132, 111
- Kalirai et al. (2001a) Kalirai, J. S., et al. 2001a, AJ, 122, 266
- Kalirai et al. (2001b) Kalirai, J. S., et al. 2001b, AJ, 122, 3239
- Kharchenko et al. (2005) Kharchenko, N. V., Piskunov, A. E., Röser, S., Schilbach, E., & Scholz, R.-D. 2005, A&A, 438, 1163
- Koelbloed (1959) Koelbloed, D. 1959, Bull. Astron. Inst. Netherlands, 14, 265 (K59)
- Koester & Reimers (1993) Koester, D., & Reimers, D. 1993, A&A, 275, 479
- Landolt (1992) Landolt, A. U. 1992, AJ, 104, 340
- Landolt (2009) Landolt, A. U. 2009, AJ, 137, 4186
- Lee & Sung (1995) Lee, S.-W., & Sung, H. 1995, Journal of Korean Astronomical Society, 28, 45
- Loktin et al. (2001) Loktin, A. V., Gerasimenko, T. P., & Malysheva, L. K. 2001, Astronomical and Astrophysical Transactions, 20, 607
- Luck (1994) Luck, R. E. 1994, ApJS, 91, 309
- Malysheva (1997) Malysheva, L. K. 1997, Astronomy Letters, 23, 585
- Martin (1933) Martin, W. C. 1933, Bull. Astron. Inst. Netherlands, 7, 61
- Mermilliod et al. (2008) Mermilliod, J. C., Mayor, M., & Udry, S. 2008, A&A, 485, 303
- Meynet et al. (1993) Meynet, G., Mermilliod, J. C., & Maeder, A. 1993, A&AS, 98, 477
- Montgomery et al. (1993) Montgomery, K. A., Marschall, L. A., & Janes, K. A. 1993, AJ, 106, 181
- Paulson et al. (2003) Paulson, D. B., Sneden, C., & Cochran, W. D. 2003, AJ, 125, 3185
- Perryman et al. (1998) Perryman, M. A. C., et al. 1998, A&A, 331, 81
- Piatti et al. (1995) Piatti, A. E., Claria, J. J., & Abadi, M. G. 1995, AJ, 110, 2813
- Pietrinferni et al. (2004) Pietrinferni, A., Cassisi, S., Salaris, M., & Castelli, F. 2004, ApJ, 612, 168
- Pinsonneault et al. (2004) Pinsonneault, M. H., Terndrup, D. M., Hanson, R. B., & Stauffer, J. R. 2004, ApJ, 600, 946
- Reid et al. (2002) Reid, I. N., Gizis, J. E., & Hawley, S. L. 2002, AJ, 124, 2721
- Reimers & Koester (1989) Reimers, D., & Koester, D. 1989, A&A, 218, 118
- Richer et al. (1997) Richer, H. B., et al. 1997, ApJ, 484, 741
- Rieke (1937) Rieke, C. A. 1937, Harvard College Observatory Bulletin, 906, 9
- Robichon et al. (1999) Robichon, N., Arenou, F., Mermilliod, J.-C., & Turon, C. 1999, A&A, 345, 471
- Rufener (1988) Rufener, F. 1988, Sauverny: Observatoire de Geneve, 1988
- Salaris et al. (2010) Salaris, M., Cassisi, S., Pietrinferni, A., Kowalski, P. M., & Isern, J. 2010, ApJ, 716, 1241
- Salpeter (1955) Salpeter, E. E. 1955, ApJ, 121, 161
- Sarajedini et al. (2004) Sarajedini, A., Brandt, K., Grocholski, A. J., & Tiede, G. P. 2004, AJ, 127, 991
- Schlegel et al. (1998) Schlegel, D. J., Finkbeiner, D. P., & Davis, M. 1998, ApJ, 500, 525
- Schneider (1987) Schneider, H. 1987, A&AS, 71, 147
- Stetson (1987) Stetson, P. B. 1987, PASP, 99, 191
- Stetson (1990) Stetson, P. B. 1990, PASP, 102, 932
- Stetson (1994) Stetson, P. B. 1994, PASP, 106, 250
- Stetson & Harris (1988) Stetson, P. B., & Harris, W. E. 1988, AJ, 96, 909
- Stetson et al. (2003) Stetson, P. B., Bruntt, H., & Grundahl, F. 2003, PASP, 115, 413
- Taylor & Joner (2005) Taylor, B. J., & Joner, M. D. 2005, ApJS, 159, 100
- Trumpler (1930) Trumpler, R. J. 1930, Lick Observatory Bulletin, 14, 154
- Twarog et al. (1997) Twarog, B. A., Ashman, K. M., & Anthony-Twarog, B. J. 1997, AJ, 114, 2556
- Wallenquist (1931) Wallenquist, Å. 1931, Annals of the Bosscha Observatory Lembang (Java) Indonesia, 3, 1
- Wielen (1974) Wielen, R. 1974, Highlights of Astronomy, 3, 395
- Wielen et al. (1983) Wielen, R., Jahreiß, H., & Krüger, R. 1983, IAU Colloq. 76: Nearby Stars and the Stellar Luminosity Function, 163
- Wizinowich & Garrison (1982) Wizinowich, P., & Garrison, R. F. 1982, AJ, 87, 1390 (WG82)
- van Leeuwen (2009) van Leeuwen, F. 2009, A&A, 497, 209
- Zacharias et al. (2010) Zacharias, N., et al. 2010, AJ, 139, 2184
| UT Date | Standards? | Number of Frames | Fields Observed | |||
|---|---|---|---|---|---|---|
| (yymmdd) | ||||||
| 000201 | Y | 0 | 12 | 0 | 0 | 26, 27, 28 |
| 000208 | N | 0 | 12 | 0 | 0 | 26, 27, 28 |
| 000219 | Y | 0 | 12 | 0 | 0 | 26, 27, 28 |
| 000224 | N | 0 | 12 | 0 | 0 | 26, 27, 28 |
| 000225 | N | 0 | 225 | 0 | 0 | 1-25 |
| 000226 | Y | 25 | 95 | 25 | 25 | 6-9, 11-25 |
| 000227 | N | 0 | 105 | 0 | 0 | 1-5, 10-13, 16-25 |
| 000228 | Y | 45 | 45 | 45 | 45 | 16-19, 21-25 |
| 000229 | Y | 45 | 45 | 45 | 45 | 1-3, 10-14, 20 |
| 000301 | Y | 35 | 50 | 35 | 35 | 1,2, 4-10, 15 |
| 000317 | N | 0 | 225 | 0 | 0 | 1-25 |
| 000318 | N | 0 | 200 | 0 | 0 | 1-25 |
| 000319 | N | 0 | 175 | 0 | 0 | 1-25 |
| 000320 | N | 0 | 200 | 0 | 0 | 1-25 |
| 000321 | N | 0 | 210 | 0 | 0 | 1-25 |
| 000322 | N | 0 | 12 | 0 | 0 | 26, 27, 28 |
| 000323 | N | 0 | 12 | 0 | 0 | 26, 27, 28 |
| 000420 | N | 0 | 15 | 0 | 0 | 26, 27, 28 |
| 000422 | N | 0 | 15 | 0 | 0 | 26, 27, 28 |
| 000426 | N | 0 | 15 | 0 | 0 | 26, 27, 28 |
| 000616 | N | 0 | 14 | 0 | 0 | 26, 27, 28 |
| 000713 | N | 0 | 15 | 0 | 0 | 26, 27, 28 |
| ID | RA | Dec | ||||||||||||||||
|---|---|---|---|---|---|---|---|---|---|---|---|---|---|---|---|---|---|---|
| (1) | (2) | (3) | (4) | (5) | (6) | (7) | (8) | (9) | (10) | (11) | (12) | (13) | (14) | (15) | (16) | (17) | (18) | (19) |
| 1 | 7895.5 | 7082.3 | 19.602 | 0.0550 | 3 | 18.669 | 0.0177 | 4 | 18.085 | 0.0225 | 4 | 17.404 | 0.0183 | 4 | 0.773 | 0.195 | 11:09:42.97 | 58:14:02.1 |
| 2 | 7895.1 | 6996.8 | 16.313 | 0.0281 | 4 | 15.893 | 0.0056 | 4 | 15.611 | 0.0073 | 4 | 15.216 | 0.0086 | 5 | 1.303 | 0.058 | 11:09:43.00 | 58:14:23.5 |
| 3 | 7893.8 | 7149.5 | 17.600 | 0.0211 | 4 | 16.253 | 0.0059 | 5 | 15.515 | 0.0054 | 5 | 14.785 | 0.0076 | 5 | 1.328 | 0.026 | 11:09:42.88 | 58:13:45.3 |
| 4 | 7893.4 | 7376.1 | 20.139 | 0.0298 | 3 | 19.106 | 0.0177 | 4 | 18.436 | 0.0135 | 4 | 17.728 | 0.0144 | 5 | 0.642 | 0.152 | 11:09:42.76 | 58:12:48.7 |
| 5 | 7892.6 | 7238.9 | 20.950 | 0.1233 | 3 | 20.050 | 0.0386 | 4 | 19.425 | 0.0252 | 3 | 18.677 | 0.0560 | 4 | 0.537 | 0.293 | 11:09:42.80 | 58:13:23.0 |
| 6 | 7892.1 | 6776.5 | 17.645 | 0.0102 | 4 | 16.681 | 0.0054 | 5 | 16.163 | 0.0118 | 5 | 15.597 | 0.0059 | 5 | 0.925 | 0.004 | 11:09:43.01 | 58:15:18.6 |
| 7 | 7891.7 | 6831.0 | 20.455 | 0.0531 | 3 | 19.329 | 0.0184 | 3 | 18.699 | 0.0122 | 4 | 18.078 | 0.0194 | 4 | 0.578 | 0.027 | 11:09:42.97 | 58:15:04.9 |
| 8 | 7890.9 | 7415.1 | 20.278 | 0.0650 | 3 | 19.323 | 0.0207 | 4 | 18.776 | 0.0159 | 4 | 18.144 | 0.0235 | 4 | 0.538 | 0.003 | 11:09:42.66 | 58:12:38.9 |
| 9 | 7890.7 | 7310.9 | 20.457 | 0.0689 | 3 | 19.186 | 0.0156 | 4 | 18.410 | 0.0094 | 4 | 17.626 | 0.0143 | 4 | 0.576 | 0.074 | 11:09:42.70 | 58:13:05.0 |
| 10 | 7890.4 | 6529.6 | 19.036 | 0.0263 | 3 | 17.495 | 0.0041 | 4 | 16.665 | 0.0056 | 5 | 15.870 | 0.0118 | 5 | 0.721 | 0.014 | 11:09:43.08 | 58:16:20.3 |
| WEBDA | ID | RA | Dec | ||||||||||||||
|---|---|---|---|---|---|---|---|---|---|---|---|---|---|---|---|---|---|
| 649 | 294887 | 11:02:25.10 | -58:45:37.4 | 8.960 | 0.0062 | 5 | 7.978 | 0.0108 | 7 | 7.395 | 0.0366 | 3 | 6.906 | 0.0093 | 3 | 3.684 | -0.007 |
| 726 | 286900 | 11:02:41.85 | -58:58:03.3 | 18.487 | 0.0101 | 4 | 17.559 | 0.0037 | 10 | 16.975 | 0.0036 | 5 | 16.389 | 0.0086 | 5 | 0.576 | 0.008 |
| 725 | 283570 | 11:02:49.14 | -58:58:08.8 | 14.018 | 0.0053 | 5 | 12.129 | 0.0034 | 10 | 11.063 | 0.0087 | 5 | 10.010 | 0.0039 | 5 | 2.632 | -0.006 |
| 596 | 283467 | 11:02:50.60 | -58:42:07.1 | 8.854 | 0.0070 | 5 | 7.869 | 0.0079 | 6 | 7.360 | 0.0123 | 3 | 6.925 | 0.0120 | 3 | 4.344 | 0.120 |
| 728 | 280521 | 11:02:55.98 | -58:59:10.4 | 16.143 | 0.0034 | 5 | 15.512 | 0.0062 | 10 | 15.102 | 0.0066 | 5 | 14.691 | 0.0037 | 5 | 0.835 | -0.026 |
| 539 | 279539 | 11:02:58.45 | -58:57:24.8 | 11.698 | 0.0027 | 5 | 11.383 | 0.0050 | 10 | 11.173 | 0.0069 | 5 | 10.973 | 0.0036 | 5 | 2.085 | -0.013 |
| 727 | 277424 | 11:03:03.23 | -58:58:15.7 | 13.786 | 0.0024 | 5 | 13.471 | 0.0029 | 10 | 13.286 | 0.0053 | 5 | 13.092 | 0.0024 | 5 | 1.294 | -0.033 |
| 540 | 271164 | 11:03:16.18 | -58:59:55.8 | 10.559 | 0.0033 | 10 | 10.352 | 0.0052 | 20 | 10.236 | 0.0143 | 10 | 10.095 | 0.0049 | 10 | 4.626 | -0.009 |
| 713 | 267576 | 11:03:25.17 | -58:35:36.7 | 14.710 | 0.0054 | 5 | 13.949 | 0.0082 | 10 | 13.514 | 0.0091 | 5 | 13.104 | 0.0058 | 5 | 1.924 | 0.068 |
| 473 | 265155 | 11:03:29.22 | -58:47:08.6 | 9.607 | 0.0061 | 5 | 9.201 | 0.0089 | 9 | 8.938 | 0.0103 | 4 | 8.717 | 0.0053 | 5 | 5.370 | 0.138 |
| K59 | B77 | FS80 | J81 | WG82 | CL88 | |||||||||
|---|---|---|---|---|---|---|---|---|---|---|---|---|---|---|
| WEBDA | ||||||||||||||
| 649 | 8.01 | 1.00 | ||||||||||||
| 726 | 17.46 | 0.58 | ||||||||||||
| 725 | 12.15 | 1.76 | ||||||||||||
| 596 | 7.93 | 0.99 | ||||||||||||
| 728 | 15.54 | 0.84 | ||||||||||||
| 539 | 11.36 | 0.30 | ||||||||||||
| 727 | 13.36 | 0.34 | ||||||||||||
| 540 | 10.35 | 0.23 | ||||||||||||
| 713 | 13.93 | 0.81 | ||||||||||||
| 473 | 9.25 | 0.37 | 9.23 | 0.41 | ||||||||||
| Data Set | Index | Clipped Mean | ||
|---|---|---|---|---|
| Koelbloed (1959) | 80 | 2 | ||
| 77 | 2 | |||
| Butler (1977) () | 14 | 1 | ||
| 15 | 0 | |||
| Fernandez & Salgado (1980) | 173 | 7 | ||
| 173 | 3 | |||
| Johansson (1981) | 14 | 0 | ||
| 14 | 0 | |||
| Wizinowich & Garrison (1982) | 68 | 0 | ||
| 64 | 0 | |||
| 68 | 0 | |||
| 66 | 0 | |||
| Claria & Lapasset (1988) | 12 | 0 | ||
| 12 | 0 |
| Reference | Age (Myr) | [Fe/H] | Methods | ||
|---|---|---|---|---|---|
| Koelbloed (1959) | 100 | photometry | |||
| Fernandez & Salgado (1980) | 200 | photometry | |||
| Eggen (1981) | aaConverted from assuming | 350 | photometry | ||
| Johansson (1981) | 200 | photometry | |||
| Schneider (1987) | aafootnotemark: | photometry | |||
| Claria & Lapasset (1988) | photometry | ||||
| Meynet et al. (1993) | 316 | photometry | |||
| Luck (1994) | spectroscopy | ||||
| Piatti et al. (1995) | photometry | ||||
| Malysheva (1997) | aafootnotemark: | 229 | photometry | ||
| Twarog et al. (1997) | photometry | ||||
| Robichon et al. (1999) | Hipparcos parallax | ||||
| Gratton (2000) | spectroscopy | ||||
| Loktin et al. (2001) | 310 | photometry | |||
| Sarajedini et al. (2004) | photometry | ||||
| Kharchenko et al. (2005) | 282 | photometric/kinematic | |||
| van Leeuwen (2009) | Hipparcos parallax | ||||
| WEBDA | 310 | various | |||
| Current Study | 300 | photometry |
| WEBDA ID | ID | RA | Dec | Member? | |||||||||||
|---|---|---|---|---|---|---|---|---|---|---|---|---|---|---|---|
| 221 | 151415 | 11:06:29.29 | 58:40:30.1 | 6.001 | 1.346 | 1.167 | 2.712 | 9.7 | 1.3 | 5.8 | 1.3 | 3.58 | 0.12 | Y | |
| 670 | 79390 | 11:07:57.36 | 58:17:26.3 | 6.978 | 1.408 | 1.372 | 1.221 | 2.817 | 7.9 | 1.4 | 6.5 | 1.3 | 3.97 | 0.12 | Y |
| 100 | 170771 | 11:06:03.84 | 58:41:15.9 | 7.457 | 0.930 | 1.120 | 1.033 | 2.412 | 8.8 | 1.8 | 5.7 | 1.8 | 4.49 | 0.12 | Y |
| 522 | 241462 | 11:04:13.94 | 58:27:51.1 | 7.590 | 0.668 | 1.232 | 1.379 | 3.225 | 13.8 | 1.3 | 5.7 | 1.3 | 21.79 | 3.13 | N |
| 160 | 228568 | 11:04:35.96 | 58:45:20.9 | 7.624 | 0.770 | 1.027 | 0.952 | 2.257 | 8.6 | 1.4 | 5.8 | 1.4 | 4.27 | 0.05 | Y |
| 19 | 174489 | 11:05:58.74 | 58:43:29.4 | 7.702 | 0.670 | 0.975 | 0.955 | 2.243 | 10.8 | 2.4 | 3.6 | 2.2 | 2.94 | 0.14 | Y |
| 152 | 229744 | 11:04:33.84 | 58:41:39.4 | 7.751 | 0.600 | 0.925 | 0.923 | 2.123 | 9.9 | 1.3 | 6.7 | 1.5 | 5.89 | 0.07 | Y |
| 623 | 56698 | 11:08:28.81 | 58:53:19.6 | 7.876 | 0.220 | 0.380 | 0.550 | 1.275 | 5.7 | 1.5 | 3.8 | 1.5 | 0.70 | 0.40 | Y |
| 596 | 283467 | 11:02:50.60 | 58:42:07.1 | 7.869 | 0.686 | 0.985 | 0.944 | 2.220 | 9.2 | 1.8 | 5.5 | 1.9 | 2.50 | 0.13 | Y |
| 157 | 220113 | 11:04:50.13 | 58:43:03.6 | 7.901 | 1.930 | 1.647 | 1.676 | 3.564 | 9.1 | 1.7 | 8.3 | 1.7 | N | ||
| 273 | 241779 | 11:04:12.76 | 58:43:42.9 | 7.906 | 0.440 | 0.563 | 0.793 | 1.711 | 10.1 | 3.2 | 3.8 | 3.1 | 23.05 | 0.46 | N |
| 649 | 294887 | 11:02:25.10 | 58:45:37.4 | 7.978 | 0.777 | 0.982 | 1.072 | 2.429 | 37.1 | 1.8 | 4.5 | 1.5 | 6.76 | 0.13 | N |
| 122 | 183628 | 11:05:45.63 | 58:40:39.5 | 8.189 | 0.670 | 0.941 | 1.007 | 2.256 | 9.3 | 1.8 | 5.6 | 1.7 | 3.34 | 0.14 | Y |
| 236 | 140366 | 11:06:43.61 | 58:35:04.8 | 8.240 | 1.800 | 1.593 | 1.604 | 3.668 | 10.3 | 1.7 | 4.9 | 1.7 | N |