Dating the formation of the counter-rotating stellar disc in the spiral galaxy NGC 5719 by disentangling its stellar populations††thanks: Based on observations collected at the European Southern Observatory for the program 383.B-0632.
Abstract
We present the results of the VLT/VIMOS integral-field spectroscopic observations of the inner () of the interacting spiral NGC 5719, which is known to host two co-spatial counter-rotating stellar discs. At each position in the field of view, the observed galaxy spectrum is decomposed into the contributions of the spectra of two stellar and one ionised-gas components. We measure the kinematics and the line strengths of the Lick indices of the two stellar counter-rotating components. We model the data of each stellar component with single stellar population models that account for the /Fe overabundance. We also derive the distribution and kinematics of the ionised-gas disc, that is associated with the younger, less rich in metals, more -enhanced, and less luminous stellar component. They are both counter-rotating with respect the main stellar body of the galaxy. These findings prove the scenario where gas was accreted first by NGC 5719 onto a retrograde orbit from the large reservoir available in its neighbourhoods as the result of the interaction with its companion NGC 5713, and subsequently fuelled the in situ formation of the counter-rotating stellar disc.
keywords:
galaxies: individual (NGC 5719) – galaxies: kinematics and dynamics – galaxies: abundances – galaxies: spirals – galaxies: stellar content1 Introduction
The presence of stars counter-rotating with respect to other stars and/or gas has been detected in several disc galaxies and is commonly interpreted as the end result of a retrograde acquisition of external gas and subsequent star formation (see Bertola & Corsini 1999 for a review). Nevertheless, some special cases of counter-rotating stellar discs could have an internal origin induced by the presence of a bar (e.g., Evans & Collett 1994).
The demography of gaseous and stellar counter-rotating components in S0’s and spirals is a key to understand their assembly process. The fraction of lenticular galaxies with a counter-rotating gaseous disc is consistent with the 50% that we expect if all the gas in S0’s is of external origin (Bertola et al., 1992). In contrast, less than 10% of them host a detectable fraction of counter-rotating stars (Kuijken et al., 1996). Large-scale counter-rotation is a rare phenomenon in spirals. In fact, less than 10% of the studied spiral galaxies host a counter-rotating gaseous and/or stellar disc (Kannappan & Fabricant, 2001; Pizzella et al., 2004). The particular case of large-scale stellar counter-rotation in disc galaxies has been observed only in NGC 4550 (Rubin et al., 1992; Rix et al., 1992; Emsellem et al., 2004), NGC 7217 (Merrifield & Kuijken, 1994), NGC 3593 (Bertola et al., 1996; Corsini et al., 1998; García-Burillo et al., 2000), NGC 4138 (Jore et al., 1996), and NGC 5719 (Vergani et al., 2007). To interpret the observed frequencies of counter-rotations, Pizzella et al. (2004) argue that the retrograde acquisition of small amounts of external gas can give rise to counter-rotating gaseous discs in gas-poor S0’s only, while in gas-rich spirals the newly acquired gas is swept away by the pre-existing gas. Counter-rotating gaseous discs in spirals are formed only from the retrograde acquisition of amounts of gas larger than the pre-existing gas content. This is the case of the purely gaseous counter-rotating components detected in NGC 3626 (Ciri et al., 1995; García-Burillo et al., 1998) and NGC 4826 (Braun et al., 1994; García-Burillo et al., 2003). Counter-rotating stellar discs are produced by subsequent star formation. Therefore, in this scenario counter-rotating stellar discs are expected to be made by younger stars than those of their host galaxy.
This picture can be directly tested in the NGC 5719/13 galaxy pair, which has been recently studied by Vergani et al. (2007). NGC 5719 is an almost edge-on Sab galaxy with a prominent skewed dust lane at a distance of 23.2 Mpc. Vergani et al. (2007) report a spectacular on-going interaction with its face-on Sbc companion NGC 5713. Two H i tidal bridges loop around NGC 5719 and connect it to NGC 5713 at a projected distance of 77 kpc. The neutral and ionised hydrogen in the disc of NGC 5719 are counter-rotating with respect to the main stellar disc. The kinematics of the ionized-gas disc and of both the counter-rotating stellar discs are measured out to about (4.3 kpc) from the galaxy centre. In conclusion, Vergani et al. (2007) propose a scenario where H i from the large reservoir available in the galactic surroundings was accreted by NGC 5719 onto a retrograde orbit and subsequently fuelled the in situ formation of the counter-rotating stellar disc.
In this work, we will address the crucial piece of information which is still missing, i.e. proving that the stellar population of the counter-rotating disc of NGC 5719 is younger with respect to that of the stars in the galaxy main disc.
2 Observations and Data reduction
The integral-field spectroscopic observations were carried out in service mode with the Very Large Telescope (VLT) at the European Southern Observatory (ESO) in Paranal during dark time between 28 April and 16 June 2009. The Unit Telescope 3 was equipped with the Visible Multi Object Spectrograph (VIMOS) in the Integral Field Unit (IFU) configuration. The HR blue grism covering the spectral range 4150 – 6200 Å and the 067 fibre-1 resolution were used. The instrumental spectral resolution measured at 5200 Å was Å (FWHM), equivalent to 115 . Observations were organised into three dithered on-target exposures of 2950 seconds each, alternated to three offset sky exposures of 280 seconds each. The average seeing measured by the ESO Differential Image Meteo Monitor was .
Data reduction (bias subtraction, fibre identification and tracing, flat fielding, wavelength calibration and correction for instrument transmission) was performed using the VIMOS ESO pipeline version 2.2.1 (http://www.eso.org/sci/software/pipelines/). The different relative transmission of the VIMOS quadrants was corrected by comparing the intensity of the night-sky emission lines. The three offset observations were used to construct three sky spectra. To compensate for the time variation of the relative intensity of the night-sky emission lines, we compared the fluxes of the sky lines measured in the offset and on-target exposures. The corrected sky spectra were then subtracted from the corresponding on-target exposures. Each exposure was organised in a data cube using the tabulated correspondence between each fibre and its position in the field of view. The three sky-subtracted data cubes were aligned using the bright galaxy nucleus as reference and co-added into a single data cube.
In order to increase the signal to noise ratio (), spectra from fibres mapping adjacent regions in the sky were added together using the Voronoi binning method (Cappellari & Copin, 2003). Some of the spatial bins were modified to include only spectra from the regions associated to intense H emission or the dust lanes crossing the galactic disc. This ensured us to minimise the contamination of the kinematic and stellar-population properties to be measured from spectra obtained in regions where stellar counter-rotation was detected and chemical decoupling is expected (Vergani et al., 2007). In total, we have 130 spatial bins few arcseconds square large. We tested the robustness of our results using different binning schemes.


3 Kinematics and line strength indices
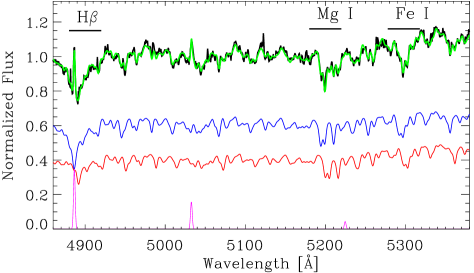
In order to measure the kinematics and stellar population properties of the two counter-rotating stellar components in NGC 5719, we need to separate their contribution to the observed spectrum in each spatial bin, taking advantage of their different velocities that causes a wavelength shift of their spectra. To do that, we modified the penalized pixel fitting code (pPXF, Cappellari & Emsellem 2004) in a similar way to that done by McDermid et al. (2006). The code builds two synthetic templates (one for each stellar component) as linear combination of stellar spectra from the MILES library (at Å spectral resolution, Beifiori et al. 2010) and convolves them with two Gaussian line-of-sight velocity distributions (LOSVDs) with different radial velocities and the same velocity dispersion . This assumption is in agreement with the findings by Vergani et al. (2007). Results are confirmed if two different velocity dispersions are considered, although the velocity fields and maps of stellar population properties appear more noisy due to the additional degree of freedom that increases the degeneracy between measured parameters. Gaussian functions are added to the convolved synthetic templates to account for ionised-gas emission lines (H, [O iii]4959, 5007, and [N i]5198) and fit simultaneously to the observed galaxy spectra. Multiplicative Legendre polynomials are included to match the shape of the galaxy continuum, and are set to be the same for the two synthetic templates. Our technique represents an improvement with respect to Vergani et al. (2007): in fitting the measured LOSVD with a double Gaussian, they assumed that the two counter-rotating components had the same stellar population. On the contrary, our synthetic templates account for different stellar populations since they are independently built from the MILES library. We check the robustness of our results using also the INDO-US Coudé library of stellar spectra (Valdes et al., 2004) and the single stellar population (SSP) synthesis models by Vazdekis et al. (2010) to build the synthetic templates. Figure 1 shows an example of the decomposition of the galaxy spectrum measured in one of the spatial bins where the two stellar counter-rotating components and ionised gas are observed. We perform the double stellar component fit only in 73 spatial bins, where the separation of the two kinematic components is reliable, and do the single stellar component fit to the spectra of the other bins. The spectra of outermost spatial bins have a low , therefore only the ionised-gas emission lines are fitted. The stellar kinematics are measured by taking into account the difference in spectral resolution between the VIMOS spectra and the MILES library. We derive the properties of the stellar populations of the two stellar counter-rotating components of NGC 5719 by measuring the line strength of the Lick indices H, Mgb, Fe5270, and Fe5335 as defined by Worthey et al. (1994) in the synthetic templates. To this aim, the spectra are set to rest-frame by adopting the measured radial velocity and convolved with a Gaussian function to match the spectral resolution of the Lick system ( Å). We also calculate the mean iron index = (Gorgas et al., 1990) and the combined magnesium-iron index [MgFe]. The [MgFe]′ index is almost independent from -enhancement and hence serves best as a metallicity tracer (Thomas et al., 2003).
We assume that the two synthetic templates are a good approximation of the mean stellar populations of the two counter-rotating components. This depends on the adopted library of stellar spectra and on the accuracy of the fitting program in recovering simultaneously the kinematics (i.e, radial velocity and velocity dispersion) and the population properties (i.e., the continuum and lines strength) of the two counter-rotating components.


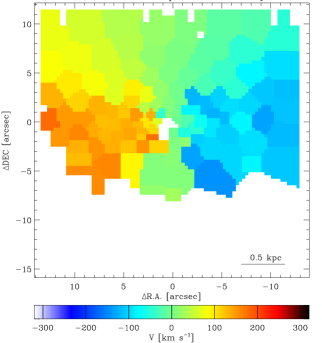
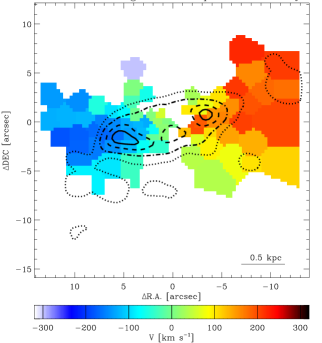
To test this, we carry out Monte Carlo simulations on a set of 1200 artificial galaxy spectra to test the reliability and accuracy of the procedure to measure the kinematics and line strength of the Lick indices of the two counter-rotating components and quantify the errors. We generate each galaxy spectrum by summing two stellar spectra with different velocity separation (), different fraction of stars in the main component with respect to the total (), different , and different . The two stellar spectra are chosen to have similar line strengths to those measured for the corresponding stellar component. Gas emission lines are also added to the artificial galaxy spectra. The modified pPXF routine is then applied to analyse the artificial galaxy spectra as if they are real. Errors on the fitted parameters are estimated by comparing the input and output values. Errors are assumed to be normally distributed, with mean and standard deviation corresponding to the systematic () and random () errors on the relevant parameters, respectively. We find that for typical values observed in NGC 5719 ( , , , ) the random errors on the recovered and are smaller than 25 and 11%, respectively, while systematic errors are negligible. The measurements of the line strengths are affected both by random and systematic errors: if the true equivalent width of the spectral index of the two components are and with , the program measures and . For the typical values observed in NGC 5719, random errors are Å, and systemic errors are Å, mildly depending on and . Figure 2 shows the measured two-dimensional velocity fields of the main and counter-rotating stellar components and ionised gas. Figure 3 shows the Lick indices [MgFe]′, H, Mgb, and we measure in the bins where the two counter-rotating components are disentangled. The predictions of the single stellar population models by Thomas et al. (2010) are also shown for reference. Correction for the offset to the Lick system is not applied, since no standard Lick stars were observed. Nevertheless, the VIMOS spectra are flux calibrated, therefore we expect the offset to be small and constant. This represents only a rigid shift to the points in Fig. 3, and therefore does not change our result.
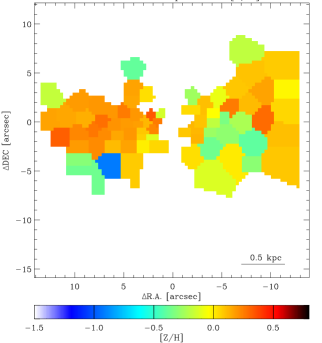
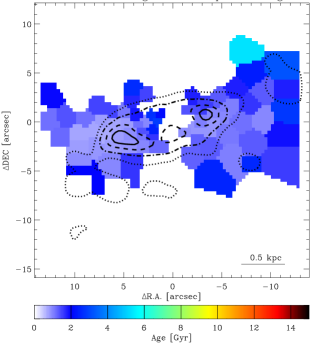
The luminosity-weighted metallicity ([Z/H]), -enhancement ([/Fe]) and population age are derived for each component by a linear interpolation between the model predictions by Thomas et al. (2010) using an iterative procedure as done in Morelli et al. (2008). We do not include in the interpolation all the spatial bins with equivalent width of the Lick indices located outside the model grid more than the mean errorbar. The two-dimensional maps of age, [Z/H] and [/Fe] of the main and counter-rotating stellar components are shown in Figure 4.
4 Discussion and conclusions
We present the results of the VLT/VIMOS integral-field spectroscopic observations of the inner () of the spiral galaxy NGC 5719. The kinematics of the stars and ionised gas are very complex. The observed galaxy spectra are decomposed into the contributions of three distinct kinematic components characterised by a regular disc-like rotation: one main and one secondary stellar component and a ionised-gas component. The spectral decomposition is done using an implementation of the pPXF routine, which allows to measure simultaneously the kinematics and stellar population properties of the two stellar components.
The rotation of the main stellar component is receding towards East, like that of the stellar body of the galaxy as observed by Vergani et al. (2007) out to . We measure a maximum rotation velocity of at about (1.1 kpc) from the centre. The secondary stellar and ionised-gas components are counter-rotating with respect to the main stellar component, with a maximum rotation of at about from the centre. We are able to resolve the two stellar components down to the innermost (0.2 kpc). At smaller radii, they have a too small velocity separation to be resolved. The median values of light fraction contributed by the two components in the spatial bins where they are resolved are and (with standard deviation), respectively.
The ionised gas is detected all over the observed field of view. It is characterised by a strong H emission, which is concentrated in a twin-peaked morphology indicating an edge-on ring with a semi-major axis of (0.8 kpc), and an outer asymmetric and fragmented spiral arc extending southwards with a semi-major axis of (1.5 kpc; see contours in Figs. 2 and 4). The two-stream fluid instability present in systems like NGC 3593 (García-Burillo et al., 2000) can favor this morphology. An hint of the inner ring is visible also in the H i position-velocity diagram measured along the major axis of NGC 5719 (Vergani et al., 2007). The secondary stellar component is associated to these features of the gas distribution, i.e. the counter-rotating stars are detected in a region enclosed by the ionised-gas structures. A similar phenomenon is observed in NGC 3593, where a concentrated gaseous ring is associated to the counter-rotating stellar disc (Corsini et al., 1998; García-Burillo et al., 2000).
The two counter-rotating stellar components are characterised by different chemical properties as it results from the measured line strength of the Lick indices (Fig. 3). On average, the main stellar component has lower H and higher [MgFe]′, Mgb, and with respect to the secondary component. This translates immediately into different properties of their stellar populations (Fig. 4). The main stellar component has ages ranging from 2 to 13.5 Gyr (median Gyr with 4 Gyr standard deviation). It has nearly-solar metallicity (median dex with 0.20 dex standard deviation). It displays super-solar enhancement (median dex with 0.10 dex standard deviation). The counter-rotating stellar population component is younger, with ages ranging from 0.7 Gyr to 2.0 Gyr (median age = 1.3 Gyr with 0.6 Gyr standard deviation). Its metallicity shows a radial gradient: it changes from sub-solar ( dex) in the outskirts, to solar ( dex) and super-solar ( dex) in the centre. The youngest ages and highest metallicities are found in correspondence of the regions where the H emission is more intense. The -enhancement is super-solar (median dex with 0.05 dex standard deviation).
These findings extend the results by Neff et al. (2005) based on GALEX observations. They reported the presence of a young stellar component in the disc of NGC 5719 by analysing UV and optical images. Unfortunately, the poor GALEX angular resolution prevented them to associate it to the H ring as we successfully do (Fig. 4). Our estimate is in agreement with their lower limit to the actual age of such a young population ( Gyr).
With our new observations and spectral decomposition technique, we prove that the mean age of the counter-rotating disc, which is associated to the neutral and ionised gas disc, is indeed younger than the main stellar disc. This result shows that counter-rotating disc has been recently assembled. The median overabundance of the counter-rotating component (0.14 dex) indicates a star formation history with a time-scale of 2 Gyr (Thomas et al., 2005). More details about the assembly process could be derived by a further analysis of the east-west asymmetries measured in the maps of the stellar-population properties. The scenario proposed by Vergani et al. (2007) that NGC 5719 hosts a counter-rotating stellar disc originated from the gas accreted during the ongoing merging with its companion NGC 5713, is finally confirmed.
References
- Beifiori et al. (2010) Beifiori A., Maraston C., Thomas D., Johansson J., 2010, ArXiv: 1012.3428
- Bertola et al. (1992) Bertola F., Buson L. M., Zeilinger W. W., 1992, ApJ, 401, L79
- Bertola et al. (1996) Bertola F., Cinzano P., Corsini E. M., Pizzella A., Persic M., Salucci P., 1996, ApJ, 458, L67
- Bertola & Corsini (1999) Bertola F., Corsini E. M., 1999, in J. E. Barnes & D. B. Sanders ed., Galaxy Interactions at Low and High Redshift Vol. 186 of IAU Symposium, Counterrotation in Galaxies. p. 149
- Braun et al. (1994) Braun R., Walterbos R. A. M., Kennicutt Jr. R. C., Tacconi L. J., 1994, ApJ, 420, 558
- Cappellari & Copin (2003) Cappellari M., Copin Y., 2003, MNRAS, 342, 345
- Cappellari & Emsellem (2004) Cappellari M., Emsellem E., 2004, PASP, 116, 138
- Ciri et al. (1995) Ciri R., Bettoni D., Galletta G., 1995, Nature, 375, 661
- Corsini et al. (1998) Corsini E. M., Pizzella A., Funes J. G., Vega Beltran J. C., Bertola F., 1998, A&A, 337, 80
- Emsellem et al. (2004) Emsellem E., Cappellari M., Peletier R. F., et al. 2004, MNRAS, 352, 721
- Evans & Collett (1994) Evans N. W., Collett J. L., 1994, ApJ, 420, L67
- García-Burillo et al. (2003) García-Burillo S., Combes F., Hunt et al. 2003, A&A, 407, 485
- García-Burillo et al. (1998) García-Burillo S., Sempere M. J., Bettoni D., 1998, ApJ, 502, 235
- García-Burillo et al. (2000) García-Burillo S., Sempere M. J., Combes F., et al. 2000, A&A, 363, 869
- Gorgas et al. (1990) Gorgas J., Efstathiou G., Aragon Salamanca A., 1990, MNRAS, 245, 217
- Jore et al. (1996) Jore K. P., Broeils A. H., Haynes M. P., 1996, AJ, 112, 438
- Kannappan & Fabricant (2001) Kannappan S. J., Fabricant D. G., 2001, AJ, 121, 140
- Kuijken et al. (1996) Kuijken K., Fisher D., Merrifield M. R., 1996, MNRAS, 283, 543
- McDermid et al. (2006) McDermid R. M., Emsellem E., Shapiro K. L., et al. 2006, MNRAS, 373, 906
- Merrifield & Kuijken (1994) Merrifield M. R., Kuijken K., 1994, ApJ, 432, 575
- Morelli et al. (2008) Morelli L., Pompei E., Pizzella A., et al. 2008, MNRAS, 389, 341
- Neff et al. (2005) Neff S. G., Thilker D. A., Seibert M., et al. 2005, ApJ, 619, L91
- Pizzella et al. (2004) Pizzella A., Corsini E. M., Vega Beltrán J. C., Bertola F., 2004, A&A, 424, 447
- Rix et al. (1992) Rix H., Franx M., Fisher D., Illingworth G., 1992, ApJ, 400, L5
- Rubin et al. (1992) Rubin V. C., Graham J. A., Kenney J. D. P., 1992, ApJ, 394, L9
- Thomas et al. (2003) Thomas D., Maraston C., Bender R., 2003, MNRAS, 339, 897
- Thomas et al. (2005) Thomas D., Maraston C., Bender R., Mendes de Oliveira C., 2005, ApJ, 621, 673
- Thomas et al. (2010) Thomas D., Maraston C., Johansson J., 2010, MNRAS, in press (arXiv: 1010.4569)
- Valdes et al. (2004) Valdes F., Gupta R., Rose J. A., et al. 2004, ApJS, 152, 251
- Vazdekis et al. (2010) Vazdekis A., Sánchez-Blázquez P., Falcón-Barroso J., et al. 2010, MNRAS, 404, 1639
- Vergani et al. (2007) Vergani D., Pizzella A., Corsini E. M., et al. 2007, A&A, 463, 883
- Worthey et al. (1994) Worthey G., Faber S. M., Gonzalez et al. 1994, ApJS, 94, 687