75As NMR study of antiferromagnetic fluctuations in Ba(Fe1-xRux)2As2
Abstract
Evolution of 75As NMR parameters with composition and temperature was probed in the Ba(Fe1-xRux)2As2 system where Fe is replaced by isovalent Ru. While the Ru-end member was found to be a conventional Fermi liquid, the composition () corresponding to the highest ( K) in this system shows an upturn in 75As below about 80 K evidencing the presence of antiferromagnetic (AFM) fluctuations. These results are similar to those obtained in another system with isovalent substitution BaFe2(As1-xPx)2 [Y. Nakai, T. Iye, S. Kitagawa, K. Ishida, H. Ikeda, S. Kasahara, H. Shishido, T. Shibauchi, Y. Matsuda, and T. Terashima, Phys. Rev. Lett. 105, 107003 (2010)] and point to the possible role of AFM fluctuations in driving superconductivity.
pacs:
74.70.Xa,74.25.nj,74.62.Dh,74.62.-c1. Introduction
The recent discovery of superconductivity in an iron based material Kamihara-JACS-130-2008 LaFeAs(O1-xFx) with a superconducting transition temperature K and soon after, the increase of to K with applied pressure Takahashi-Nature-453-2008 has reignited the interest in superconductors. The main motivating factors for this interest are (i) the presence of Fe, which is normally not considered conducive to superconductivity and (ii) the superficial similarity to the high- cuprates, in terms of the existence of FeAs layers.
The parent compound BaFe2As2 is a semimetal which crystallizes in a ThCr2Si2-type structure () and exhibits a spin-density-wave (SDW) transition Rotter-PRB-78-2008 at K. Superconductivity is induced following electron/hole doping Sefat-PRL-101-2008 ; Rotter-PRL-101-2008 , by applying pressure externally Alireza-JPCM-21-2009 , by replacing As with isovalent P Jiang-JPCM-21-2009 , or by replacing Fe with isovalent Ru Sharma-PRB-81-2010 .
Heterovalent substitutions manifestly give rise to a change in the carrier concentration in addition to other effects. Therefore, it appears interesting to investigate isovalent substitutions which might help to narrow down the relevance of various factors to superconductivity. Perhaps with this motivation, Ru substitution at the Fe site was attempted Sharma-PRB-81-2010 ; Thaler-PRB-82-2010 ; Rullier-Albenque-PRB-81-2010 . In the reported works relevant to single crystals, the authors were able to substitute Ru in place of Fe, however, only up to a limit of (in Thaler-PRB-82-2010 ) and (in Rullier-Albenque-PRB-81-2010 ). Very recently, Eom et al. Eom-arxiv-2011 prepared single crystals upto . On the other hand, in the work on polycrystalline Ba(Fe1-xRux)2As2 by S. Sharma et al. Sharma-PRB-81-2010 complete substitution was achieved. In Sr(Fe1-xRux)2As2 as well Schnelle et al. Schnelle-PRB-79-2009 achieved full substitution of Fe with Ru in polycrystalline samples. Ru substitution suppresses the long-range antiferromagnetic transition and superconductivity appears. The role played by antiferromagnetic spin fluctuations has been suggested to be important towards a pairing mechanism.
From magnetic susceptibility measurements, Nath and co-workers Nath-PRB-79-2009 have estimated the density-of-states at the Fermi level of BaRu2As2 to be states/(eV formula unit). Thaler et al. have done a detailed study on single crystalline Ba(Fe1-xRux)2As2 samples where they have shown the similarity of its phase diagram with that of BaFe2As2 with pressure Thaler-PRB-82-2010 . Brouet et al. Brouet-PRL-105-2010 have studied a Ba(Fe0.65Ru0.35)2As2 single crystal using electrical transport and photoemission spectroscopy and concluded that the electron and hole concentrations were equal to each other but double of those in BaFe2As2. The increase in carrier concentration has been attributed to a large change in the band structure as compared to undoped BaFe2As2. From thermal conductivity measurements on Ba(Fe0.64Ru0.36)2As2 single crystal and comparing their data with other doping samples, Qiu et al. Qiu-arxiv-2011 have shown that nodal superconductivity induced by isovalent doping (P at As site and Ru at Fe site) have the same origin. From electrical transport measurements, Eom et al. Eom-arxiv-2011 suggest that whereas there is a deviation from Fermi-liquid behavior for compositions around the maximum , overdoped compositions tend towards a Fermi-liquid behavior. However, due to the difficulty in preparing single crystals of BaRu2As2 no comparison exists between the superconducting compositions and the Ru end member.
Nuclear magnetic resonance (NMR) has been instrumental in the case of cuprates in detecting antiferromagnetic fluctuations, pseudo-gap, and other features. In the FeAs compounds as well, NMR has been extensively used to obtain a deeper understanding of various physics issues Ishida-review . In fact, in the isovalent substituted system BaFe2(As1-xPx)2, 31P NMR was found to show the prominence of antiferromagnetic fluctuations above in the superconducting compositions Nakai-PRL-105-2010 . However, up to now, no local probe investigations have been reported which might help to understand the variation of properties in the Ba(Fe1-xRux)2As2 system. In this paper, we report 75As NMR measurements on Ba(Fe1-xRux)2As2 () samples. From our measurements, we show that the Ru-end member behaves like a conventional Fermi liquid. In contrast, for the sample ( K ), 75As is constant at high- but increases with decrease in below 80 K suggesting the emergence of antiferromagnetic fluctuations. Also, no evidence of heavy Fermi liquid behaviour in Ba(Fe1-xRux)2As2 is found from our NMR measurements.
2. Experimental Details
Polycrystalline samples of Ba(Fe1-xRux)2As2 () were prepared at IGCAR as detailed in Sharma-PRB-81-2010 . Basic characterisation of the samples was done by x-ray diffraction, magnetization, and resistivity measurements. For NMR measurements, we tried to align the powder samples by mixing with Stycast epoxy and then curing overnight in an external magnetic field kOe. 75As NMR measurements were carried out at IIT Bombay using a Tecmag pulse spectrometer in a magnetic field of kOe using a room-temperature bore Varian superconducting magnet. Variable temperature measurements were performed using an Oxford continuous flow cryostat, using liquid nitrogen in the temperature range K and using liquid helium in the temperature range K. The 75As has nuclear spin ( natural abundance) and gyromagnetic ratio MHz/T. Spectra were obtained by Fourier transform of the spin echo resulting from a pulse sequence. Spin-lattice relaxation time () was obtained by fitting the time dependence of spin-echo intensity with the formula
| (1) |
following a sequence where the pulse duration is .
3. Results and discussions
X-ray powder diffraction revealed the presence of small amount (several percent) of FeAs as also unreacted Fe and Ru present in the samples. The average Ru content is expected to be less than the nominal amount as was already found by others Rullier-Albenque-PRB-81-2010 ; Thaler-PRB-82-2010 . Another point to note is that the x-ray diffraction peaks for our sample are broad compared to those of the end-members. This is likely due to a distribution of Ru content for this sample. Similar broadened peaks were also found in Sr(Fe1-xRux)2As2 Qi-Physica C-469-2009 . The inability of Thaler et al. Thaler-PRB-82-2010 and Rullier-Albenque et al. Rullier-Albenque-PRB-81-2010 to obtain homogeneous single crystals of Ba(Fe1-xRux)2As2 with is perhaps related to the difficulty in obtaining a sharply defined composition. In any case, whereas a small amount of extrinsic impurity or a distribution of Ru content does affect bulk properties like magnetisation and resistivity, using a local probe such as NMR we will be able to probe the instrinsic properties.
Resistivity and magnetic susceptibility (not shown here) evidence the occurence of superconductivity in the BaFeRuAs2 () sample with a transition onset at K similar to Sharma-PRB-81-2010 . Following this basic characterisation, we investigate the normal state properties using 75As NMR as a local probe. Before describing our measurements, we will first state some basic facts pertaining to the NMR of 75As nuclei. In the Ba(Fe1-xRux)2As2 system, 75As () is not at a site of cubic symmetry. This gives rise to a non-zero electric field gradient (EFG) at the 75As site and coupled with its electric quadrupole moment, there arise changes in the NMR lineshape as also the spin-lattice relaxation behaviour. When the quadrupole term in the Hamiltonian is weak compared to the Zeeman term it is enough to consider the effects upto first order in perturbation theory. In this case, the central line ( transition) is unaffected while satellite lines appear corresponding to the and transitions. The positions of the satellite lines depends on the angle between the magnetic field direction and the direction made by the maximum of the EFG . When quadrupole effects are considered to second order (and for axial symmtery), the central line position (in the absence of anisotropy) also depends on and is given by the following equation
| (2) |
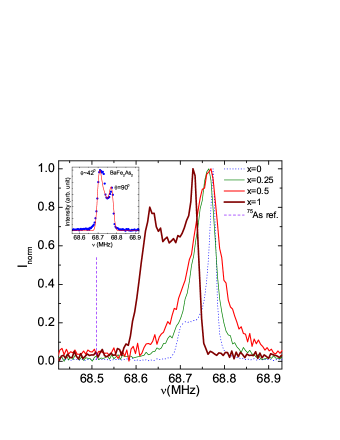
where is the quadrupole frequency and the Larmor frequency. In a randomly aligned polycrystalline sample the central lineshape is the powder average, resulting in two peaks corresponding to and . It is known Baek-PRB-78-2008 that for BaFe2As2 is about MHz. The central line pattern in our randomly aligned BaFe2As2 sample can be generated (see inset of figure 1) taking MHz. In going from BaFe2As2 to BaRu2As2 these numbers are expected to change only nominally.
We have attempted to align the samples with the -plane in the applied field direction. As seen from the contrast between the figure 1 inset (randomly aligned) and the curve for (aligned sample) in the main figure 1, this is well achieved for BaFe2As2. However, it appears that the Ru-substituted samples did not align in the field. This arises perhaps due to the absence of single crystallites in the powders. Nevertheless, our objectives from the spectra measurements are twofold; (i) to determine the Knight shift as a function of temperature and (ii) to irradiate the central line and then determine the spin-lattice relaxation rate. From the position of the peak, the shift can be determined. Since the central line is only about kHz in overall extent whereas our typical pulsewidth is , there is sufficient spectral width to saturate the central line with a single pulse.
The measured spectra could be simulated assuming , MHz and (i.e., ). The isotropic shift is therefore determined using equation 2 (). gives useful information about the intrinsic susceptibility (having both spin and orbital contributions) of the sample. We have , where is the spin part of the Knight shift and is the temperature independent chemical shift. The hyperfine coupling is while and are the Avogadro number and the Bohr magneton, respectively. The temperature variation of shift is shown in figure 2. As to the value of the chemical shift, there is some disagreement in literature. Ning et al. Ning-JPSJ-78-2009 estimated the chemical shift from their measurement at K. On the other hand, Kitagawa et al. Kitagawa-JPSJ-77-2008 obtained chemical shift by plotting and then extrapolating to zero susceptibility. Kitagawa et al. commented that the value of (also found by Ning et al.) seemed rather large and perhaps the extrapolation was not reliable. In view of this as also the possibility that might be composition dependent, we have not corrected our shift data for the chemical shift.
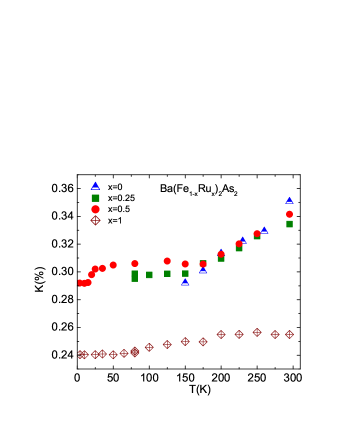
For , the shift is almost independent of temperature like a conventional Fermi liquid. For the other three samples (including the superconducting composition) the shift value is higher than that for . Further it increases linearly with temperature above K. Below K the shift is independent of temperature for and samples. The drop in shift at K for is due to the superconducting transition. The SDW transition is seen at K and K for and , respectively. The nearly unchanged shift in going from to indicates that the density-of-states at the Fermi level remains unchanged with substitution up to . On the other hand, the non-superconducting, metallic end-member has a significantly smaller shift (and therefore ). In case is taken to be about (as in Ning-JPSJ-78-2009 ) the reduction in is by a factor of two in going from to . A similar trend is seen in BaFe2(As1-xPx)2 for the larger values of beyond the superconducting dome Nakai-PRL-105-2010 .
To study the low-energy spin dynamics, is measured as a function of temperature for all the samples by the saturation recovery method. A representative data-set for BaRu2As2 at K and its fit with equation 1 is shown in the inset of figure 3.
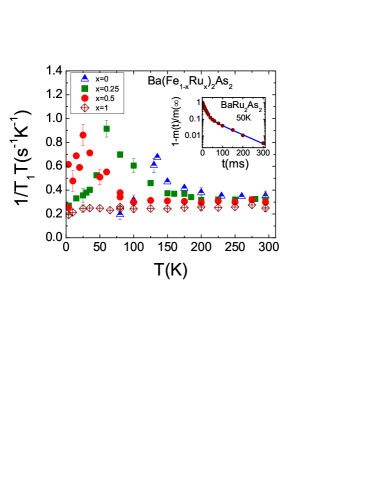
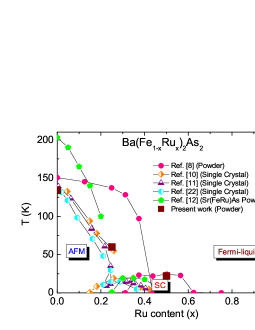
For the sample, the data could be fit with in the full temperature range as also for other compositions for temperatures higher than about K. At lower temperatures the ratio of the coefficients is about . The ratio of the coefficients is expected to be different from in case the relaxation is not magnetic. In the present case, it is possible that the lattice becomes soft prior to the superconducting transition and then quadrupolar relaxation also contributes. However, there could be other possibilities. The variation of the relaxation rate divided by temperature as a function of temperature is shown in figure 3. Note that conventional, wide-band metallic systems will have a -independent . Therefore, Korringa behaviour (-independent ) in a conventional metal implies the constancy of with . For the non-superconducting composition, is seen to be independent of down to 4 K. It’s shift is also found to be only weakly -dependent. Of course, one needs to know in order to make a quantitative comment about the -variation of and consequently of . Since the present problem involves transferred hyperfine interactions, the relaxation rate may also be affected by the form factor (-dependence of hyperfine couplings) which could lead to a deviation from the free-electron value of as also its expected -independence. Our observed value of for is within an order of magnitude of the free electron value and is also nearly -independent which, keeping the above limitations in mind, seems to suggest the validity of the Fermi-liquid picture for BaRu2As2. It’s worth mentioning that Eom et al. Eom-arxiv-2011 also found Fermi-liquid behavior for higher doping () samples. In contrast, for the superconducting sample () () is independent of down to about 80 K below which it shows an upturn before dropping at the superconducting transition at K. The upturn in () as a function of temperature has also been seen (in the context of iron pnictides) in BaFe2(As1-xPx)2 in 31P NMR studies Nakai-PRL-105-2010 and is believed to signify the existence of antiferromagnetic fluctuations. For and 0.25, () shows an anomaly at the SDW transition which is also seen in shift measurements. Compiling the published data on Ba(Fe1-xRux)2As2 (single crystals and powders), we summarize its magnetic phase diagram in figure 4. Data for Sr(Fe1-xRux)2As2 are also shown for reference. The heavily overdoped region exhibits Fermi-liquid behavior and near the top of the superconducting dome, there is a prominence of AFM fluctuations along with non-Fermi-liquid behavior based on the NMR data. The AFM/SDW part shows anomalies in the shift at the ordering temperature as expected.
4. Conclusions
We have reported 75As NMR measurements on Ba(Fe1-xRux)2As2 () samples for the first time. The full ruthenated sample () is a conventional Fermi liquid as evidenced from shift and measurements. On moving towards the superconducting composition (), the density-of-states at the Fermi level increases. Further, for the sample, shows an upturn with decreasing temperature indicative of the emergence of antiferromagnetic fluctuations. Our results suggest the importance of AFM fluctuations in the superconducting mechanism in the FeAs -based systems. Similar results have been reported for isovalent P-substitution at the As site Nakai-PRL-105-2010 .
5. Acknowledgments
We thank the Department of Science and Technology, India for financial support.
References
- (1) Kamihara Y, Watanabe T, Hirano M and Hosono H 2008 J. Am. Chem. Soc. 130 3296
- (2) Takahashi H, Igawa K, Arii K, Kamihara Y, Hirano M and Hosono H 2008 Nature (London) 453 376
- (3) Rotter M, Tegel M, Johrendt D, Schellenberg I, Hermes W and Pottgen R 2008 Phys. Rev. B 78 020503(R)
- (4) Sefat A S, Jin R, McGuire M A, Sales B C, Singh D J and Mandrus D 2008 Phys. Rev. Lett. 101 117004
- (5) Rotter M, Tegel M and Johrendt D 2008 Phys. Rev. Lett. 101 107006
- (6) Alireza P L, Ko Y T C, Gillett J, Petrone C M, Cole J M, Lonzarich G G and Sebastian S E 2009 J. Phys.: Condens. Matter 21 012208
- (7) Jiang S, Xing H, Xuan G, Wang C, Ren Z, Feng C, Dai J, Xu Z and Cao G 2009 J. Phys.: Condens. Matter 21 382203
- (8) Sharma S, Bharathi A, Chandra S, Reddy V R, Paulraj S, Satya A T, Sastry V S, Gupta A and Sundar C S 2010 Phys. Rev. B 81 174512
- (9) Thaler A, Ni N, Kracher A, Yan J Q, Budko S L and Canfield P C 2010 Phys. Rev. B 82 014534
- (10) Rullier-Albenque F, Colson D, Forget A, Thuery P and Poissonnet S 2010 Phys. Rev. B 81 224503
- (11) Eom M J, Na S W, Hoch C, Kremer R K, and Kim J S 2011 arXiv:1109.1083v1
- (12) Schnelle W, Leithe-Jasper A, Gumeniuk R, Burkhardt U, Kasinathan D and Rosner H 2009 Phys. Rev. B 79 214516
- (13) Nath R, Singh Y and Johnston D C 2009 Phys. Rev. B 79 174513
- (14) Brouet V, Rullier-Albenque F, Marsi M, Mansart B, Aichhorn M, Biermann S, Faure J, Perfetti L, Taleb-Ibrahimi A, Fevre P L, Bertran F, Forget A and Colson D 2010 Phys. Rev. Lett. 105 087001
- (15) Qiu X, Zhou S Y, Zhang H, Pan B Y, Hong X C, Dai Y F, Eom M J, Kim J S, Li S Y 2011 arXiv:1106.5417v2
- (16) Ishida K, Nakai Y and Hosono H 2009 J. Phys. Soc. Jpn. 78 062001
- (17) Nakai Y, Iye T, Kitagawa S, Ishida K, Ikeda H, Kasahara S, Shishido H, Shibauchi T, Matsuda Y and Terashima T 2010 Phys. Rev. Lett. 105 107003
- (18) Qi Y, Wang L, Gao Z, Wang D, Zhang X and Ma Y 2009 Physica C 469 1921
- (19) Baek S -H, Klimczuk T, Ronning F, Bauer E D, Thompson J D and Curro N J 2008 Phys. Rev. B 78 212509
- (20) Ning F, Ahilan K, Imai T, Sefat A S, Jin R, McGuire M A, Sales B C and Mandrus D 2009 J. Phys. Soc. Jpn. 78 013711
- (21) Kitagawa K, Katayama N, Ohgushi K, Yoshida M and Takigawa M 2008 J. Phys. Soc. Jpn. 77 114709
- (22) Kim M G, Pratt D K, Rustan G E, Tian W, Zarestky J L, Thaler A, Bud’ko S L, Canfield P C, McQueeney R J, Kreyssig A and Goldman A I 2011 Phys. Rev. B 83 054514