The soundscape dynamics of human agglomeration
Abstract
We report a statistical analysis about people agglomeration soundscape. Specifically, we investigate the normalized sound amplitudes and intensities that emerge from people collective meetings. Our findings support the existence of nontrivial dynamics characterized by heavy tail distributions in the sound amplitudes, long-range correlations in the sound intensity and non-exponential distributions in the return interval distributions. Additionally, motivated by the time-dependent behavior present in the volatility/variance series, we compare the observational data with those obtained from a minimalist autoregressive stochastic model, a GARCH process, finding a good agreement.
pacs:
89.65.-s, 89.75.-k, 05.45.Tp, 89.20.-a1 Introduction
Physicists are now addressing problems very far from their traditional domain. Even social phenomena are now ubiquitous in the research made by the statistical physicists [1]. In particular, the general framework of the Statistical Physics has been successfully applied to diverse interdisciplinary fields ranging from finance [2], genetics [3] and biology [4], to religion [5], tournaments [6], culinary [7], and music [8].
Naturally, in social phenomena the basic constituents of the system is the human. Humans are known to have nontrivial collective dynamics, much more complicated than idealized physical interacting systems. Moreover, even individual aspects related to social agents may not be available. This complex scenario is reflected, in some sense, in several human activities. For instance, elections [9], collaborations between actors [10] and also between scientists [11], phone text-message [12], mail [13, 14] or email [14, 15] communication, human travel [16, 17], and collective listening habits [18, 19] are just a few examples where complex structures have been found.
Most of the previous investigation deal with record data obtained directly or indirectly from the system, trying to extract some patterns or regularities about the system dynamics. This approach has been a trend towards investigating social phenomena and also complex systems in general [20, 21, 22, 23, 24]. Within this framework the most diversified data were used as the sound. “Listen to” the system dynamics may be both a simple task and a minimally invasive measurement. In this direction, several studies focused on the sound time series have been done. Just to mention a few: researches about the acoustic emission from crumpled paper [25, 26], from paper fracture [27], and fractures in general [28, 29] show several features related to critical phenomena, the power spectrum of music and speech sounds presents -like spectra [30] and the normalized sound amplitude shows non-Gaussian features [31], traffic flows were investigated by using the sound noise revealing scaling and memory [32], avalanches-like dynamics was found in the sound of popping bubbles in foams [33] and also in the lung sound [34].
In this work, we present an investigation about a very common situation related to human collective activities: the people agglomeration. Human beings agglomerations can emerge in various places for different reasons, for example, people having lunch in restaurant, parties, and working meetings. In all these situations a common and notorious feature is perceptible: the resulting sound noise from these agglomerations. Here, our main goal is to show that a nontrivial dynamic emerges when analyzing this kind of time series. In addition, employing a minimalist model we are able to reproduce statistical aspects of the empirical data. In the following, we present the details about the data acquisition, the statistical analysis of the data, our minimal model, and finally we end with a summary.
2 Data presentation
The observational data was obtained by recording the soundscape of people agglomeration in the recreation time at our university. The meeting point is an open place where the students spend time until the next class. All the measurements were made by using a condenser microphone (Shure Microflex MX202W/N) positioned in the central part of the agglomeration. We employed a sampling rate of 44.1 kHz in order to cover the full audible human range (approximately between 20 Hz and 20 kHz). Additionally, the measurements were made during different periods in nine days totaling 16 records. The number of people during the recordings ranged approximately between 100 and 200, and these variations does not significantly change the statistical results. Typical recording times are about 10 minutes and along the recording the number of persons was approximately constant. We also analyzed 10 recordings from a web sound database111freesound.org finding similar results when compared with our measurements.
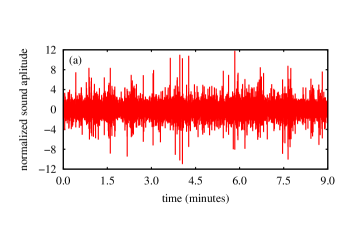
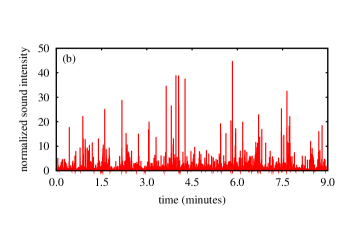
Figure 1(a) shows a representative record signal where we employed the normalized sound amplitude , i.e., the sound amplitude subtracted by its mean value and divided by its standard deviation. Figure 1(b) presents the sound intensity, , divided by its standard deviation. From these two figures, we can observe the existence of some bursts where the sound amplitude and the sound intensity exceed values much larger than their standard deviations. Qualitatively, the origin of these extreme events may be, for instance, related to the fact that the people want to be heard, and if the neighbors are talking out loud they also have to increase the sound intensity.
3 Statistical analysis
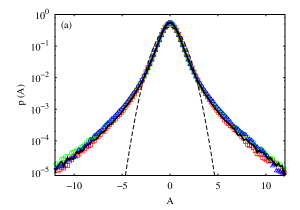
One of the most direct ways to characterize the sound amplitude is by evaluating its probability density function (pdf). We show this analysis in Figure 2(a) for three typical recordings where we also plot one Gaussian distribution with zero mean and unitary variance (dashed line). A quite similar behavior has been found for all the other realizations of the experiment and also for the web recordings (at least in the central part of the distribution). The empirical distribution clearly differs from the Gaussian one, especially for larger values of the sound amplitude ( greater than four standard deviations). Naturally, this heavy tail behavior reflects the presence of extreme events that we qualitatively see in Figure 1.
A possible manner to investigate the dynamics of these extreme events is by evaluating the time interval between them. These time intervals can be obtained by considering a threshold value and storing all the initial time for which the normalized sound intensity is above this edge. The difference between two consecutive times is the so called return interval. For Gaussian uncorrelated (or weak correlated) random variables the distribution of is well known to follows an exponential distribution , where is the average value of when considering the threshold value . Additionally, empirical results have shown that, in the presence of power law correlations in the data, the distribution is well adjusted by a stretched exponential [35, 37, 36] or by a Weilbull distribution [38], i.e.,
| (1) |
where and are constants and is the exponent of the power law autocorrelation function. These distributions also emerge in the analytical framework of Santhanam and Kantz [39] when considering a long-range correlated noise with Gaussian pdf. Notice that all these distributions are dependent on , but if we employ the scaled variable this dependence is eliminated.
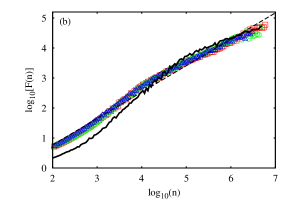
Before we investigate the return intervals, let us address the correlation question by using the detrended fluctuation analysis (DFA) [40]. This technique basically considers the root mean square fluctuation function (see for instance [41]) for the integrated and detrended time series for different values of the time scale . When the data present scale-invariance properties, follows a power law , where indicates the degree of correlation in the time series: if the series is uncorrelated and if the series is long-range correlated. Figure 2(b) shows the fluctuation function versus for the same three recordings of Figure 2(a) where we found indicating that long-range correlations are present in the data. Note that the three curves are practically identical. This fact is evidenced by evaluating the mean value of () and its standard deviation () over the 16 recordings finding and . When considering the web recordings this values remain close: and .
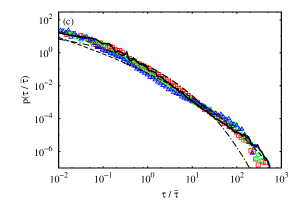
Now, advancing with the return interval distribution, it is interesting to emphasize that the exponents and are related via . Moreover, since the distribution of should be normalized and also have unitary mean, the only fit parameter is that can be obtained from leading to . Figure 2(c) shows this distribution for three values of where we can observe a reasonable data collapse but a not so good agreement with the distributions of equation 1. Similar situation have been recently observed when considering non-Gaussian distributions related to water boiling [42].
We can also investigate the bursts observed in Figure 1(a) by evaluating the volatility of the normalized sound amplitude. This time series refers to the local standard deviation of estimated over a time window , i.e.,
| (2) |
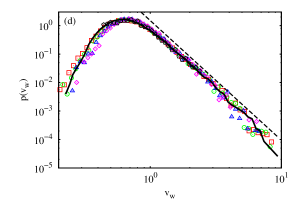
where , is a integer and is the sampling time interval. Figure 2(d) shows the volatility distribution of our empirical data for time windows ranging from to second. Notice that we found a good collapse of data and that this distribution has an asymptotic power law decay characterized by a exponent . The mean value and the standard deviation of calculated over the 16 realizations are respectively and ( and for the web recordings).
4 Modeling
Our starting point to model the data behavior is the non-stationary aspect of the volatility. Figure 2(d) supports the conclusion that the volatility of the sound amplitude is a time-dependent stochastic process and Figure 2(b) indicates that long-term memory are present in sound intensity series. This feature is very common in financial data where the volatility (or risk) is one of most essential ingredients in the price dynamics. In this scenario, much work has been done [43] and consequently a large amount of models are available. From a qualitative point of view, the interactions (competitions) among people present financial markets seems to be similar to the ones existent in our social system. This picture motives us to employ a typical financial model to our data.
One of these models is the generalized autoregressive conditional heteroskedastic processes or simply the GARCH process. This model was proposed [44] (at least in part) to take into account the long memory typically found in financial data. It is defined in its most general form, GARCH, by
| (3) |
where and are positive control parameters and is a uncorrelated random variable with zero mean and unitary variance. Thus, the GARCH process is uncorrelated in but correlated in the variance. Also note that for the GARCH recovery the so called ARCH process [45].
Here, for simplicity and also for satisfactoriness we will focus on the GARCH process
| (4) |
for which we choose the distribution of to follow the standard Gaussian. After this simplification the model have three parameters: , and . However, since the sound amplitude is scaled to a unitary variance, we can eliminate one of these parameters by using the expected variance of the GARCH process :
| (5) |
In this manner, we have now two parameters that we incrementally update to minimize, via the method of least squares, the difference between the simulated values of sound amplitude and the observational ones. The best values for the parameters are and leading to since . The comparison with the empirical data is shown in Figure 2, where the GARCH predictions are indicated by the continuous lines. We can see that the agreement between the data and the GARCH is very good.
Concerning Figure2(b), where we compare the DFA analysis, we have to remark that the autocorrelation function of the variable is not really long-range correlated. In fact, it has an exponential decay [44], i.e., , where . However, the GARCH process can mimic the long-range decay for large values of the characteristic time . This feature can be achieved by choosing the sum closer the unity. In our case, leading to characteristic time seconds, which is very large mimicking at least in part the long-range correlations. Notice that the empirical data also present deviations from the straight line suggesting that correlations present in the data may have a kind of exponential cutoff.
5 Summary
In this work we investigated some statistical aspects of the collective sound emitted by people when they are agglomerated in a meeting place. Empirical evidences showed that (i) the normalized sound amplitude is not Gaussian distributed, (ii) the sound intensity presents long-range correlations, (iii) the return interval distribution of the sound intensity is not exponential, and (iv) the volatility of the sound amplitude is non-stationary having a power law tail in its distribution. Motivated by the time dependence of the volatility, we compared the observational quantities with the predictions of the GARCH model, finding a good agreement with all of them.
Before concluding, we would like to point out some possible mechanisms responsible by the presence of heavy tail distributions and long-term correlations in the data. The first one is related to the fact that humans already have an intrinsic complex behavior which may manifest in our measurements. Second, these individuals form small interacting groups adding more complexity to the system. On a third level, there is also an emergence of interactions between groups. Naturally, more detailed measurements and models should be considered, in comparison with those one presented here, to obtain a broad understanding of this system.
References
References
- [1] Castellano C, Fortunato S and Severo V 2009 Rev. Mod. Phys. 81 591
- [2] Vandewalle N, Ausloos M, Boveroux P and Minguet A 1998 Eur. Phys. J. B 4 139
- [3] Peng C K, Buldyrev S V, Goldberger A L, Havlin A, Sciortino F, Simons M and Stanley H E 1992 Nature 356 168
- [4] Berg H C 1993 Random Walks in Biology (Princeton: Princeton University Press)
- [5] Picoli Jr S and Mendes R S 2008 Phys. Rev. E 77 036105
- [6] Ribeiro H V, Mendes R S, Malacarne L C, Picoli Jr S and Santoro P A 2010 Eur. Phys. J. B 75 327
- [7] Kinouchi O, Diez-Garcia R W, Holanda A J, Zambianchi P and Roque A C 2008 New J. Phys. 10 073020
- [8] Correa D C, Saito J H and Costa L F 2010 New J. Phys. 12 053030
- [9] Fortunato S and Castellano C 2007 Phys. Rev. Lett. 99 138701
- [10] Watts D J and Strogatz S H 1998 Nature 393 440
- [11] Newman M E J 2001 Phys. Rev. E 64 016131
- [12] Zhou T, Kiet H A T, Kim B J, Wang B H and Holme P 2008 EPL 82 28002
- [13] Oliveira J G and Barabási A L 2005 Nature 437 1251
- [14] Vazquez A 2007 Physica A 373 747
- [15] Barabási A L 2005 Nature 435 207
- [16] Brockmann D, Hufnagel L and Geisel T 2006 Nature 439 462
- [17] González M C, Hidalgo C A and Barabási A L 2008 Nature 453 779
- [18] Lambiotte R and Ausloos M 2005 Phys. Rev. E 72 066107
- [19] Lambiotte R and Ausloos M 2006 Eur. Phys. J. B 50 183
- [20] Auyang S Y 1998 Foundations of complex-systems (Cambridge: Cambridge University Press)
- [21] Jensen H J 1998 Self-organized criticality (Cambridge: Cambridge University Press)
- [22] Albert R and Barabási A L 2002 Rev. Mod. Phys. 74 47
- [23] Boccara N 2004 Modeling complex systems (New York: Springer-Verlag)
- [24] Sornette D 2006 Critical phenomena in natural sciences (Berlin: Springer-Verlag)
- [25] Kramer E M and Lobkovsky A E 1996 Phys. Rev. E 53 1465
- [26] Mendes R S, Malacarne L C, Santos R P B, Ribeiro H V and Picoli Jr S 2010 EPL 92 29001
- [27] Salminen L I, Tolvanen A I and Alava M J 2002 Phys. Rev. Lett. 89 185503
- [28] Sethna J P, Dahmen K A and Myers C R 2001 Nature 410 242
- [29] Minozzi M, Caldarelli G, Pietronero L and Zapperi S 2003 Eur. Phys. J. B 36 203
- [30] Voss R F and Clarke J 1975 Nature 258 317
- [31] Mendes R S, Ribeiro H V, Freire F C M, Tateishi A A and Lenzi E K Universal patterns in sound amplitudes of songs and music genres (not published).
- [32] Skagerstam B S K and Hansen A 2005 Europhys. Lett. 72 513
- [33] Vandewalle N, Lentz J F, Dorbolo S and Brisbois F 2001 Phys. Rev. Lett. 86 179
- [34] Alencar A M, Buldyrev S V, Majumdar A, Stanley H E and Suki B 2001 Phys. Rev. Lett. 87 088101
- [35] Bunde A, Eichner J F, Kantelhardt J W and Havlin S 2005 Phys. Rev. Lett. 94 048701
- [36] Yamasaki K, Muchnik L, Havlin S, Bunde A and Stanley H E 2005 Proc. Natl. Acad. Sci. U.S.A. 102 9424
- [37] Wang F, Yamasaki K, Havlin A and Stanley H E 2006 Phys. Rev. E 73 026117
- [38] Blender R, Fraedrich K and Sienz F 2008 Nonlinear Processes Geophys. 15 557
- [39] Santhanam M S and Kantz H 2008 Phys. Rev. E 78 051113
- [40] Peng C K, Buldyrev S V, Havlin S, Simons M, Stanley H E and Goldberger A L 1994 Phys. Rev. E 49 1685
- [41] Kantelhardt J W, Koscielny-Bunde E, Rego H H A, Havlin S and Bunde A 2001 Physica A 295 441
- [42] Ribeiro H V, Mendes R S, Lenzi E K, Belancon M P and Malacarne L C On the bubbles clouds dynamics in boiling water (not published).
- [43] Mantegna R N and Stanley H E 1999 An Introduction to Econophysics (Cambridge: Cambridge University Press).
- [44] Bollerslev T 1986 Econometrics 31 307
- [45] Engle R F 1982 Econometrica 50 987