Intrinsic and extrinsic x-ray absorption effects in soft x-ray diffraction from the superstructure in magnetite
Abstract
We studied the (00) diffraction peak in the low-temperature phase of magnetite (Fe3O4) using resonant soft x-ray diffraction (RSXD) at the Fe- and O- resonance. We studied both molecular-beam-epitaxy (MBE) grown thin films and in-situ cleaved single crystals. From the comparison we have been able to determine quantitatively the contribution of intrinsic absorption effects, thereby arriving at a consistent result for the (00) diffraction peak spectrum. Our data also allow for the identification of extrinsic effects, e.g. for a detailed modeling of the spectra in case a ”dead” surface layer is present that is only absorbing photons but does not contribute to the scattering signal.
pacs:
71.30.+h, 61.05.cpMagnetite, Fe3O4, shows a first order anomaly in the temperature dependence of the electrical conductivity at 120 K, the famous Verwey transition.Verwey (1939) It is accompanied by a structural phase transition from the cubic inverse spinel to a distorted structure. One usually connects this transition with charge ordering of the Fe2+ and Fe3+ ions on the octahedrally coordinated, so-called B-sites. In a recent diffraction study, Wright, Attfield and Radaelli found long-range charge order from the pattern of shorter and longer bond lengths between B-site iron and oxygen ions below . Wright et al. (2001, 2002) Subsequently, using this structure as input, local density approximation + Hubbard (LDA+) band structure studies have calculated the corresponding orbital ordering, which involves mainly the minority spin electron in the state of the 2+ B-sites. Leonov et al. (2004); Jeng et al. (2004)
Recently this orbital order has been studied using RSXD at the O () Huang et al. (2006) and Fe () Schlappa et al. (2008) resonance. The O- edge resonance enhancement of the (00) diffraction peak (notation refers to the cubic room-temperature unit cell) on an ex-situ polished bulk single crystal was interpreted by Huang et al. as a signature of a particular charge/orbital order at the oxygen-sites.Huang et al. (2006) At the Fe -edges, using MBE-grown thin films, the (00) maximum energy coincides with the resonance of the 2+ B-site ions and was assigned by Schlappa et al. to Fe -orbital order on these sites.Schlappa et al. (2008)
Very recently these results have been challenged. Wilkins and coauthors have presented RSXD data from the (00) peak [(001) in the orthorhombic notation used in Ref. Wilkins et al., 2009] of bulk magnetite at the O- and Fe- resonance.Wilkins et al. (2009). Their O- spectrum is similar to that of Huang et al.Huang et al. (2006) but their Fe- data are very different from those of Schlappa et al.Schlappa et al. (2008) Almost at the same time García et al.García et al. (2009) reported a Fe- RSXD spectrum from a bulk sample, which is very different from those of both Wilkins et al. and Schlappa et al.. In both recent publicationsWilkins et al. (2009); García et al. (2009) the shape of the respective Fe- spectra are explained by absorption effects. Presently, hence, at least three different Fe- RSXD spectra for the (00) peak of magnetite have been published and very different conclusions have been drawn about the electronic origin of the peak.
Here we report our efforts to resolve the confusion about the RXSD data on magnetite. Our strategy is to carry out the experiments using a magnetite bulk single crystal which was carefully cleaved in-situ in order to obtain the best possible surface quality, and to compare the results with the measurements on high quality MBE-grown magnetite thin films. In this manner we are able to distinguish intrinsic absorption effects from extrinsic effects. Taking intrinsic effects properly into account, we find consistent results for in-situ cleaved bulk samples and thin films. Furthermore, taking a so-called ”dead” surface into account, which leads to extrinsic absorption, we are able to provide a quantitative explanation for the varying RSXD spectra reported in the literature so far.
The soft x-ray scattering experiments were performed at the HZB beam line UE46-1 at BESSY using the two-circle UHV diffractometer designed at the Freie Universität Berlin. We used 40 nm thick magnetite films epitaxially grown on an epi-polished MgO(001) substrates and several magnetite bulk single crystals. The samples were oriented such that two base vectors of the cubic room-temperature unit cell ( Å) were parallel to the scattering plane. The polarization of incoming light was either parallel or perpendicular to the scattering plane (- or -polarization, respectively). A silicon-diode photon detector without polarization analysis was used with the angular acceptance set to 1∘ in the scattering plane and 5∘ perpendicular to it. The energy dependence of the diffraction-peak intensities (diffraction spectra) from the film sample were recorded by varying the photon energy and keeping the momentum transfer constant. For bulk samples this method leads to distorted spectra because of the much narrower peaks and refraction effects. We therefore performed longitudinal () scans at every photon energy and integrated the (00)-peak intensity.
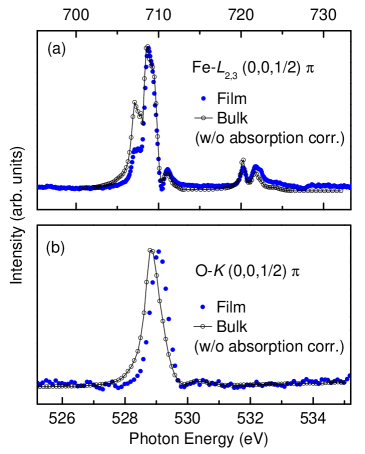
Fig. 1 displays the (00) resonance spectra at the Fe and at O -edges for bulk magnetite and magnetite thin film. One can observe very distinct differences between the bulk and the thin film. At the Fe edge, for example, the first peak at 707 eV is much more pronounced in the bulk than in the thin film. At the O edge, the energy position of the peak of the bulk is clearly shifted with respect to that of the thin film. We ascribe these differences to a change of the scattering volume due to variations of the penetration depth of the light as a function of its energy. This effect is quite severe for energy variations across resonances in the soft x-ray regime due to the very high photo-absorption coefficients. For a bulk sample, the scattered intensity in specular geometry is proportional to , with being the absorption coefficient. Als-Nielsen and McMorrow (2001) This absorption effect can be accounted for by multiplying the resonance spectra by ; can be reliably obtained from the x-ray absorption spectroscopy (XAS) signal recorded in the total electron yield mode.
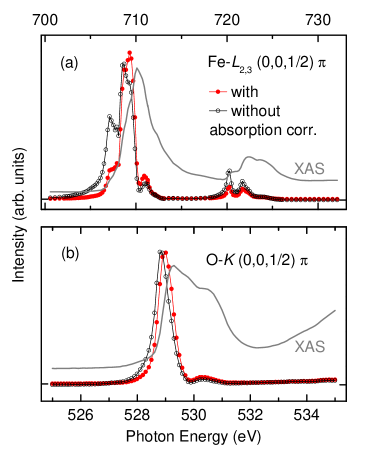
The effect of this correction is shown for bulk magnetite in Fig. 2 for both the Fe- and O- resonances. The open symbols are the raw data and the filled symbols are those after correction. The absorption signals are shown as solid lines. The correction for the Fe-spectrum affects mainly the relative intensities of the spectral features, while in the O-spectrum, the main peak, which is just on the slope of the absorption signal, becomes shifted in energy.
For a film of thickness the factor to correct for absorption effects is . describes the effective photon path length at incident angle . To perform this correction requires to know in absolute units. Because of the thinness of the films, the correction should be smaller than for the bulk.
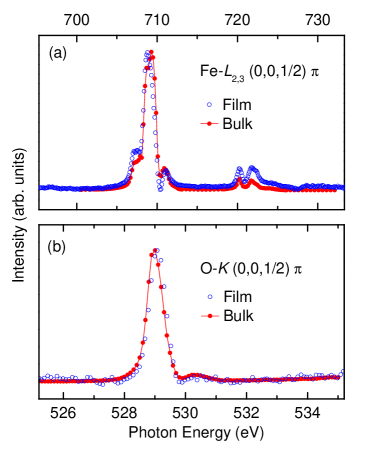
In Fig. 3 we now compare again the corrected spectra from the bulk (filled symbols) with the uncorrected film spectra as presented in Ref. Schlappa et al., 2008 (open symbols). For the O- spectra the agreement between bulk and film data is now close to perfect. Also for the Fe resonance the overall agreement between the spectra is very good, all spectral features agree. The main discrepancy here is in the relative intensities of the and part of the Fe-resonance spectra. The application of an absorption correction on also the thin film data would probably resolve much of this discrepancy. Thus, apart for this, we find very similar spectra from the film and the bulk at both resonances. We can, hence, safely conclude that the resonant diffraction data recorded from the thin film sample are representative for the material magnetite as such and that the conclusions derived from the data of magnetite thin films in our former Letter Schlappa et al. (2008) stand for the intrinsic properties of magnetite.
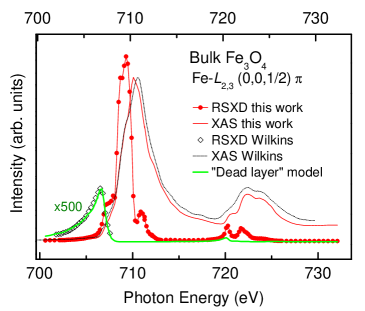
We now compare our experimental data with those from Huang et al.Huang et al. (2006), Wilkins et al.Wilkins et al. (2009), and García et al.García et al. (2009) from bulk magnetite. We first focus on the Fe -edges data. In Fig. 4 we present our data and those reproduced from the paper of Wilkins et al.Wilkins et al. (2009). The energy scales were aligned using the XAS data to account for small energy-scale offsets between different soft x-ray monochromators. The energy scale given at the top of Fig. 4 refers to the one used by Wilkins et al.Wilkins et al. (2009), and the bottom scale is the one of our experiment. It was claimed by Wilkins et al. that their data were strongly distorted by absorption effects, which suppressed all scattered intensity when the absorption increases. However, this cannot be the case because our raw data are already very different. In fact, it is quite unlikely that absorption in an otherwise intact sample can suppress the scattered intensity completely. com
What could cause such strong distortions, however, is a layer on top of the sample, which does absorb photons but does not contribute to the scattered signal. This could be either a polycrystalline layer or a crystalline layer with different surface orientation as the bulk or a layer of different chemical composition. That this ”dead” layer scenario is likely is demonstrated in Fig. 4. The diamond symbols are the experimental data from Wilkins et al.Wilkins et al. (2009) and the green thick solid line is a simulation in which we describe the presence of an absorbing layer of thickness by multiplying our experimental RSXD spectrum by with .
We find the best agreement between data and simulation for at the absorption maximum. The resulting spectrum reproduces not only the peak position but also the shape of the data from Wilkins et al.Wilkins et al. (2009) very well. We note that as compared to our experimental spectrum the green line has been multiplied by a factor 500; more than 99 percent of the intensity of the diffraction spectrum is taken away by the absorbing dead layer. Concerning the Fe data from García et al.García et al. (2009) we note that their (raw) data are closer to ours, although there are appreciable quantitative differences. It therefore appears likely that the effect of an absorbing dead layer is present also in their data, although of a much thinner one than in the work of Wilkins et al.Wilkins et al. (2009)
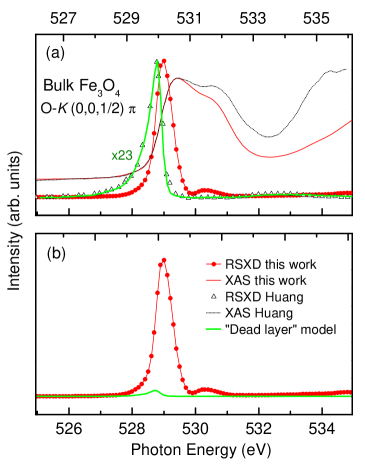
We now address the oxygen resonance spectra. Experimentally both in the papers by Wilkins et al.Wilkins et al. (2009) and Huang et al.Huang et al. (2006) a single resonance peak is observed, while our data show clearly a satellite 1.3 eV higher in energy. Huang et al. observe additionally a broad hump at about 4 eV higher photon energy, which is missing in our data. The 1.3-eV satellite occurs at energies where the absorption cross section is high and the filter effect discussed above for the Fe resonance may suppress this feature. Since no absorption data for energy reference are given by Wilkins et al.Wilkins et al. (2009) we focus on those from Huang et al.,Huang et al. (2006). In Fig. 5 (a) we reproduce the O- RSXD data from Huang et al.Huang et al. (2006). Again, we aligned the energy scales using the O- XAS spectra (thin/dotted lines). Since our experiment was performed with higher energy resolution, we broadened our experimental XAS data slightly to obtain the same energy resolution as in the experiment of Huang et al.Huang et al. (2006). On such a calibrated energy scale we find the resonance peak at a by 230 meV higher photon energy, i.e. much closer to the absorption maximum than Huang et al. did.
We have carried out the same simulation as in the Fe -edges analysis above for O -resonance as shown in Fig. 5 (a). The triangle symbols are the experimental data from Huang et al.Huang et al. (2006) and the green thick solid line is the simulation result. The resulting spectrum reproduces the main peak position and shape, and also contains the weak and broad hump at 4 eV above the main peak, i.e. a structure which is not present in the real spectrum and which is artificially generated by the local minimum in the absorption at that photon energy. In panel (b) we plot our original spectrum (red line and symbols) and the one generated by assuming an absorbing layer (green solid line) on the same vertical scale. One can also see how much intensity of the diffraction spectrum is taken away by the absorbing dead layer: more than 95 percent of the signal is gone. The shape of the spectrum of Huang et al.Huang et al. (2006) is completely destroyed, the 1.3-eV satellite is suppressed, and the 4-eV feature is artificially generated by the dead surface layer.
We note that assuming a photon mean free path () of about 1300 Å (a value proposed by Huang et al.Huang et al. (2006)) at the energy between 528 and 531 eV, and considering the detection geometry with photon incidence and detection angle around 45 degrees, we find a thickness of the ”dead” surface layer of about a quarter of a micrometer. A similar thickness comes out for the data of Wilkins et al.Wilkins et al. (2009) at the Fe- when we estimate the photon mean free path at the Fe- maximum based on our XAS data.
In summary, we have recorded RSXD spectra of the (00) peak at both Fe -edges and O -edge from in-vacuo cleaved magnetite single crystals, which essentially agree with those from magnetite thin films published earlier. We found that our spectra differ strongly from those published by Huang et al.Huang et al. (2006) and Wilkins et al.Wilkins et al. (2009), and to lesser extent, from García et al.García et al. (2009) We were able to ascribe the distortions in their spectra to extrinsic effects, namely the presence of a dead surface layer. Both our bulk and thin film data can hence be used for a reliable modeling of the charge and orbital ordering phenomena in magnetite.
We acknowledge BESSY for excellent working conditions and Eugen Weschke for the making his soft x-ray diffractometer available for the experiment. We thank Lucie Hamdan and the mechanical workshop of the II. Physikalische Institut for their skillful technical assistance. The research in Cologne is supported by the Deutsche Forschungsgemeinschaft through SFB 608 and by the BMBF through contract 05KS7PK1; work at BESSY by the BMBF through contract 05ES3XBA/5.
References
- Verwey (1939) E. J. W. Verwey, Nature (London) 144, 327 (1939).
- Wright et al. (2001) J. P. Wright, J. P. Attfield, and P. G. Radaelli, Phys. Rev. Lett. 87, 266401 (2001).
- Wright et al. (2002) J. P. Wright, J. P. Attfield, and P. G. Radaelli, Phys. Rev. B 66, 214422 (2002).
- Leonov et al. (2004) I. Leonov, A. N. Yaresko, V. N. Antonov, M. A. Korotin, and V. I. Anisimov, Phys. Rev. Lett. 93, 146404 (2004).
- Jeng et al. (2004) H.-T. Jeng, G. Y. Guo, and D. J. Huang, Phys. Rev. Lett. 93, 156403 (2004).
- Huang et al. (2006) D. J. Huang, H.-J. Lin, J. Okamoto, K. S. Chao, H.-T. Jeng, G. Y. Guo, C.-H. Hsu, C.-M. Huang, D. C. Ling, W. B. Wu, et al., Phys. Rev. Lett. 96, 096401 (2006).
- Schlappa et al. (2008) J. Schlappa, C. Schüßler-Langeheine, C. F. Chang, H. Ott, A. Tanaka, Z. Hu, M. W. Haverkort, E. Schierle, E. Weschke, G. Kaindl, et al., Phys. Rev. Lett. 100, 026406 (2008).
- Wilkins et al. (2009) S. B. Wilkins, S. Di Matteo, T. A. W. Beale, Y. Joly, C. Mazzoli, P. D. Hatton, P. Bencok, F. Yakhou, and V. A. M. Brabers, Phys. Rev. B 79, 201102(R) (2009).
- García et al. (2009) J. García, G. Subías, J. Herrero-Martín, J. Blasco, V. Cuartero, M. C. Sánchez, C. Mazzoli, and F. Yakhou, Phys. Rev. Lett. 102, 176405 (2009).
- Als-Nielsen and McMorrow (2001) J. Als-Nielsen and D. McMorrow, Elements of Modern X-ray Physics (Wiley, New York, 2001).
- (11) P. Abbamonte, private communication: For a single resonance the scattered intensity at the resonance maximum is proportional to , because the real part of the scattering amplitude, is zero at the resonance maximum and . The absorption effect, however, is linear in , which means that the observed intensity will still be finite and proportional to . While the actually probed linear combination of scattering amplitudes may weaken this simple argument, it is still very unlikely that absorption can reduce the scattered intensity to zero for a wide range of photon energies.