Current address: ]Riken, Advanced Science Institute, 2-1, Hirosawa,Saitama 351-0198, Japan Current address: ]Purdue University, West Lafayette, IN 47907 Current address: ]The University of Texas, Austin, TX 78712
Unequal Layer Densities in Bilayer Wigner Crystal at High Magnetic Field
Abstract
We report studies of pinning mode resonances of magnetic field induced bilayer Wigner crystals of bilayer hole samples with negligible interlayer tunneling and different interlayer separations , in states with varying layer densities, including unequal layer densities. With unequal layer densities, samples with large relative to the in-plane carrier-carrier spacing , two pinning resonances are present, one for each layer. For small samples, a single resonance is observed even with significant density imbalance. These samples, at balance, were shown to exhibit an enhanced pinning mode frequency [Zhihai Wang et al., Phys. Rev. Lett. 136804 (2007)], which was ascribed to a one-component, pseudospin ferromagnetic Wigner solid. The evolution of the resonance frequency and line width indicates the quantum interlayer coherence survives at moderate density imbalance, but disappears when imbalance is sufficiently large.
pacs:
I Introduction
In high magnetic field two parallel layers of two-dimensional electrons in close proximity have been shown to exhibit many-body states with distinct quantum properties that arise from the degree of freedom that identifies the layer. Explicit interlayer correlations are present in the fractional quantum Hall state at total Landau level filling (Suen-1992-PRL, ; Eisenstein-1992-PRL, ; Halperin-1983-ACTA, ; Yoshioka-1989-PRB, ; He-1991-PRB, ) as well as the celebrated bilayer excitonic condensate state at (Murphy-1994-PRL, ; lay94, ; Spielman-2000-PRL, ; Spielman-2001-PRL, ; Spielman-2004-PRB, ; eisnu1, ; tutucdrag, ; Yoshioka-1989-PRB, ; Fertig-1989-PRB, ; MacDonald-1990-PRL, ; He-1991-PRB, ). The excitonic condensate state is seen for small layer separation and an interlayer sufficiently large that interlayer tunneling is negligible. In the well-known language in which layer index is taken as pseudospin, the state is an easy-plane ferromagnet, and has carrier wave functions coherently distributed between the two layers. Imbalance tutucimbal ; wiersma , or unequal density for the two layers has been shown tutucimbal to strengthen the excitonic condensate state for moderate imbalance.
Bilayers, like single layer 2D carrier systems, become insulating at low enough , and in bilayers as in single layersmsreview , the low insulators are understood as pinned Wigner solids (suen92b, ; Suen-1994-SURF, ; Manoharan-1996-PRL, ; tutucimbal, ; faniel, ). Several different bilayer Wigner crystal (BWC) states have been predicted theoretically (Esfarjani-1995-JPHYS, ; zhengfertig, ; ho, ; peeters, ) for the balanced condition, in which the carrier densities of the two layers are equal, and without interlayer tunneling (the relevant case for samples considered in this paper). These phases depend on the relative strength of interlayer and intralayer carrier-carrier interactions, as determined by , where is the interlayer separation, and is the mean in-plane carrier spacing for total density . For the smallest , a one-component phase is predicted, which at each site of a triangular lattice has a carrier coherently present in both layers. The one-component lattice is an easy-plane pseudospin ferromagnetic BWC (FMBWC). At larger , without interlayer tunneling, the phases are two-component, with each layer having a lattice. The lattices are staggered with respect to each other, so the state is a pseudospin antiferromagnetic BWC (AFMBWC). Among these two-component staggered phases, a square lattice was predicted to cover a wide range of (zhengfertig, ; ho, ; peeters, ), though other phases, with rectangular or rhombic lattices, were also predicted (ho, ; peeters, ). For large , the intralayer interaction dominates, and each layer has a triangular lattice like that of a single layer Wigner crystal.
In both single layer murthyrvw ; yewc ; yongab ; clidensity and bilayer zhw ; doveston systems, the spectra of the pinned low solid exhibit striking resonances that are understood as pinning modes, in which pieces of the solid oscillate within the potential of the residual disorder. Useful information on the pinned solid is provided by the resonance: its frequency characterizes the strength of the pinning, and its integrated amplitude indicates the number of participating carriers.
This paper expands on our earlier work zhw , which exploited the pinning mode to characterize low BWC phases in samples at balance (with equal layer densities), using a series of p-type samples with essentially zero tunneling between layers, and different layer separations. As in the earlier paper, we use the parameter to characterize effective separation. The factor of is included in for comparison with the results Murphy-1994-PRL ; Spielman-2000-PRL ; Spielman-2001-PRL ; Spielman-2004-PRB ; eisnu1 ; tutucdrag on the excitonic Bose condensate, where is the magnetic length at total Landau filling for a balanced state. Our earlier paperzhw described the change in the pinning mode on changing the top and bottom layer densities, from a balanced state to a one-layer state , in order to capture the effects of interlayer interaction and correlation on the balanced state. We found, for low interlayer separation, , that the pinning mode resonance peak frequency, was enhanced above the value expected clidensity from the overall density, which determines the stiffness of the solid. We interpreted the results as consistent with these low samples being in an FMBWC phase at balance. The interpretation is based on theory yongtheory which explains an enhancement of specific to the FMBWC, in the presence of disorder that is correlated in the two layers.
In this paper we study the same series of samples with various , varying the layer densities to look at unbalanced states. We find that on small imbalance, the resonance does not split for samples with . For larger , the resonance does split into two peaks, one of which is mainly sensitive to the top layer density, the other to the bottom layer density. Moreover, the enhancement observed earlier in the at balance persists out to significant imbalance. We interpret these observations in the framework of FMBWC for low samples, and AFMBWC for higher samples.
| Wafer | (Å) | ||||
| Name | QHE | ||||
| 225 | 3.0 | 1.39 | yes | ||
| 225 | 3.85 | 1.57 | yes | ||
| 230 | 3.65 | 1.56 | yes | ||
| 260 | 3.05 | 1.61 | yes | ||
| 300 | 2.52 | 1.7 | no | ||
| 300 | 2.85 | 1.8 | no | ||
| 450 | 2.4 | 2.5 | no | ||
| 650 | 2.85 | 3.9 | no | ||
| 2170 | 5.25 | 18 | no |
II Experimental method
We present results from p-type GaAs/AlGaAs/GaAs double quantum wells (DQW) grown on (311)A substrates. Designed to suppress interlayer tunneling, pieces of the same wafers were studied in earlier dc measurements focusing on tutucdrag ; tutucimbal ; tutucdiss . Table 1 summarizes the DQW dimensions and densities. is the distance between the centers of the two QW’s, where is the barrier width, and Å is the width of each QW in all these samples. is the as-cooled top-layer density, taken for zero gate voltage. , to be discussed later, is the observed bottom-layer density, above which two pinning modes can be resolved in imbalanced states. M465 and M453 are asymmetrically doped on both sides of the DQW; all other samples have dopants only at the front of the DQW. The two lines for M440 correspond to two different cool downs, each with different . The interlayer barrier layer is AlAs for Å, but is a combination of AlAs and AlGaAs for Å.
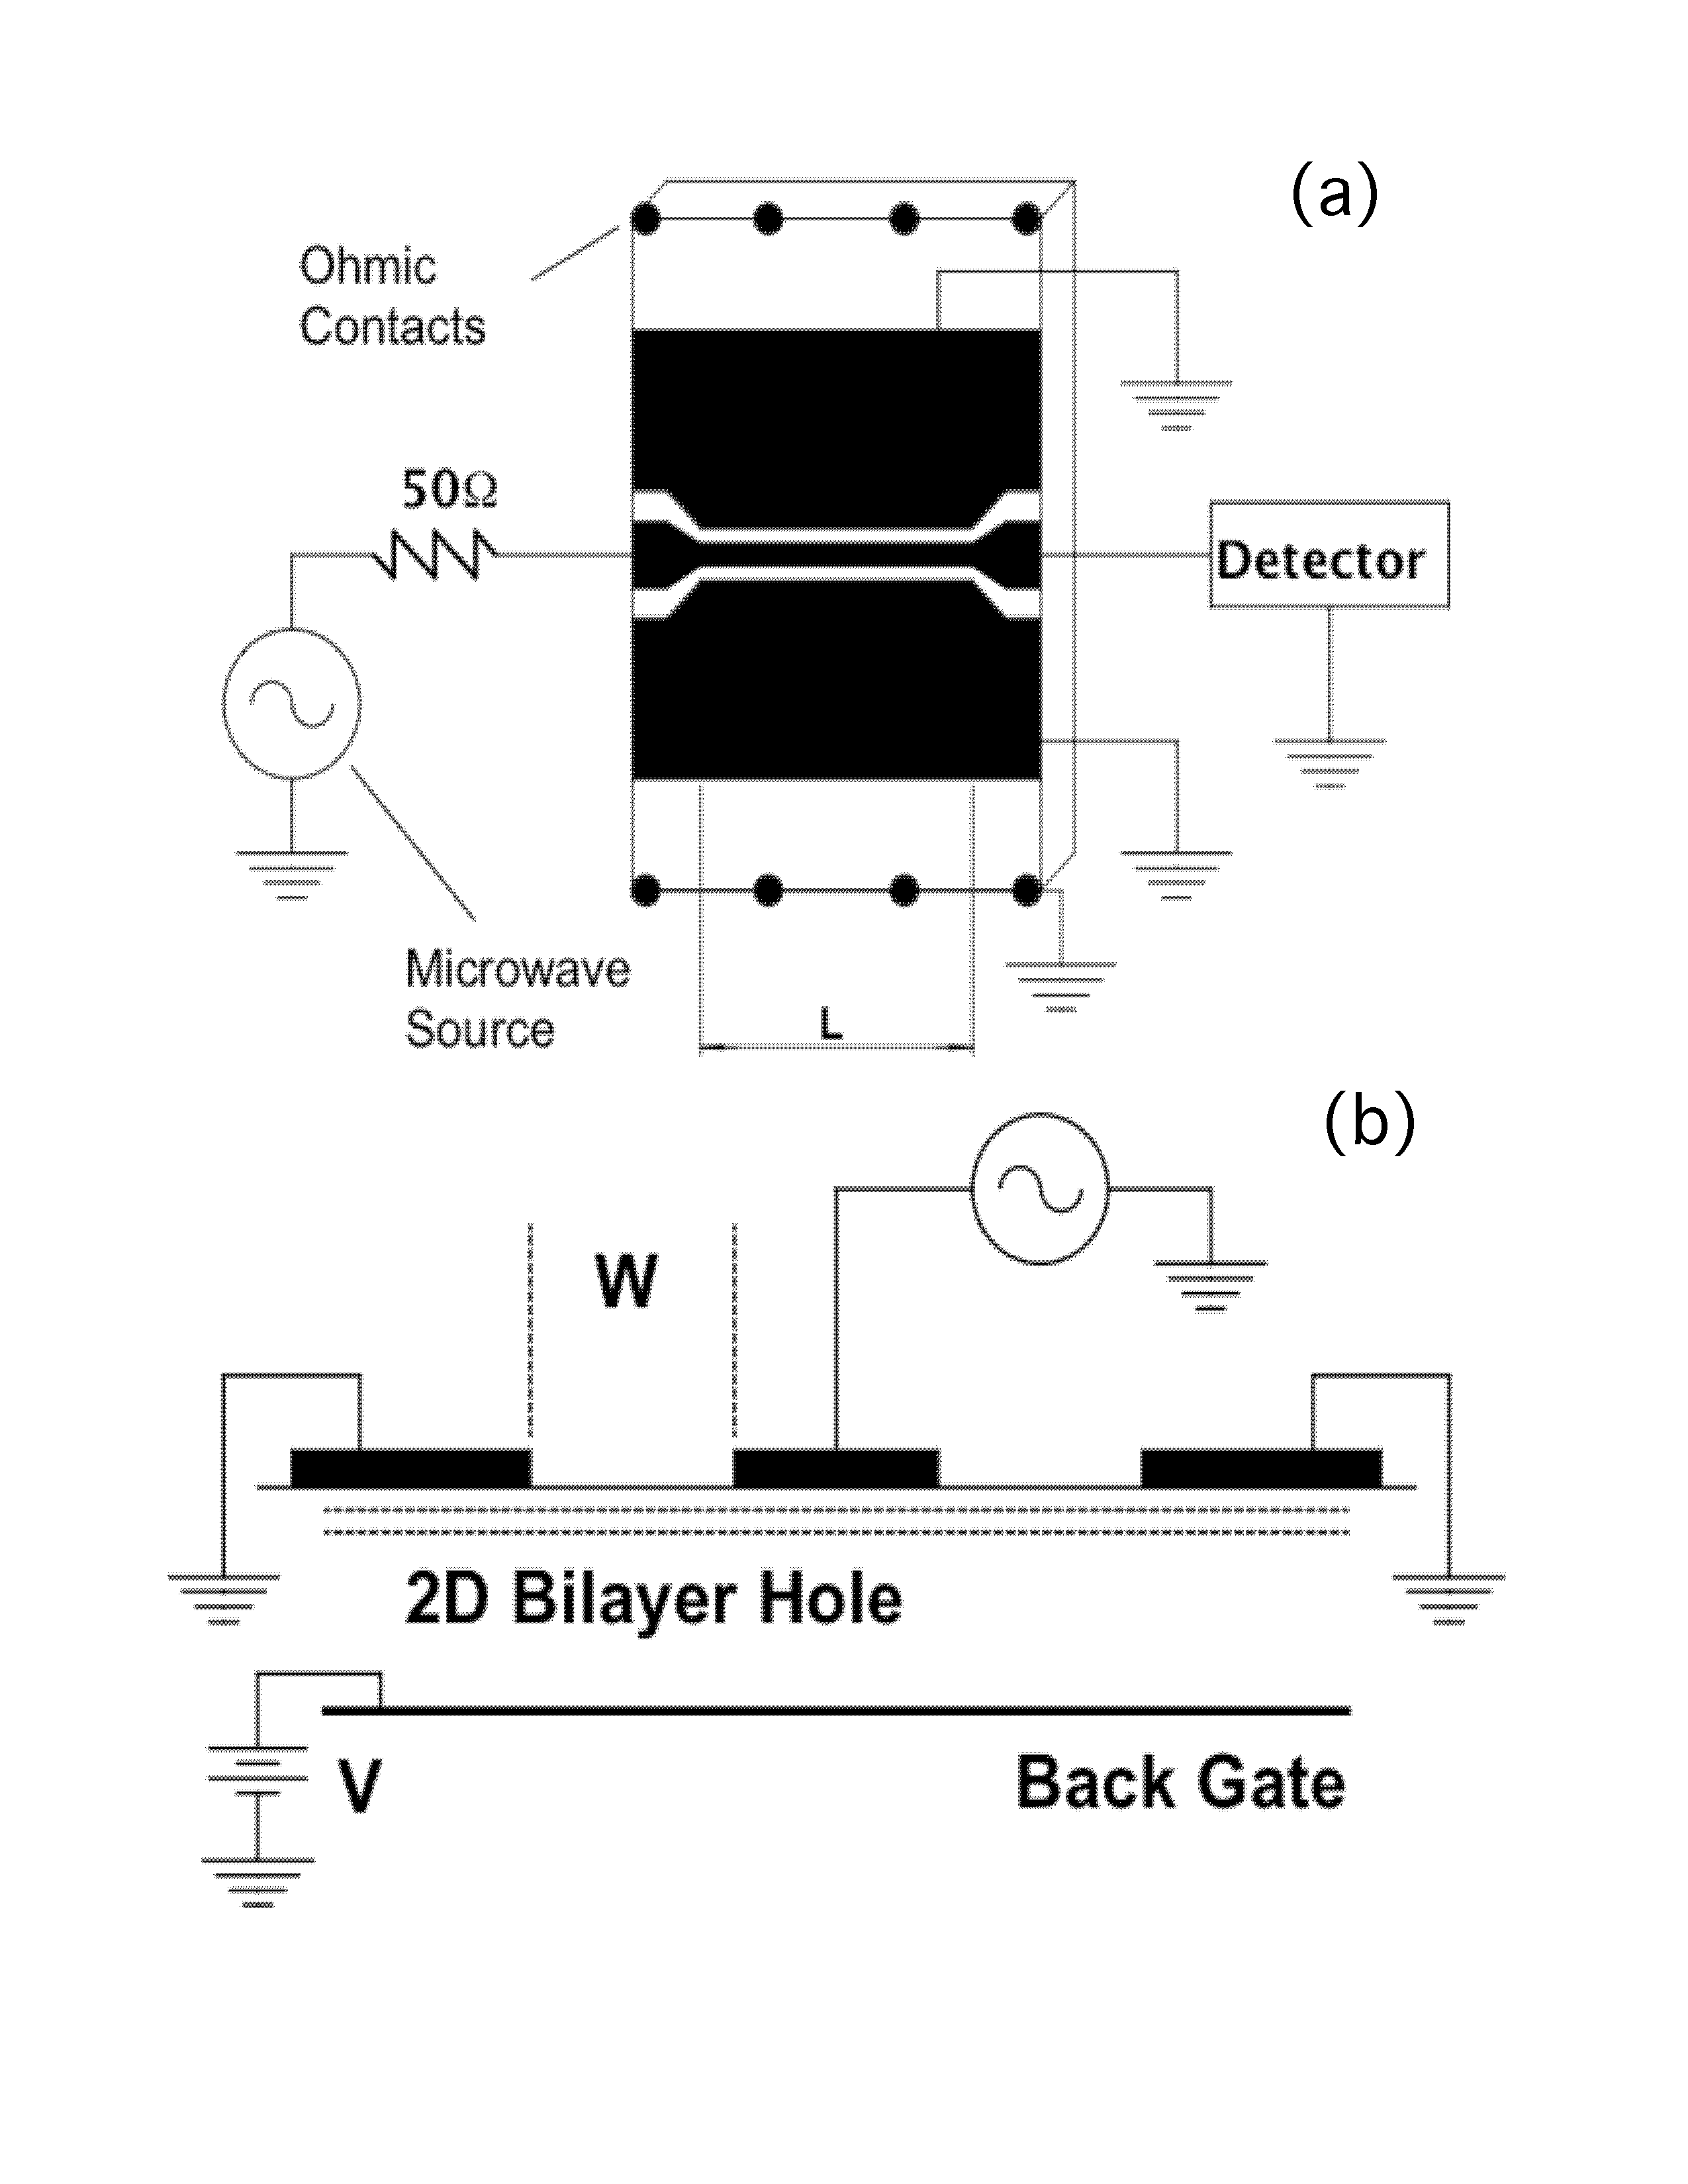
Our microwave measuring setup has been described in earlier publications murthyrvw ; clibdep ; yewc ; yongab ; clidensity . Figure 1 shows a schematic of a bilayer sample and the measuring circuit. A metal film transmission line on the top surface of the sample couples capacitively with the bilayer. The transmission line is of the coplanar waveguide type, with narrow, driven center conductor, separated from broad grounded side planes by slots of width . is small enough, and the operating frequency, , is high enough, that the response of the bilayer has small effect on the microwave electric field, so that this field is essentially the same in both layers. In this high-frequency, low-loss case, the in-plane microwave electric field is well-confined to the region of bilayer immediately under the slots, and we calculate Re, where is the transmitted power, is the transmitted power for a reference state in which bilayer conductivity is zero, is the characteristic impedance calculated from the transmission line geometry for , and is the length of the line. The data were obtained in the limit of low applied power; we verified that reducing power further did not affect the measured Re.
The samples have ohmic contacts on the edges, which connect the two layers together and allow gate biasing of the bilayer. The microwave measurement precludes a conventional front gate for independent control of top and bottom layer densities; such a gate in the slots of the coplanar waveguide would effectively short circuit the transmission line. Hence, unlike in bilayer dc transport studies such as in refs. Suen-1992-PRL ; Suen-1994-SURF ; Eisenstein-1992-PRL ; lay94 ; Manoharan-1996-PRL ; tutucdrag ; tutucimbal ; Murphy-1994-PRL ; Spielman-2000-PRL ; Spielman-2001-PRL ; Spielman-2004-PRB , we control the layer densities only by back gate bias relative to the bilayer. One consequence of this is that the only accessible balanced state is , and it is for this state that is calculated.
Determination of the top and bottom layer densities and is based on the position and behavior of IQHE minima in Re vs curves taken at 200 MHz. For the smaller samples (M440, M465, and M417), the integer quantum Hall effect (IQHE), including the QHE, is observed for several integer total filling factors , allowing the total density vs to be obtained. The balanced condition can be found easily from the development of the and IQHE’s , which are respectively weakest or strongest in the balanced state . and vs back gate voltage are found using a simple capacitive model, whose main parameter, , is the capacitance per unit area which relates change in to a change in through . In this model, both 2D layers are neglected when fully depleted but are considered as ideal conductors (large density of states) otherwise. The model has two cases: 1) , while is constant and equal to its as-cooled, unbiased value, , and 2) and . For the larger samples (M433, M436, M443, and M453), the top and bottom layer densities can be derived from the positions of the IQHE minima associated with individual layers, but only for ranges in which such minima are resolved. For outside of these ranges, the densities are estimated by extrapolation, also based on the capacitive model.
The capacitive model neglects kinetic energy and carrier interaction in the layers. For a hole bilayer with a backgate, when is nearly depleted, this can cause to increase slightly with increasing (or decreasing ), while decreases faster than linearly. This deviation from the capacitive model, referred to as carrier transfer, was studied Ying-1995-PRB ; Papadakis-1997-PRB ; Eisenstein-1994-PRB , and considered in the high insulating regime Eisenstein-1994-PRB . Carrier transfer does not affect the relationship of and , and does not affect the identification of the balanced state . Following calculations in refs. Ruden-1991-APL ; Katayama-1995-PRB , using a classical estimate of a single-layer Wigner crystal cohesive energy, and neglecting the kinetic energy since both layers are considered in the lowest Landau level, we find the capacitive model can underestimate the the at which the the bottom layer is completely depleted by as much as cm-2.
III Experimental Results
III.1 Large separation
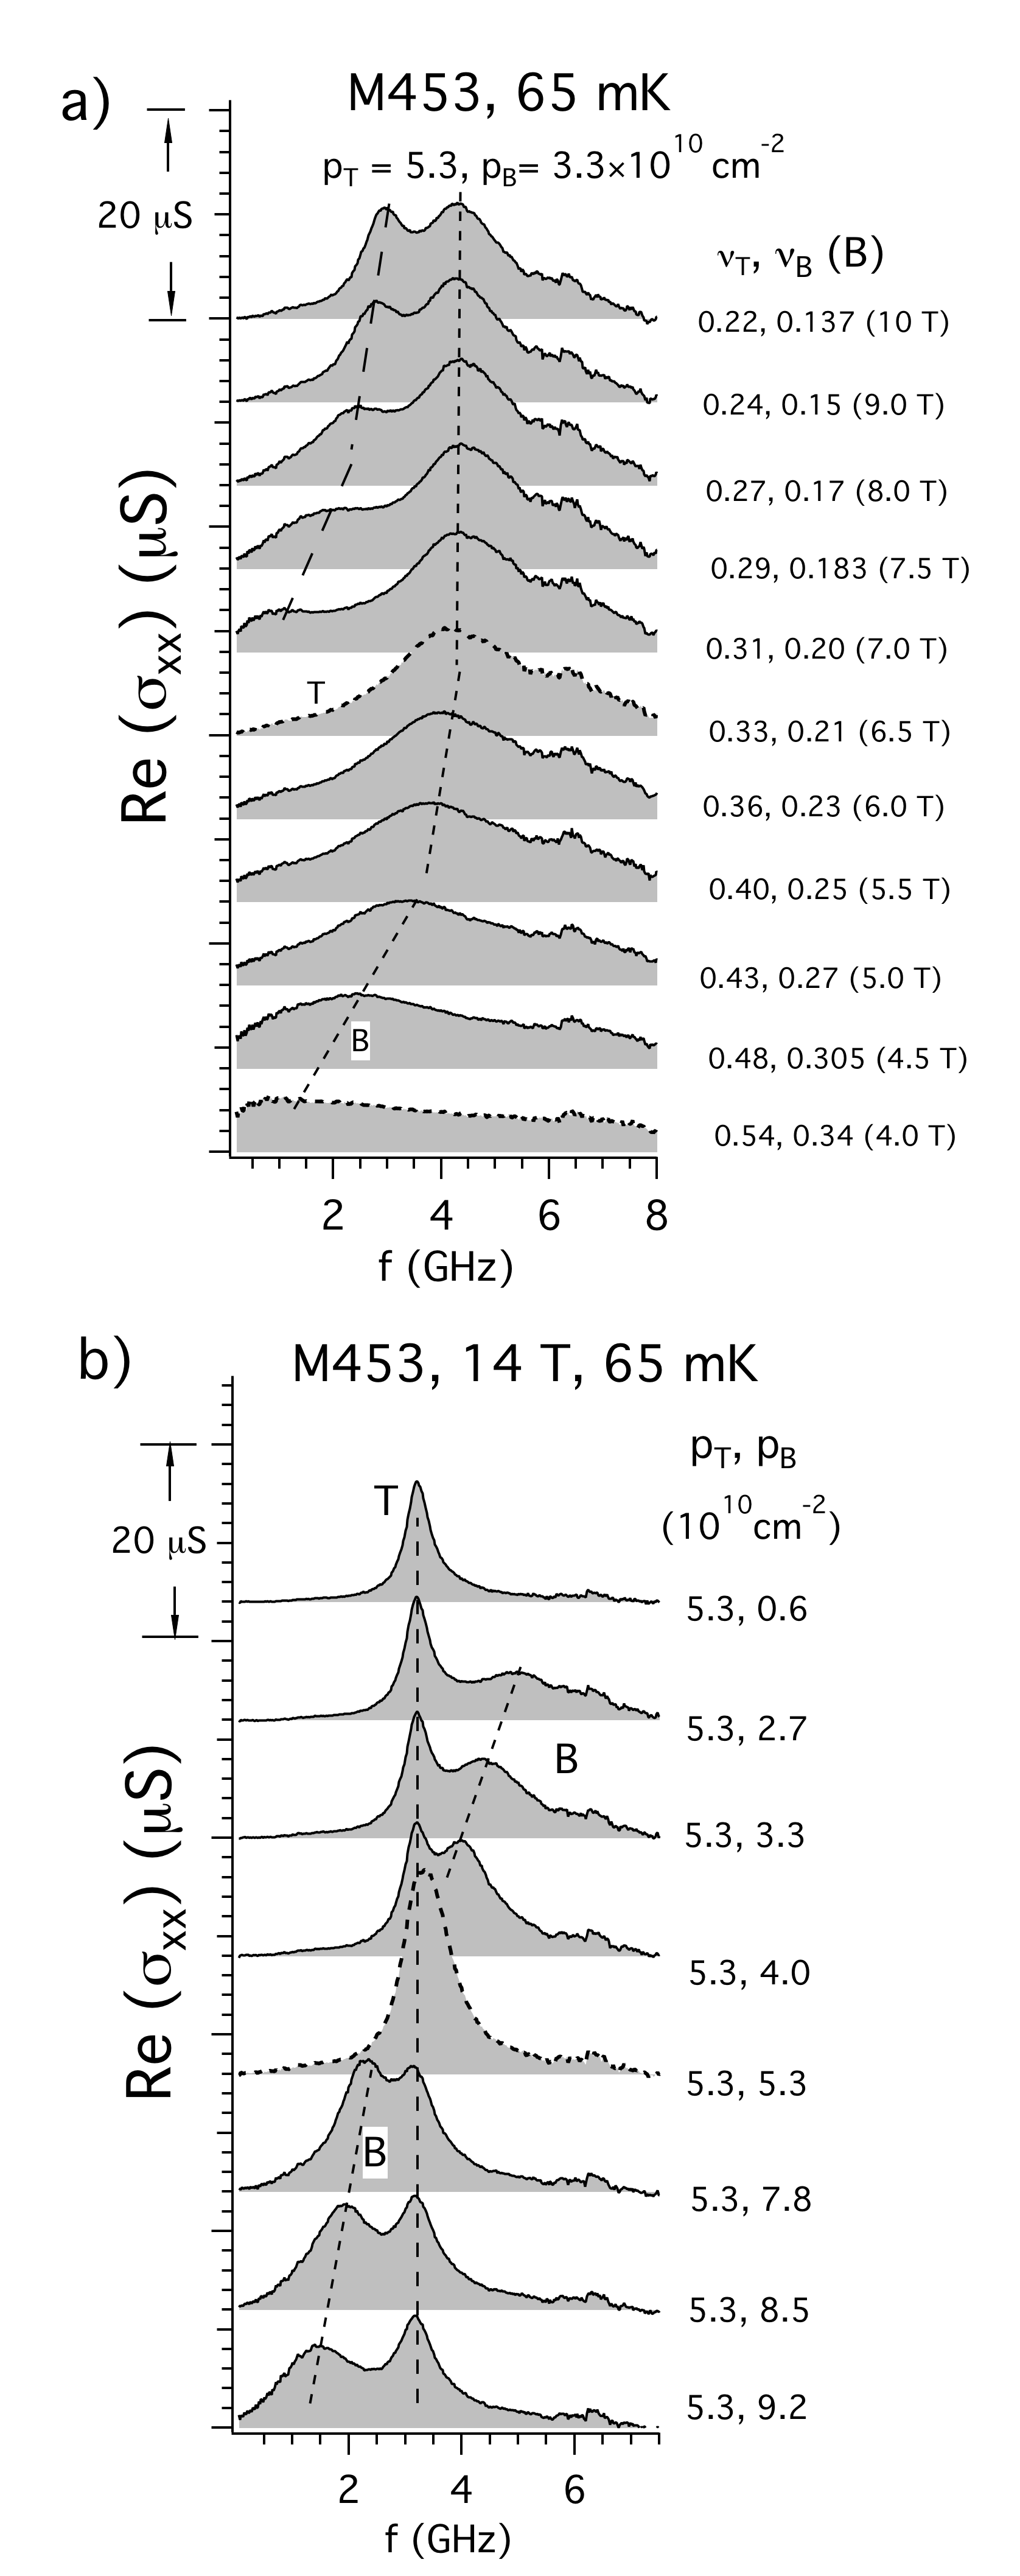
For the most widely separated samples, M453 and M443, we find two resolved pinning modes whenever there is significant , as long as the layer densities are not too close to balance. M453 represents the independent layer case, with Å and . Figure 2a shows spectra as increases for a state with layer densities cm-2. At high , two distinct peaks are visible in the spectrum, which are labeled “T” and “B” on the graph, since they are identified with the top and bottom layers of the sample. The peaks appear as the filling factor of the respective layer goes below about 0.3, consistent with an earlier study clibdep of pinning mode development in single-layer p-type samples. In the rest of this paper we are concerned only with this low solid regime, in which the pinning modes are well developed.
Figure 2b shows spectra of M453 at T in bilayer states with fixed and varying , as required by the experimental constraints discussed in the previous section. The behavior is consistent with the independent layer case and with the association of each resonances with a particular layer. Resonance T remains at fixed frequency and intensity as is varied, while resonance B increases in peak frequency, as is decreased. The B resonance vanishes as approaches zero, and the two resonances overlap for the balanced state.
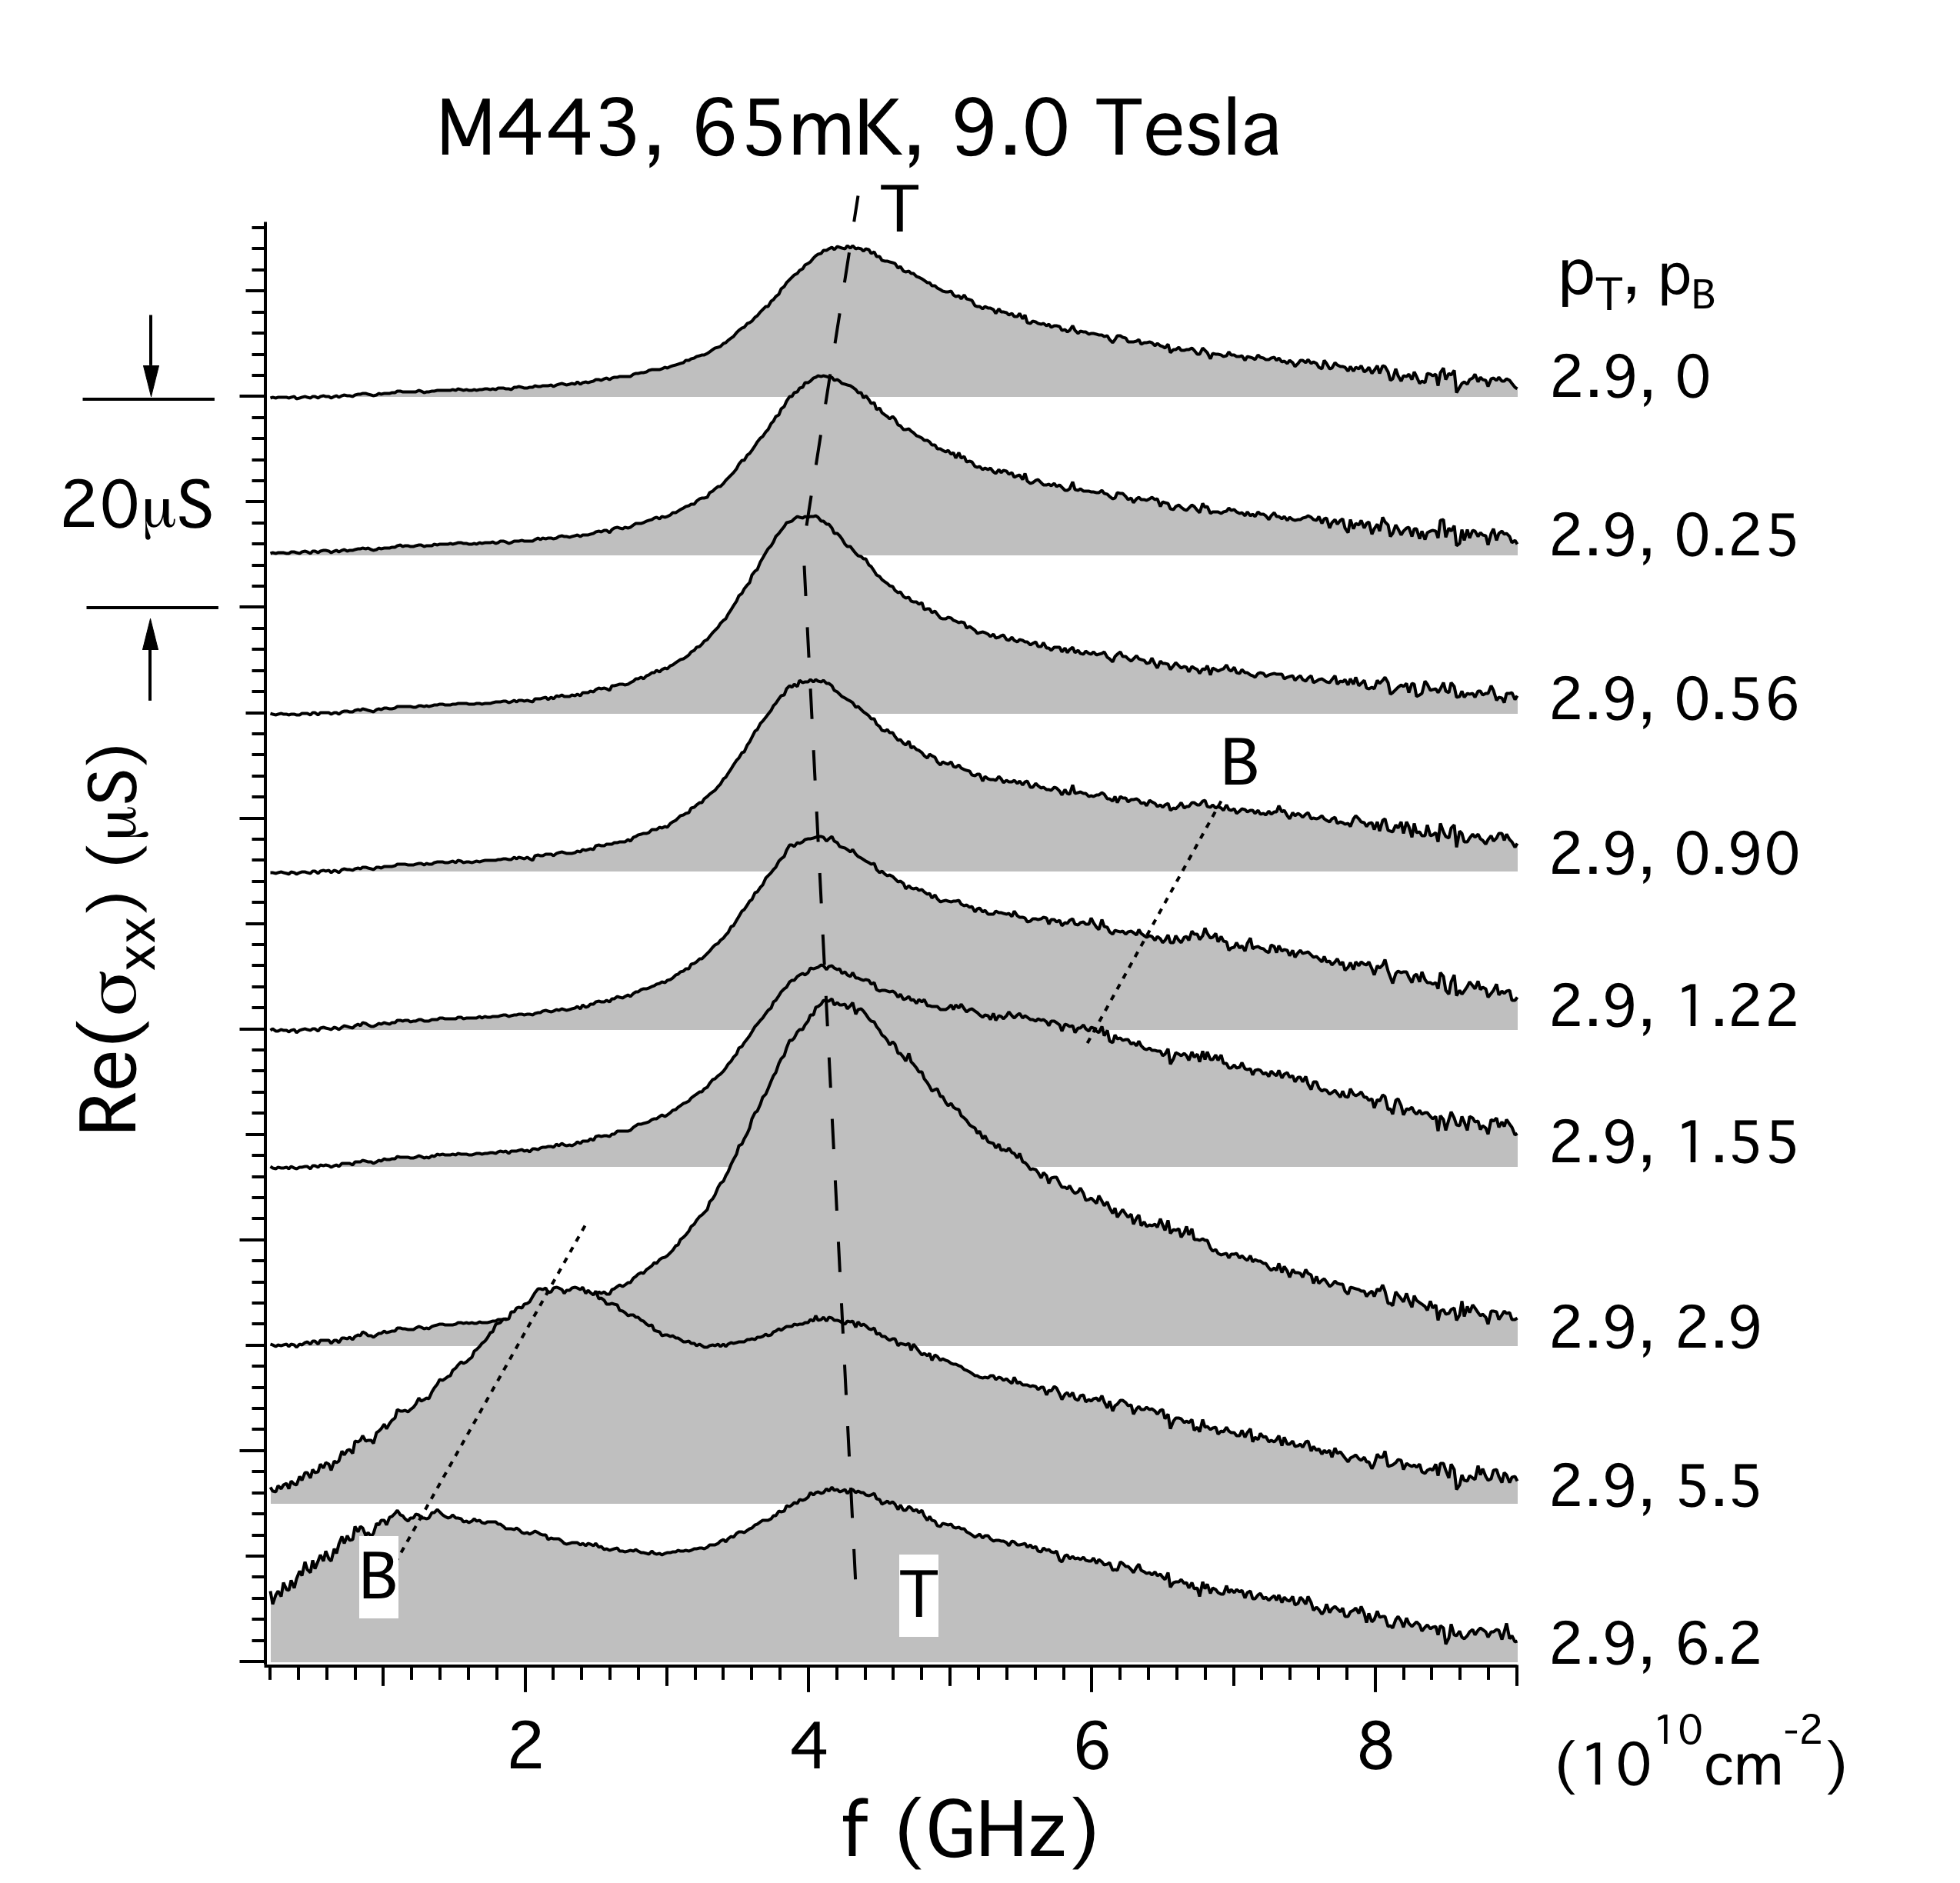
M443 has Å and , so its layers are more closely coupled than those of M453. Figure 3 shows a set of spectra with fixed and varying , for sample M443 at T. Again one resonance, which we label “B”, is much more sensitive to , but in this case the other resonance, which we label “T”, has a slight but measurable dependence, demonstrating that there is at least some dynamical coupling between the layers. For , resonance T dominates and resonance B shows as a high shoulder.
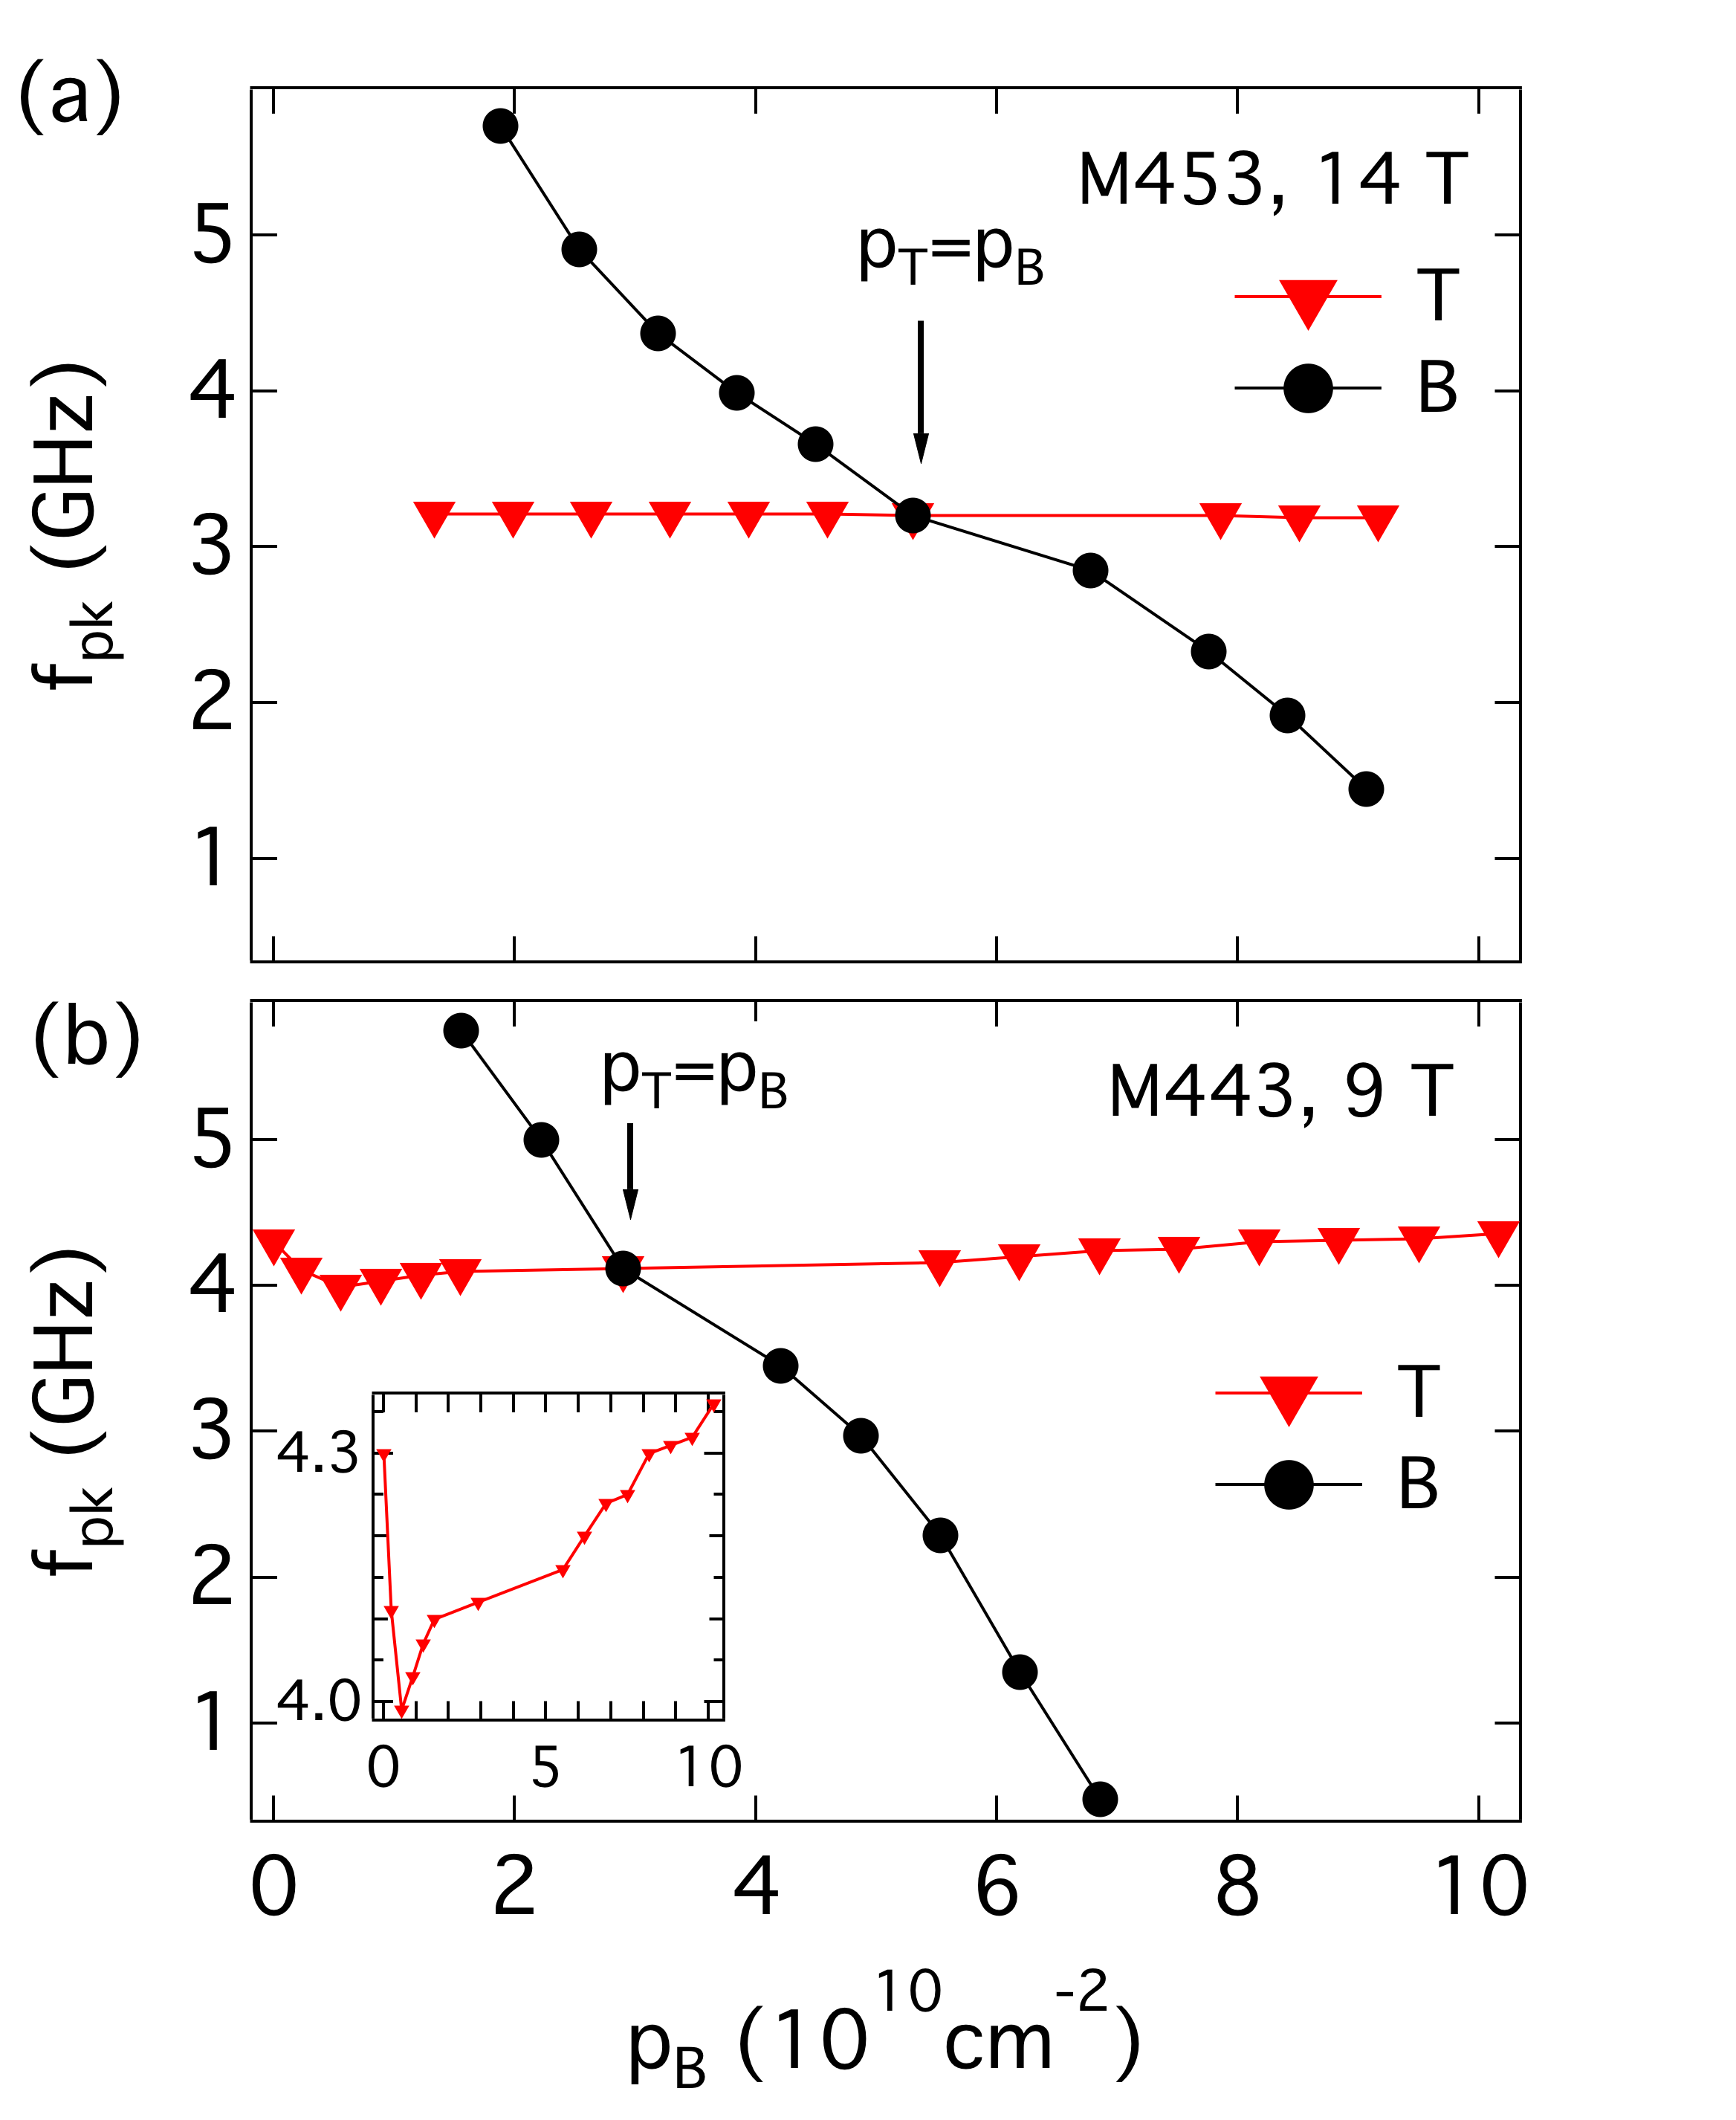
Figure 4 summarizes the data for M453 and M443, which have well-resolved pinning modes for all significant , as long as the bilayer is away from balance. The dependence of the T resonance peak frequency, , of M443 is most easily seen in the inset to Figure 4b. The evidence for coupling of the pinning modes is in the gradual decrease of as is decreased over most of its range. We ascribe the sharp rise of near on the plot to change in the top-layer density.
III.2 Smaller separations, transition to single pinning mode
Samples M417, M433, and M436, are in the intermediate range of in Table 1, and show two peaks only for above a threshold value, which is denoted by and is recorded in Table 1. The case of imbalance that is small, but sufficient () to resolve two resonances when they are present, can give information about the balanced states of the samples. The column in Table 1 indicates that for such small imbalance, samples with (including M433 and M417), keep a single pinning mode, while the samples with larger (including M436) show two distinct pinning modes.
III.3 Single pinning mode: dependence on layer densities
The smallest samples, M465 and M440, show only one pinning mode in all accessible bilayer states. Figure 5 shows spectra of M465 with , for several bilayer and single layer states, at T. The spectra are offset upward for clarity, so that the lowest spectrum on the graph is for the largest . The single resonance varies in peak frequency, width and intensity as is increased. The resonance appears sharpest just at balance, and the peak frequency has a local maximum for less than .
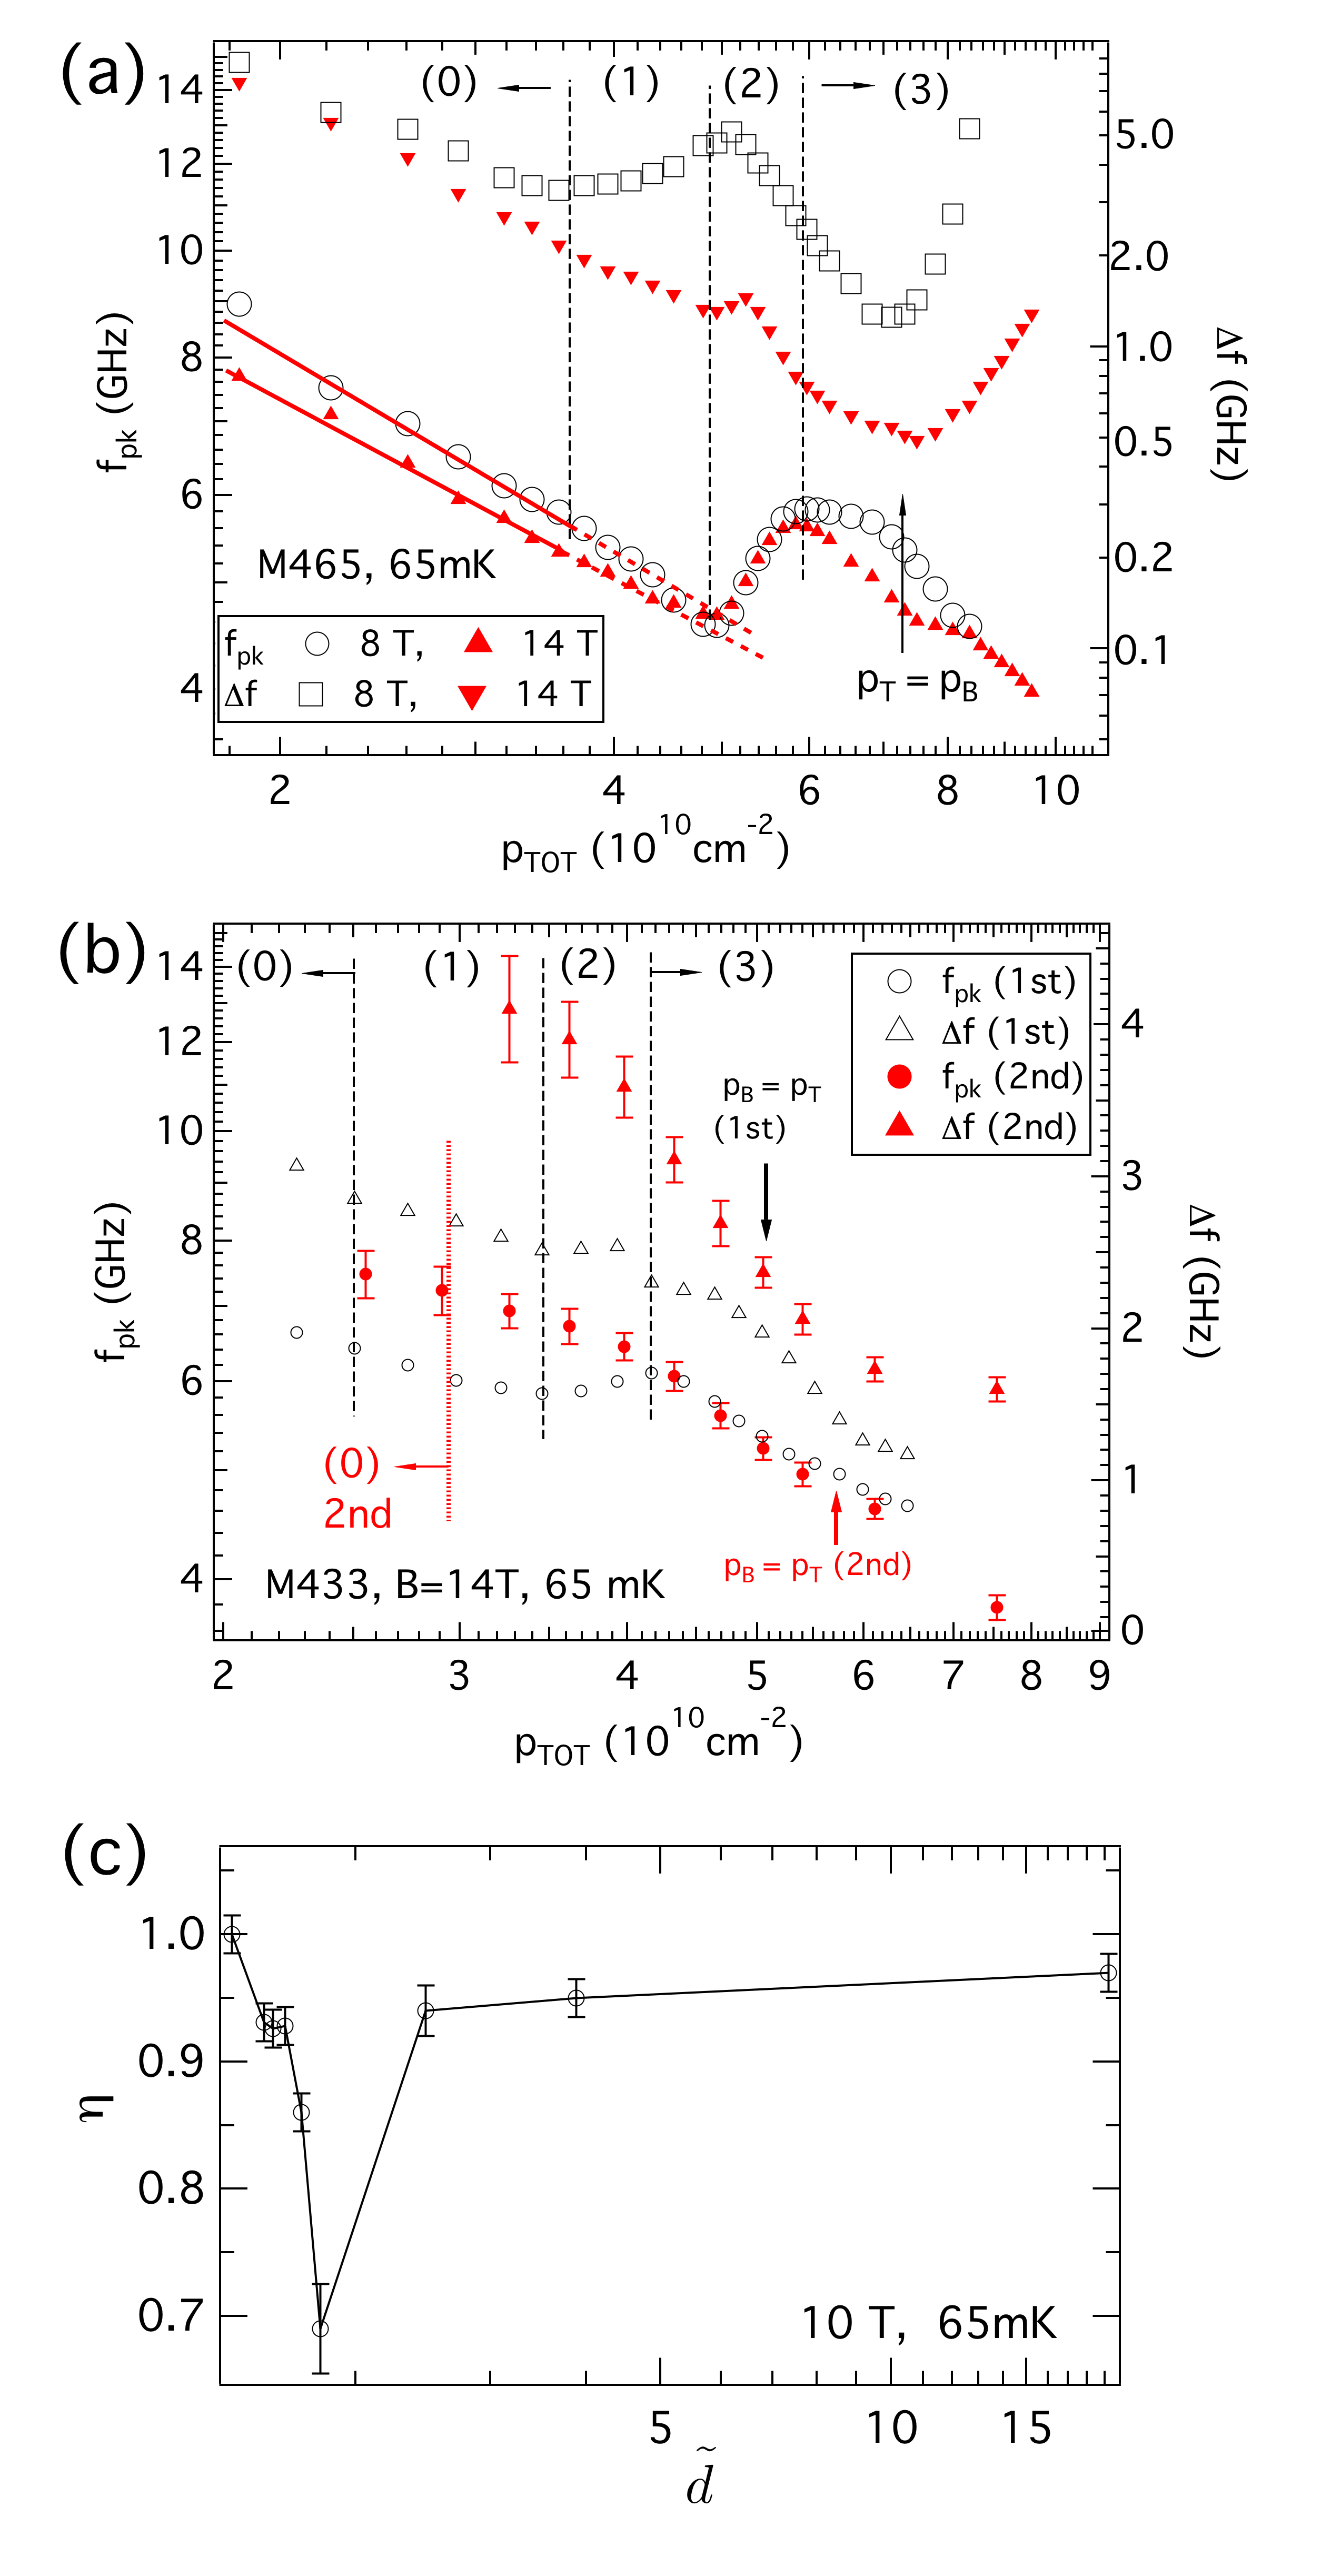
Figure 6a shows and full width at half maximum, , vs. for the resonances of M465, at two magnetic fields ( and T). For discussion, we mark regions of on the figure, as well as the balanced state . For in region (0), the sample has carriers only in the top layer, so , and . In region (0) and both increase as decreases, as was seen in earlier studies of the pinning modes of single layer samples (clidensity, ). vs in region (0) fits , producing the solid fit lines shown, with within a typical range of , also in agreement with ref. clidensity, .
When is in region (1), decreases with increasing , essentially extending the region (0) power law . The extrapolation of the power law is shown by dotted lines in Figure 6a. We do not rule out that owing to charge transfer, the system may remain a single layer with the true bottom-layer density remaining zero even through region (1), though the increase of the with , seen in the 8 T data, is not expected clidensity for a single layer system with increasing density.
At larger , goes through a minimum; region (2) refers to the large- side of the minimum, so has vs with positive slope. Within region (2) vs exhibits a local maximum. Region (3), which is characterized by vs again decreasing, includes the balanced state. In region (3), is markedly“pushed up” above the curve extrapolated from region (0), while shows a minimum at the balance point.
The spectra of the other low- samples M440 and M417 evolve similarly to those of M465, and exhibit the same regions and features in and vs .
Sample M433 has slightly larger , which varied from 1.7 to 1.8 between two cool downs, owing to slightly different as-cooled top-layer densities. The two values give significantly different behavior of and vs , as shown in Figure 6b. For of 1.7, the intermediate positive slope region (2) of vs is less prominent than it is for M465. decreases monotonically on increasing , and does not exhibit any clear feature in region (2) or at balance. For the slightly higher of 1.8, a region of vs. with positive slope is not observed, so that both and decrease monotonically on increasing .

.
IV Discussion
The interpretation of the data is in terms of two competing effects. The first effect is generic to pinning modes, including those in single layers, and is an increase of as the spacing of the interacting carriers increases. We will refer to it as the “carrier density effect”, since with larger carrier-carrier spacing (smaller density) hence decreased carrier-carrier interaction, the carriers must associate more closely with the minima in the disorder potential, causing average pinning energy and average restoring force per carrier, and , to increase. This behavior has been established theoretically flr ; chitra ; fogler ; fertig and experimentally clidensity in single layers. At fixed within the low carrier solid range, the experiments show , where is the single layer carrier density, and at low densities, but at higher density.
The power law is seen in vs in regions (0) and (1) in Figure 6, and within region (3) as well. In region (1), as shown in Figure 6a, vs. roughly follows the power law extrapolated from region (0). This behavior is explainable as due to the carrier-carrier interaction effect only and indicates that the pinning does not change dramatically from the single layer condition of region 0. This suggests that the carriers do not spread between the two layers, hence the pseudospin does not have an in-plane component.
The second effect is particular to BWCs, and is an enhancement of the pinning in FMBWC relative to other BWC pseudospin orders. One of us yongtheory suggested that when there are positional correlations between the effective disorders in the top and bottom layers there is an enhancement of by a factor of relative to the case of an AFMBWC in the low-separation limit. One possible natural source of such correlated disorder would be impurities which enable local interlayer tunneling. The amount of enhancement relative to the extrapolated carrier-density effect line was considered at balance in ref. zhw, . Balanced states were compared to states with nearly the same density in the top layer, but with the bottom layer depleted. The ratio of the pinning mode frequencies of these states is denoted by , which measures the change of pinning on “adding” the bottom layer. That reference presented a curve of vs , which is reproduced here as Figure 6c. The curve showed a sharp minimum for . The theory ho ; zhengfertig of the FMBWC for disorder-free, balanced bilayers predicts FMBWC for below about , considerably below the at which we see enhancement of pinning experimentally. One possible explanation of this discrepancy is that the FMBWC is being stabilized over competing BWC phases by its enhanced pinning.
Within region (3), for example in Figure 6a, decreases on increasing , consistent with the carrier density effect. Overall though, vs. in region (3) is markedly enhanced above the curve extrapolated from the single layer region (0). The upward displacement shows the pinning is enhanced relative to the pinning of single layer Wigner solid seen in region (0) and possibly region (1), after these are corrected for the carrier density effect. The enhanced pinning persists, under an imbalance as large as . The 8 and 14 T data in Figure 6 both show the enhancement, with the 8 T enhancement slightly larger around the balanced state. This remains consistent with both fields being sufficient to produce well developed BWC solids; the differences between the 8 and 14 T curves may involve the dependence of effective disorder—which incorporates the in-plane extent of a carrier wave function—on the magnetic lengthyewc .
The “pushed up” region (3) is observed only for states on the low side of the minimum in Figure 6c. We interpret the enhancement in this region as due to FMBWC formation, as was presented for the balanced case in Ref. zhw, , but also extending into imbalanced states. This is possible since even within an FMBWC, the carrier wave function may not spread equally in the two layers. In pseudospin language, this would also mean that at least some pseudospins have an in-plane component, and the orientation of the pseudospins changes with density imbalance. Within region (3), shows no sharp feature at balance, but does exhibit a minimum just at balance. This suggests an imbalance-induced effect, which increases damping of the resonance without affecting pinning. Based on the classification of BWC at balance, this damping is present only when the BWC at balance is an easy-plane ferromagnet. The damping may result from excess carriers of the majority layer, which we speculate may act as defects, or could themselves form a condensed phasekunimbal .
Region (2) can be interpreted as a transition between between region (1) with pinning of individual layers (smaller ) and region (3) with enhanced pinning (larger ). The local maximum, which is observed in the middle of region (2), could then be interpreted as due to a transition between different BWC phases. At the transition region, multiple BWC phases can in principle coexist. The broadening effect possibly originates from dissipative excitations that are associated with the phase boundaries. This picture is strengthened by the data on M433 in Figure 6b which show no local maximum. For M433, which has , enhancement in region (3) is much less than that in M465, which has lower . Instead, for M433 decreases on increasing , which can be interpreted as due to the carrier density effect.
An alternate explanation of the enhancement of around balance in region (3) in Figure 6a (and the minimum in vs in Figure 6c) is that there is an increase in due to softening of the BWC. Such softening might occur around a phase transition from one type of BWC to another, since near a transition many carrier arrangements have similar energies. The data in Figure 6a are difficult to reconcile to this picture, in which region (3) rather than region (2) would be identified with a transition, since the maximum in occurs in region (2), and a minimum in occurs in region (3). If softening of the solid occurs at a phase transition, one would naturally expect more damping at the transition, contrary to the data.
The behavior of the samples at small imbalance (small but sufficient to resolve the two pinning modes of the independent layer case) is a strong indication that a balanced sample would go though a phase transition as goes below 1.8 (the minimum in Figure 6c). For there is only one resonance at small imbalance, while for the resonance splits.
In summary, by studying the peak frequency in the imbalanced states, we found that the enhanced pinning exists not only at balance, but also over a considerable range of imbalanced states (around the balance) for low- bilayers. In addition, the small-separation samples that show the enhanced pinning do not exhibit a splitting of the pinning mode when the layer densities are subject to small imbalance. The interpretation is in terms of a pseudospin FMBWC, present at balance but persisting even for considerable imbalance.
This work was supported by DOE Grant Nos. DE-FG21-98-ER45683 and DE-FG02-00-ER45841 at Princeton, and DE-FG02-05-ER46212 at NHMFL. NHMFL is supported by NSF Cooperative Agreement No. DMR-0084173, the State of Florida and the DOE.
References
- (1) Y. W. Suen, L. W. Engel, M. B. Santos, M. Shayegan, and D. C. Tsui, Phys. Rev. Lett. 68, 1379 (1992); Y. W. Suen, H. C. Manoharan, X. Ying, M. B. Santos, and M. Shayegan, Phys. Rev. Lett. 72 3405 (1994).
- (2) J. P. Eisenstein, G. S. Boebinger, L. N. Pfeiffer, K. West, and S. He, Phys. Rev. Lett. 68, 1383 (1992).
- (3) B. I. Halperin, Helv. Phys. Acta 56, 75 (1983).
- (4) D. Yoshioka, A. H. MacDonald, and S. M. Girvin, Phys. Rev. B 39, 1932 (1989).
- (5) S. He, X. C. Xie, S. Das Sarma, and F. C. Zhang, Phys. Rev. B 43, 9339 (1991).
- (6) S. Q. Murphy, J. P. Eisenstein, G. S. Boebinger, L. N. Pfeiffer, and K. West, Phys. Rev. Lett. 72, 728 (1994).
- (7) T. S. Lay, Y. W. Suen, H. C. Manoharan, X. Ying, M. B. Santos, and M. Shayegan, Phys. Rev. B 50, 17725 (1994).
- (8) I. B. Spielman, J. P. Eisenstein, L. N. Pfeiffer, and K. West, Phys. Rev. Lett. 84, 5808 (2000).
- (9) I. B. Spielman, J. P. Eisenstein, L. N. Pfeiffer, and K. West, Phys. Rev. Lett. 87, 036803 (2001).
- (10) I. B. Spielman, M. Kellogg, J. P. Eisenstein, L. N. Pfeiffer, and K. West, Phys. Rev. B 70, 081303 (2004).
- (11) M. Kellogg, J. P. Eisenstein , L. N. Pfeiffer, and K. W. West, Phys. Rev. Lett. 93, 036801 (2004).
- (12) E. Tutuc, M. Shayegan, and D. A. Huse, Phys. Rev. Lett. 93, 036802 (2004).
- (13) H. A. Fertig, Phys. Rev. B 40, 1087 (1989)
- (14) A. H. MacDonald, P. M. Platzman, and G. S. Boebinger, Phys. Rev. Lett. 65, 775 (1990).
- (15) Y. W. Suen, M. B. Santos, and M. Shayegan Phys. Rev. Lett. 69, 3551 (1992).
- (16) Y. W. Suen, H. C. Manoharan, X. Ying, M. B. Santos and M. Shayegan, Surf. Sci. 305, 13 (1994).
- (17) H. C. Manoharan, Y. W. Suen, M. B. Santos, and M. Shayegan, Phys. Rev. Lett. 77, 1813 (1996).
- (18) E. Tutuc, S. Melinte, E. P. De Poortere, R. Pillarisetty, and M. Shayegan, Phys. Rev. Lett. 91, 076802 (2003).
- (19) R. D. Wiersma, J. G. Lok, S. Kraus, W. Dietsche, K. von Klitzing, D. Schuh, M. Bichler, H.-P. Tranitz, and W. Wegscheider, Phys. Rev. Lett. 93, 266805 (2004).
- (20) M. Shayegan, in Perspectives in Quantum Hall Effects (edited by S. Das Sarma and A. Pinczuk), 343 ( Wiley Interscience, New York, 1997).
- (21) S. Faniel, E. Tutuc, E. P. De Poortere, C. Gustin, A. Vlad, S. Melinte, M. Shayegan, and V. Bayot, Phys. Rev. Lett. 94, 046802 (2005).
- (22) K. Esfarjani and Y. Kawazoe, J. Phys. Condens. Matter 7, 7217 (1995).
- (23) Lian Zheng, and H. A. Fertig, Phys. Rev. B 52, 12282 (1995).
- (24) Subha Narasimhan, and Tin-Lun Ho, Phys. Rev. B 52, 12291 (1995).
- (25) G. Goldoni, and F. M. Peeters, Phys. Rev. B 53, 4591 (1996); I. V. Schweigert, V. A. Schweigert, and F. M. Peeters, Phys. Rev. B, 60, 14665 (1999).
- (26) G. Sambandamurthy, Zhihai Wang, R.M. Lewis, Yong P. Chen, L.W. Engel, D.C. Tsui, L.N. Pfeiffer and K.W. West, Solid State Commun. 140, 100 (2006) contains a brief review.
- (27) C. C. Li, L. W. Engel, D. Shahar, D. C. Tsui, and M. Shayegan, Phys. Rev. Lett. 79, 1353 (1997).
- (28) C. C. Li, J. Yoon, L. W. Engel, D. Shahar, D. C. Tsui, and M. Shayegan, Phys. Rev. B 61, 10905 (2000).
- (29) P. D. Ye, L. W. Engel, D. C. Tsui, R. M. Lewis, L. N. Pfeiffer, and K. West, Phys. Rev. Lett. 89, 176802 (2002).
- (30) Y. P. Chen, R. M. Lewis, L. W. Engel, D. C. Tsui, P. D. Ye, Z. H. Wang, L. N. Pfeiffer, and K. West, Phys. Rev. Lett. 93, 206805 (2004).
- (31) Zhihai Wang, Yong P. Chen, L. W. Engel, D. C. Tsui, E. Tutuc, and M. Shayegan, Phys. Rev. Lett. 99, 136804 (2007)
- (32) J. B. DovestonJ. B. Doveston, S. Djordjevic, R. B. Dunford, C. J. Mellor, F. I. B. Williams, M. Henini, Physica E 12 , 296 (2002).
- (33) Yong P. Chen, Phys. Rev. B 73, 115314 (2006).
- (34) E. Tutuc, Ph.D Thesis, Department of Physics, Princeton University 2004.
- (35) X. Ying, S. R. Parihar, H. C. Manoharan, and M. Shayegan, Phys. Rev. B 52, 11611 (1995).
- (36) S. J. Papadakis, J. P. Lu, M. Shayegan, S. R. Parihar, and S. A. Lyon, Phys. Rev. B 55, 9294 (1997).
- (37) J. P. Eisenstein, L. N. Pfeiffer, and K. W. West, Phys. Rev. B 50, 1760 (1994).
- (38) P. P. Ruden, and Z. Wu, Appl. Phys. Lett. 59, 2165 (1991).
- (39) Y. Katayama, D. C. Tsui, H. C. Manoharan, S. Parihar, and M. Shayegan, Phys. Rev. B 52, 14817 (1995).
- (40) H. Fukuyama, and P. A. Lee, Phys. Rev. B 18, 6245 (1978).
- (41) R. Chitra, T. Giamarchi, and P. Le Doussal, Phys. Rev. Lett. 80, 3827 (1998); R. Chitra, T. Giamarchi, and P. Le Doussal, Phys. Rev. B 65, 035312 (2001).
- (42) M. M. Fogler, and D. A. Huse, Phys. Rev. B 62, 7553 (2000).
- (43) H. A. Fertig, Phys. Rev. B 59, 2120 (1999).
- (44) Kun Yang, Phys. Rev. Lett. 87 056802 (2001).