Unraveling the Nature of Unidentified High Galactic Latitude Fermi/LAT Gamma-ray Sources with Suzaku
Abstract
Here we report on the results of deep X-ray follow-up observations of four unidentified -ray sources detected by the Fermi/LAT instrument at high Galactic latitudes using the X-ray Imaging Spectrometers on-board the Suzaku satellite. All of the studied objects were detected with high significance during the first 3-months of Fermi/LAT operation, and subsequently better localized in the first Fermi/LAT catalog (1FGL). For some of them, possible associations with pulsars and active galaxies have subsequently been discussed, and our observations provide an important contribution to this debate. In particular, a bright X-ray point source has been found within the confidence error circle of 1FGL J1231.1–1410. The X-ray spectrum of the discovered Suzaku counterpart of 1FGL J1231.1–1410 is well fitted by a blackbody with an additional power-law component. This supports the recently claimed identification of this source with a millisecond pulsar PSR J1231–1411. For the remaining three Fermi objects, on the other hand, the performed X-ray observations are less conclusive. In the case of 1FGL J1311.7–3429, two bright X-ray point sources were found within the LAT 95% error circle. Even though the X-ray spectral and variability properties for these sources were robustly assessed, their physical nature and relationship with the -ray source remain uncertain. Similarly, we found several weak X-ray sources in the field of 1FGL J1333.2+5056, one coinciding with the high-redshift blazar CLASS J1333+5057. We argue that the available data are consistent with the physical association between these two objects, although the large positional uncertainty of the -ray source hinders a robust identification. Finally, we have detected an X-ray point source in the vicinity of 1FGL J2017.3+0603. This Fermi object was recently suggested to be associated with a newly discovered millisecond radio pulsar PSR J2017+0603, because of the spatial coincidence and the detection of the -ray pulsations in the light curve of 1FGL J2017.3+0603. Interestingly, we have detected the X-ray counterpart of the high-redshift blazar CLASS J2017+0603, located within the error circle of the -ray source, while we were only able to determine an X-ray flux upper limit at the pulsar position. All in all, our studies indicate that while a significant fraction of unidentified high Galactic latitude -ray sources is related to the pulsar and blazar phenomena, associations with other classes of astrophysical objects are still valid options.
1 Introduction
Observations with the EGRET instrument onboard the Compton Gamma-Ray Observatory (CGRO) in the 1990’s opened a new window in studying MeV–GeV emissions from both Galactic and extragalactic objects. Despite over a decade of multi-wavelength follow-up studies, more than of the -ray emitters included in the 3rd EGRET catalog (3EG; Hartman et al., 1999) are yet to be identified (that is, 170 out of 271). This is mainly because of the relatively poor -ray localizations of EGRET sources (typical confidence radii, ), challenging the identification procedure especially for the objects located within the Galactic plane, due to source confusion. In particular, as much as of the 3EG sources detected at Galactic latitudes do not have robustly selected counterparts at lower frequencies. On the other hand, most of the 3EG sources at high Galactic latitudes have been associated with blazars — a sub-class of jetted active galactic nuclei (AGN) displaying strong relativistic beaming — in accordance with the expectation for the extragalactic population to dominate the -ray sky at (Abdo et al., 2009a). Yet the unidentified fraction of the high Galactic latitude 3EG sources is still large (; e.g., Sowards-Emmerd et al., 2003). The situation is basically unchanged in the revised EGRET catalog (EGR; Casandjian & Grenier, 2008), even though the revised background modeling applied in the EGR resulted in fewer -ray detections (188 sources in total, in contrast to 271 listed in 3EG); 87 out of 188 EGR entries remain unidentified.
The unidentified low Galactic latitude -ray sources are expected to be associated with local objects such as molecular clouds, supernova remnants, massive stars, pulsars and pulsar wind nebulae, or X-ray binaries (see, e.g., Gehrels & Michelson, 1999, and references therein). Meanwhile, the population of unidentified high Galactic latitude -ray sources is typically believed to be predominantly extragalactic in origin, although there is a suspected Galactic component as well (Özel & Thompson, 1996). For example, the brightest steady source 3EG J1835+5918 located at was proposed to be associated with an isolated neutron star (Mirabal et al., 2000; Reimer et al., 2001). The neutron star origin and its association with the -ray source has been confirmed with the discovery of a -ray pulsar at the position of 3EG J1835+5918 with Fermi/LAT (Abdo et al., 2010a, b). Similarly, high-energy -ray pulsations were discovered with Fermi (Abdo et al., 2009b) and AGILE (Tavani et al., 2009) from PSR J2021+3651 that was long considered as a likely pulsar counterpart of 3EG J2021+3716 (Halpern et al., 2008). On the other hand, blazar G74.87+1.22 (B 2013+370) was claimed to be the most likely counterpart of the unidentified object 3EG J2016+3657 located within the Galactic plane (Mukherjee et al., 2000; Halpern et al., 2001). Other unidentified -rays sources were similarly investigated with varying success (e.g., Mukherjee & Halpern, 2004). We note that population studies, which could in principle shed some light on the galactic/extragalactic origin of different classes of unidentified EGRET sources, were impeded by different level of background emission at different locations from the Galactic plane, and different EGRET exposure for various parts of the sky (see the discussion in Reimer, 2001). Also, variability studies were previously hampered by the limited statistics and noncontinuous EGRET observations (Nolan et al., 2003).
With the successful launch of the Fermi Gamma-ray Space Telescope, we now have a new opportunity to study -ray emission from different types of high energy sources with much improved sensitivity and localization capabilities than with EGRET. With its field of view (five-times-larger than that of EGRET) covering of the sky at every moment, and its improved sensitivity (by more than an order of magnitude with respect to EGRET), the Large Area Telescope (LAT; Atwood et al., 2009) aboard Fermi surveys the entire sky each day down to a photon flux levels of few ph cm-2 s-1. The first Fermi/LAT point source catalog (1FGL) already surpasses EGRET with 1451 sources detected at significance levels within the MeV GeV photon energy range during the initial 11-month survey (Abdo et al., 2010c). Several high-latitude EGRET sources lacking low-frequency counterparts were confirmed by Fermi/LAT and associated with previously unknown -ray blazars, as expected (Abdo et al., 2010d). Somewhat surprisingly, however, a number of -ray emitters at have been robustly identified by LAT with newly found -ray pulsars via the detection of -ray pulsations (Abdo et al., 2010e). Most of these are in fact millisecond pulsars (MSPs). A diminishing, yet still significant population of unidentified Fermi/LAT objects remains, constituting as much as about of all 1FGL sources. This includes more than 10 unidentified EGRET sources at high Galactic latitudes, which are thus the best candidates for the persistent, or even “steady” -ray emitters over the 10-year-long period between the EGRET and Fermi/LAT epochs (as indicated by their comparable photon fluxes in the 3EG and 1FGL catalogs).
Thus motivated, we started a new project to investigate the nature of unidentified high Galactic latitude Fermi objects through deep X-ray follow-up observations with the Japanese X-ray astronomy satellite Suzaku (Mitsuda et al., 2007). This paper presents the results of the first year campaign conducted over the span of Suzaku-AO4 (Apr 2009 – Mar 2010), during which we have observed four steady/weakly variable Fermi/LAT sources from the 3-month Fermi/LAT Bright Source List (0FGL; Abdo et al., 2009c). These are denoted below accordingly to their 1FGL catalog entries as 1FGL J1231.1–1410, 1FGL J1311.7–3429, 1FGL J1333.2+5056, and 1FGL J2017.3+0603. Thanks to the superb localization provided by the LAT, all the corresponding error circles (typically ) could be covered within the field-of-view of the Suzaku X-ray CCD camera “XIS”. Only in the case of 1FGL J1333.2+5056, the Suzaku pointing does not cover the entire 95% LAT error circle since the localization error for this object did not improve sufficiently between 1FGL and 0FGL. Along with our Suzaku observations, systematic pulsar searches with radio telescopes have been performed for the Fermi/LAT unassociated sources. These resulted in the new discoveries of MSPs co-located with the two -ray sources included in our study (1FGL J1231.1–1410 and 1FGL J2017.3+0603). In both cases, Fermi/LAT eventually detected -ray pulsations as well, in accordance with the results in the radio domain (Ransom et al., 2010; Cognard et al., 2010). Our deep X-ray exposure discussed in the next sections supports the pulsar identification for at least 1FGL 1231.1–1410, but is less conclusive in the case of 1FGL J2017.3+0603. For the other target from our list, 1FGL J1333.2+5056, a tentative association with blazar CLASS J1333+5057 was claimed in the LAT Bright AGN Sample (LBAS; Abdo et al., 2009a). Here we substantiate this possibility by presenting the broad-band spectral energy distribution (SED) for 1FGL J1333.2+5056/CLASS J1333+5057, including new Suzaku data, which is indeed typical of a flat spectrum radio quasar (FSRQ). Finally, the nature of the remaining source 1FGL J1311.7–3429 (for which no radio or -ray pulsations have been detected so far; Ransom et al. 2010) could not be revealed, despite the discovery of a likely X-ray counterpart. In particular, we found that the multiwavelength spectrum of 1FGL J1311.7–3429 is not consistent with neither a typical blazar nor pulsar spectrum.
In 2, we describe the Suzaku X-ray follow-up observations and the data reduction procedure. The results of the analysis are given in 3. The discussion and conclusions are presented in 4 and 5, respectively. A standard CDM cosmology with , , and km s-1 Mpc-1 is assumed throughout the paper.
2 Observations and Analysis
2.1 Observations and Data Reduction
We observed four unidentified high Galactic latitude Fermi/LAT objects with the Suzaku X-ray astronomy satellite (Mitsuda et al., 2007). These are denoted in the 1FGL catalog as 1FGL J1231.1–1410, 1FGL J1311.7–3429, 1FGL J1333.2+5056, and 1FGL J2017.3+0603 (see Abdo et al., 2010c). All the sources but one (1FGL J2017.3+0603) were already listed in the 3rd EGRET catalog (Hartman et al., 1999) and their -ray fluxes are given in Table 1. The Suzaku observation logs are summarized in Table 2. The observations were made with three out of four CCD cameras (X-ray Imaging Spectrometers; XIS; Koyama et al., 2007), and a Hard X-ray Detector (HXD; Kokubun et al., 2007; Takahashi et al., 2007). One of the XIS sensors is a back-illuminated CCD (BI; XIS1), and the other three XIS sensors are front-illuminated ones (FI; XIS0, XIS2, and XIS3; the operation of XIS2 has been terminated in November 2006). Since none of the studied sources have been detected with the HXD, in this paper we focus on the analysis of only the XIS data. The XIS was operated in the pointing source mode and in the normal clocking mode during all the exposures.
In the reduction and the analysis of the Suzaku data, HEADAS software version 6.7 and a calibration database (CALDB; released on 2009 September 25th) were used. The XIS cleaned event dataset was obtained in the combined and edit modes using xselect. We excluded the data collected during the time and up to 60 seconds after Suzaku was passing the South Atlantic Anomaly (SAA). We also excluded the data corresponding to less than 5 degrees of the angle between the Earth’s limb and the pointing direction (the Elevation Angle; ELV). Moreover, we excluded time windows during which the spacecraft was passing through the low Cut-Off Rigidity (COR) of below GV. Finally, we removed hot and flickering pixels (using sisclean; Day et al., 1998). With all the aforementioned data selection criteria applied, the resulting total effective exposures for all the observed sources are summarized in Table 2.
2.2 Analysis
XIS images for each target were extracted from the two FI CCDs (XIS0, XIS3) within the photon energy range from to keV. In the image analysis procedure, calibration sources located at the corners of CCD chips were excluded. The images of Non X-ray Background (NXB) were obtained from the night Earth data using xisnxbgen (Tawa et al., 2008). Since the exposure times for the original data were different from that of NXB, we calculated the appropriate exposure-corrected original and NXB maps using xisexpmapgen (Ishisaki et al., 2007). The corrected NXB images were next subtracted from the corrected original images. In addition, we simulated flat sky images using xissim (Ishisaki et al., 2007), and applied a vignetting correction. All the images obtained with XIS0 and XIS3 were combined and re-binned by a factor of 4. All the FI XIS images were in addition smoothed by a Gaussian function with , and the resultant images are presented in section 3. Note that the apparent features at the edge of these exposure corrected images are undoubtedly spurious due to low exposure in those regions. For the further analysis, source regions were carefully selected around each detected X-ray sources within the error circle of a studied -ray emitter. The corresponding background regions with radius were taken from the same XIS chips avoiding any bright X-ray spots in the field. In all the cases, such source regions were set to within or radii around the X-ray point sources (because of the blurring due to the Suzaku/XIS Point Spread Function; PSF), depending on the properties of each analyzed field. The source detection criterion was based on a signal-to-noise ratio which is defined, assuming a Poisson distribution, as a ratio of the excess events above a background to its standard deviation. Photon counts were derived from each source and background regions and we set the detection threshold at . The source positions and the corresponding errors were obtained by fitting a 2D Gaussian around each X-ray spot. The source detection results are summarized in Table 3.
The light curves were constructed for each potential X-ray counterpart of the observed Fermi objects. Each light curve provides net-counting rates, with the count rates of the corresponding background region subtracted. In the timing analysis, the FI (XIS0, XIS3) and BI (XIS1) CCD’s light curves were combined using lcmath, and then re-binned using lcurve. To assess statistical significances of the flux variations, the test was applied to each constructed dataset (probing a constant flux hypothesis with lcstats command). Finally, the XIS spectra for each source region were extracted, with the same corresponding background spectra as defined in the image analysis (see above). RMF files for the detector response and ARF files for the effective area were generated using xisrmfgen and xissimarfgen (Ishisaki et al., 2007). In this spectral analysis, all the selected data from the FI CCDs were co-added (using mathpha) without calculating Poisson errors, and the response files were combined with the marfrmf and addrmf commands. Since all the studied Fermi/LAT objects are located at high Galactic latitudes, the absorption of soft X-ray photons was set to the Galactic one with the equivalent column density of a neutral hydrogen, , as given in Dickey & Lockman (1990). In some cases where apparent systematic features are visible as trends of the residuals with energy (see Figure 3), we attempted to use an inter-calibration constant between the FI and BI CCDs to improve the fits. From this inspection, we found negligible improvement of the fits thus we conclude that the limited photon statistics is the predominantly responsible for the somewhat unsatisfactory model fits to the data.
3 Results
3.1 1FGL J1231.4–1410
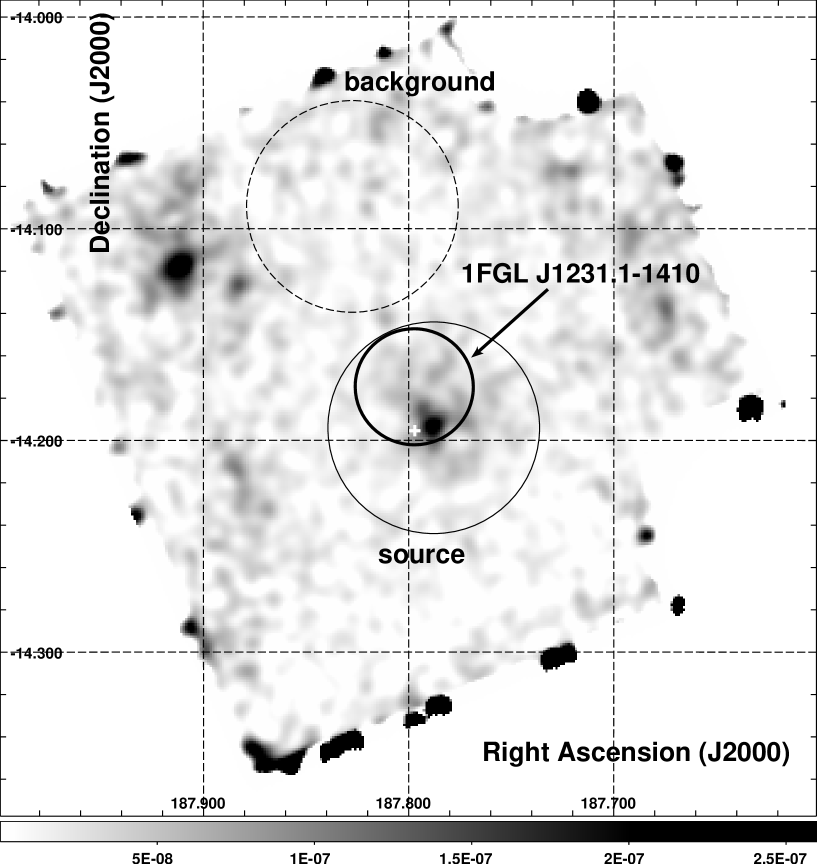
Our Suzaku observations (interrupted for days111The exposure was interrupted because of the Target of Opportunity observation of GRB 090708.) revealed one X-ray point source (RA, Dec) (187.∘790(1), 14.∘192(1)) within the LAT error circle of 1FGL J1231.4–1410. Figure 1 shows the corresponding X-ray image, prepared as described in 2.2. For further analysis, the source extraction region was set to within a radius around the X-ray intensity peak, and the corresponding background region was chosen as indicated in Figure 1. The light curve of the X-ray source with a time bin of s is presented in Figure 2. The upper panel shows the count rate variation during the 1st observation, while the bottom panel shows that of the 2nd observation. The light curves of the two periods can both be well fitted by a constant count rate of ct s-1, with d.o.f. . This indicates that the X-ray emission of the analyzed source is steady, with the probability for a constant flux .
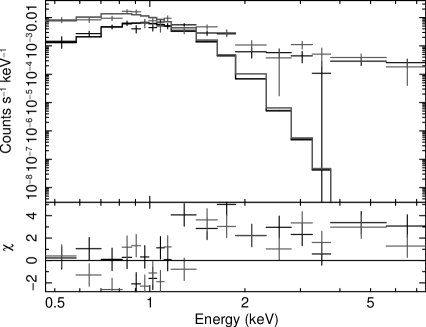
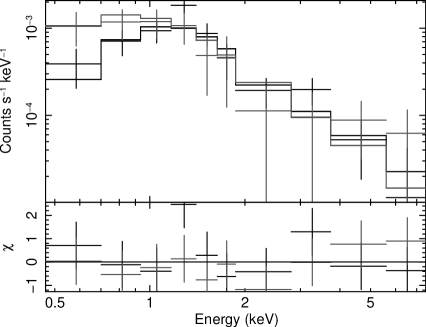
The X-ray spectrum of the Suzaku source, which we propose to be the most likely counterpart of 1FGL J1231.1–1410, is shown in Figure 3. The energy range used for the fitting was set as keV. First, we fit the X-ray spectrum by a blackbody emission moderated by the Galactic absorption only (Morrison & McCammon, 1983). This fit was not acceptable, however, due to significant residuals above keV (d.o.f. , see Figure 3, left panel, where the excess emission above keV has been enhanced by fixing the black body parameters to those determined by the data below keV only). The situation was essentially unchanged when the column density was treated as a free parameter. In this case, the residuals above keV remained, but the returned value of was then consistent with zero. To account for the keV emission, we therefore added a power-law component to the thermal one, and fixed . The goodness of the fit was in this way substantially improved to of , supporting the presence of a non-thermal tail in the spectrum of the analyzed object (see Figure 3). In order to further confirm the reality of this finding, we analyzed the highest quality FI CCD (XIS0, XIS3) data which had sufficient photon statistics within the keV range, examining various approaches for the background estimation, namely (i) the background taken from the same CCD chips but off-axis, as given in Figure 1, (ii) the concentric ring background surrounding the source region on the same CCD chips, and (iii) the background for the same region as the source estimated from the Lockman Hole observation taken with the same XIS mode at nearby dates (OBS ID = 104002010). In all of the examined approaches the presence of the non-thermal component in the X-ray spectrum of 1FGL J1231.1–1410 could be confirmed at high significance, as summarized in Tables 4 and 5.
To sum up, we conclude that the X-ray counterpart of 1FGL J1231.1–1410 is robustly characterized by a blackbody-type spectrum with a temperature of keV plus a power-law tail with the photon index of . The energy flux of the non-thermal component is erg cm-2 s-1, which can be compared with the Fermi/LAT energy flux erg cm-2 s-1, as given in the 1FGL catalog. Thus, the extrapolation of the X-ray power-law component to the -ray range yielding the GeV energy flux erg cm-2 s-1, falls orders of magnitudes below the observed one. This implies either a multi-component character or a concave spectral form of the high-energy X-ray–to–-ray continuum of 1FGL J1231.1–1410, and both possibilities should be kept in mind in the context of a very likely association of the discussed source with a MSP. Indeed, the MSP PSR J1231–1411 (marked by a white cross in Figure 1) was recently found by Ransom et al. (2010) via the detection of radio pulsations with the pulse period of ms within the LAT error circle of 1FGL J1231.1–1410 using the Green Bank Telescope (GBT), just after our Suzaku observations. In addition, the Fermi spectrum shows a cut-off at around a few GeV, which is consistent with the typical spectrum of MSPs (Ransom et al., 2010). The X-ray emitter observed by Suzaku is located roughly away from the newly discovered MSP PSR J1231–1411 (Ransom et al., 2010, see Figure 1), but considering the limited pointing accuracy of the Suzaku/XIS (), both objects can be considered as co-spatial. In fact, as described in Ransom et al. (2010), a Swift/XRT source at (RA, Dec) (187.7972,14.1953) coinciding with the Suzaku one, was found to be positionally consistent (within the 90% error of ) with that of the MSP PSR J1231–1411.
3.2 1FGL J1311.7–3429
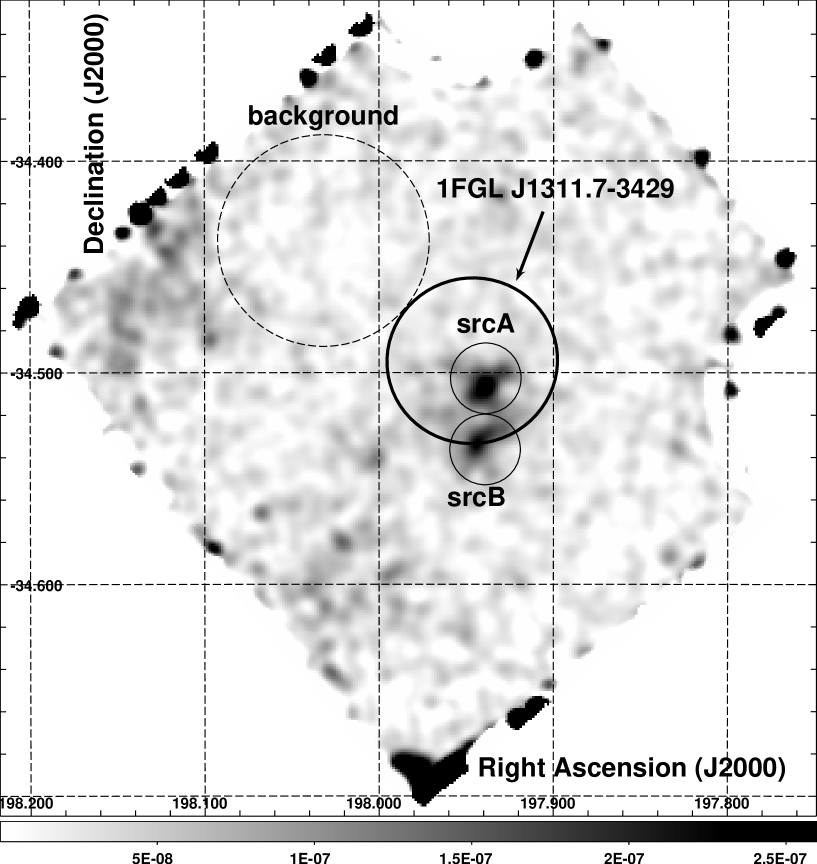
Two X-ray point sources were found within the LAT error circle of 1FGL J1311.7–3429. Figure 4 shows the corresponding X-ray image with the northern Suzaku object, src A, located at (RA, Dec) (197.∘939(1), 34.∘508(2)) and the southern source, src B, positioned at (RA, Dec) (197.∘942(1), 34.∘534(2)). Note that src B is situated just marginally within the edge of the Fermi/LAT error circle. For the further analysis, we set the source regions to within radii around the respective X-ray flux maxima. The derived light curves of src A and src B with time bins of s are presented in Figure 5 (upper and lower panels, respectively). As shown, during the first ksec of the observation, src A exhibited a very rapid X-ray flare, with the count rate changing by a factor of 10. After the flare, however, the X-ray flux of src A remained steady. A constant fit to the light curve of src A returns d.o.f. , and hence the variability of this source is statistically significant. On the other hand, src B was characterized by a constant flux over the duration of the exposure (d.o.f. ) with a count rate of ct s-1.
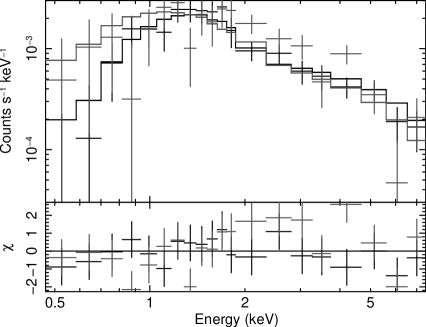
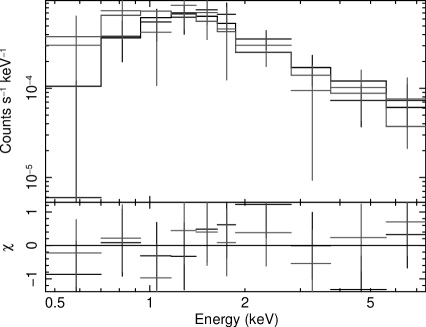
Figure 6 shows the spectra of src A and src B within the energy range keV. The best model fits for both newly discovered X-ray objects consist of power-law continua with photon indices (src A) and (src B), moderated by the Galactic absorption. The detail of the model fitting are summarized in Table 6. Note that the observed X-ray spectra of the two sources are very similar, and the X-ray fluxes of the objects are almost identical. It is important to emphasize at this point that because of the relatively large PSF of Suzaku/XIS (a half power diameter of ), it is quite difficult to separate completely src A and src B — located only apart — for the purpose of the spectral analysis. As a result, even though it is clear we are dealing with two physically distinct X-ray sources (each detected at high significance), their spectral parameters cannot be accessed robustly.
3.3 1FGL J1333.2+5056
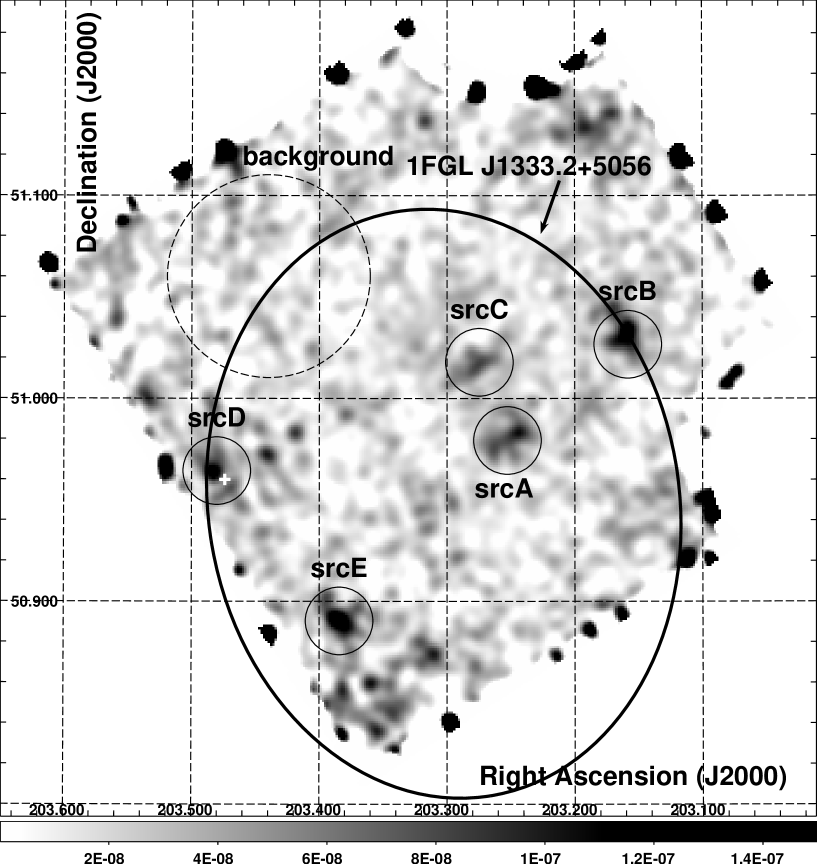
Our Suzaku observations revealed multiple regions of enhanced X-ray emission inside the LAT error circle of 1FGL J1333.2+5056, as shown in the corresponding X-ray image in Figure 7. The associations of these faint X-ray sources with 1FGL J1333.2+5056 are therefore quite ambiguous. Within the Fermi/LAT error circle covered by the XIS exposure222Note that the 1FGL localization error for the analyzed -ray object did not improve sufficiently between 0FGL and 1FGL. For this reason, we could not cover the entire 95% LAT error circle of 1FGL J1333.2+5056 within one pointing of Suzaku/XIS., five X-ray enhancements have been found with detection significances of more than , and these are denoted here as src A, B, C, D and E (see Figure 7 and Table 3).
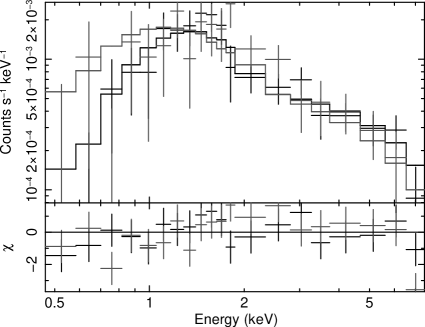
The light curves of src A, B, C, D and E with s binning are shown in Figure 8 in the descending order. As noted above, all the analyzed X-ray sources are very dim, with X-ray fluxes at the level of erg cm-2 s-1. Hence, we could not assess the variability properties of the selected objects by means of the test with a constant flux hypothesis (see Table 7). The spectra of the five X-ray sources, all extracted within source radii, are shown in Figure 9. Again, limited photon statistics precluded any detailed analysis, and therefore in the model fitting we applied only single power-law models moderated by the Galactic absorption. The results are summarized in Table 8. We also emphasize that the 1FGL error circle unfortunately runs off the edge of Suzaku field of view. For all these reasons, we cannot persuasively identify an X-ray counterpart of the -ray source 1FGL J1333.2+5056. Nevertheless, we note that one of the X-ray enhancements, src D, coincides with the FSRQ CLASS J1333+5057 (marked in Figure 7 by a white cross; Shaw et al., 2009), listed in the 1FGL as a possible association with 1FGL J1333.2+5056. Note however a relatively low significance of the detection of this source with Suzaku/XIS.
3.4 1FGL J2017.3+0603
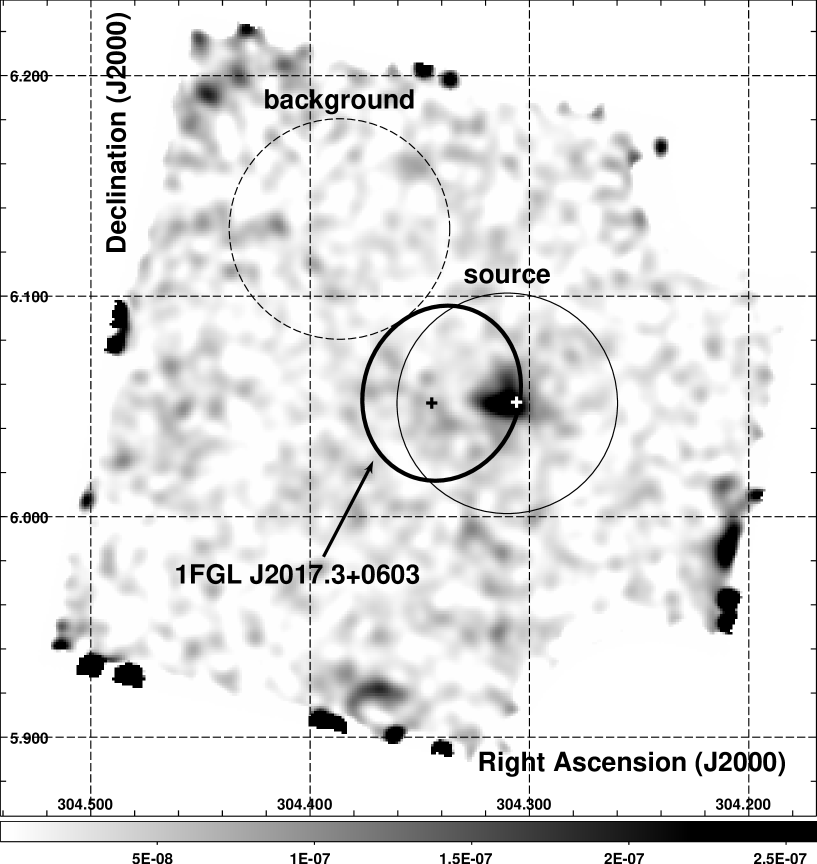
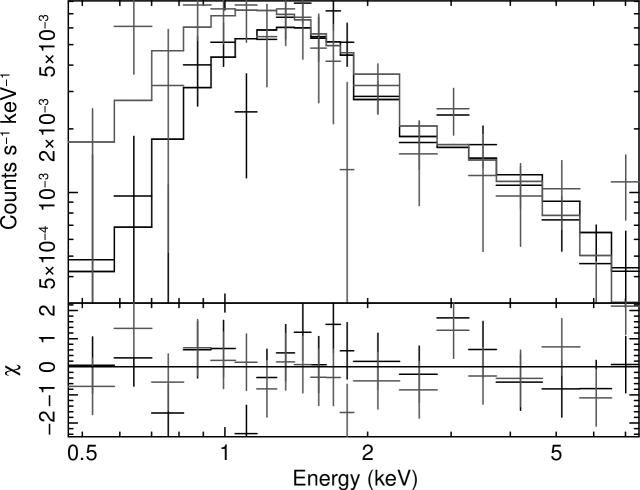
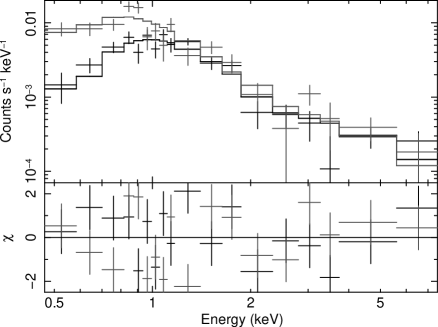
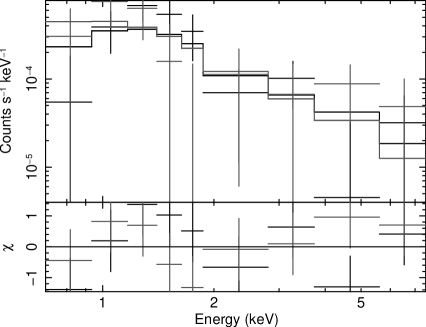
A single prominent X-ray point source was found at the edge of the 1FGL error circle of the unidentified -ray source 1FGL J2017.30603. The X-ray source is located at (RA, Dec) = (304.∘310(1), 6.∘052(1)), as shown in Figure 10. For the further analysis, we set the extraction region to encircle this bright source with a radius of . The corresponding light curve of the newly discovered X-ray source is show in Figure 11 with s binning. The light curve is consistent (at the level of ) with a constant X-ray flux within the errors (d.o.f. ) and the average count rate ct s-1. Figure 12 shows the X-ray spectrum of the analyzed source. A power-law model (photon index ) with the Galactic absorption provided the best fit to the data, and the obtained best fit parameters are given in Table 9.
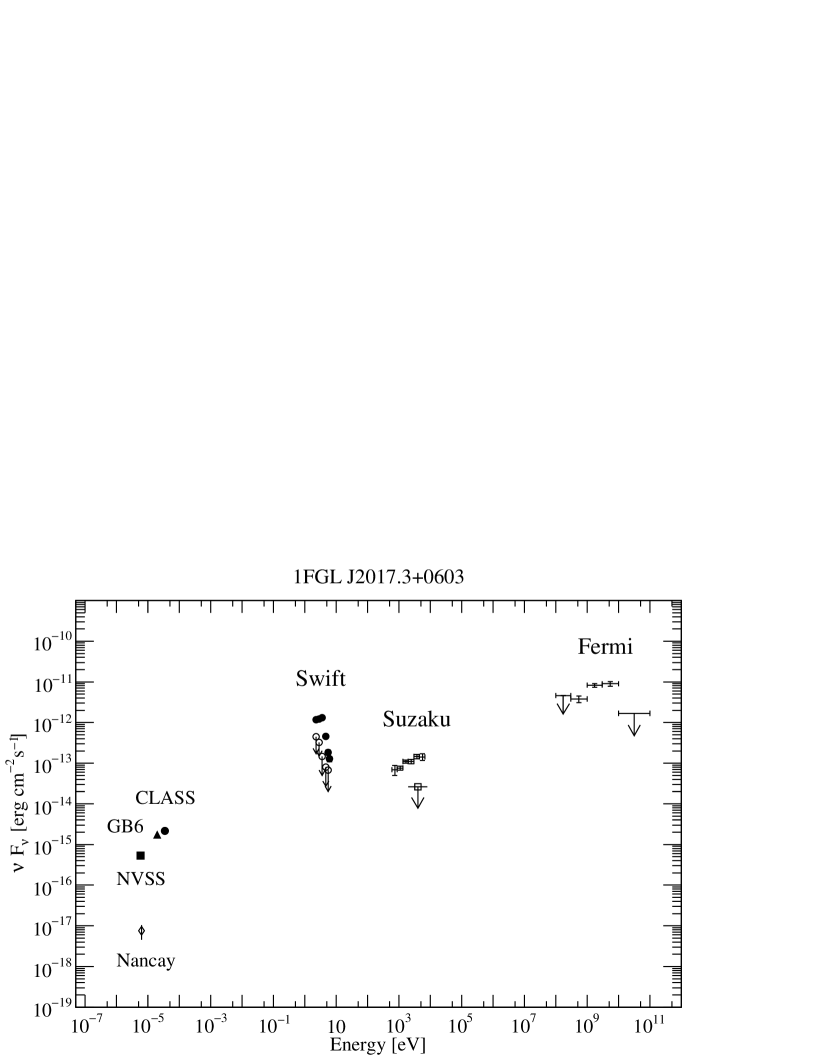
The X-ray point source found at the edge of the 1FGL error circle is positionally coincident (offset by , which is much less the Suzaku/XIS position accuracy of ) with the FSRQ CLASS J20170603 (Myers et al., 2003). This blazar has been listed in the first Fermi/LAT AGN Catalog (Abdo et al., 2010d) as being possibly associated with 1FGL J2017.3+0603, even though the probability for such an association was not quantified. We denote its position in Figure 10 with a white cross. More recently, radio and -ray pulsations with the pulse period of ms have been discovered using the Nancay radio telescope well within the Fermi/LAT error circle of 1FGL J2017.30603 (Cognard et al., 2010), pointing instead to a pulsar (rather than blazar) association of this source. In Figure 10 we mark the position of the MSP PSR J20170603 with a black cross. As shown, no X-ray counterpart of the pulsar has been detected by Suzaku/XIS. In order to determine the corresponding X-ray flux upper limit, we set an additional source region within radius around the position of the radio pulsar, and assumed a power-law emission spectrum with photon index . The resulting 90% confidence X-ray upper limit is erg cm-2 s-1.
4 Discussion
4.1 The Observed Sample
Within the error circle of the unidentified -ray object 1FGL J1231.4–1410, only one X-ray source was found, which is positionally consistent with the radio/-ray MSP PSR J1231–1411 (Ransom et al., 2010, see Figure 1). The broad band spectrum of 1FGL J1231.1–1410/PSR J1231–1411, including our Suzaku/XIS data and the derived UVOT optical/UV upper limits from Swift, are shown in Figure 13. We note that the SED is reminiscent of that of the Geminga pulsar (Thompson et al., 1999), or 3EG J1835+5918 (Halpern et al., 2002). Hence the consistent picture emerges, in which the keV blackbody component of the newly discovered X-ray counterpart of 1FGL J1231.1–1410 originates as thermal emission from the surface of a rotating magnetized neutron star, a pulsar, while the -ray emission detected by Fermi/LAT may be accounted by the emission of ultra-relativistic electrons present within the pulsar magnetosphere. The non-thermal X-ray component is then likely to be produced within the magnetosphere of PSR J1231–1411 as well, even though one may also expect some contribution from the outer regions (pulsar wind nebulae) to the detected hard X-ray continuum.
Assuming that PSR J1231–1411 is a typical MSP with the spin period ms and a spin-down rate s s-1 (see Ransom et al., 2010), one can calculate the corresponding spin-down luminosity as erg s-1, and the magnetic field intensity at the light cylinder (radius, ) as G, where g cm2 is the star’s moment of inertia. Meanwhile, for the claimed distance kpc (Ransom et al., 2010), the observed -ray luminosity of PSR J1231–1411 leads as erg s-1, its non-thermal X-ray luminosity is erg s-1, and the total X-ray luminosity erg s-1. These values are then consistent with the millisecond pulsar scenario – outer-magnetosphere models in particular – in a framework of which one should expect (Abdo et al., 2009d) and (Becker & Truemper, 1997; Gaensler & Slane, 2006; Zhang et al., 2007), with relatively large dispersion, however. Interestingly, the synchrotron X-ray luminosity produced close to the light cylinder within the expected magnetic field and a fraction (say, ) of the volume , would then be close to the observed non-thermal X-ray luminosity assuming rough energy equipartition between ultra-relativistic electrons and the magnetic field.
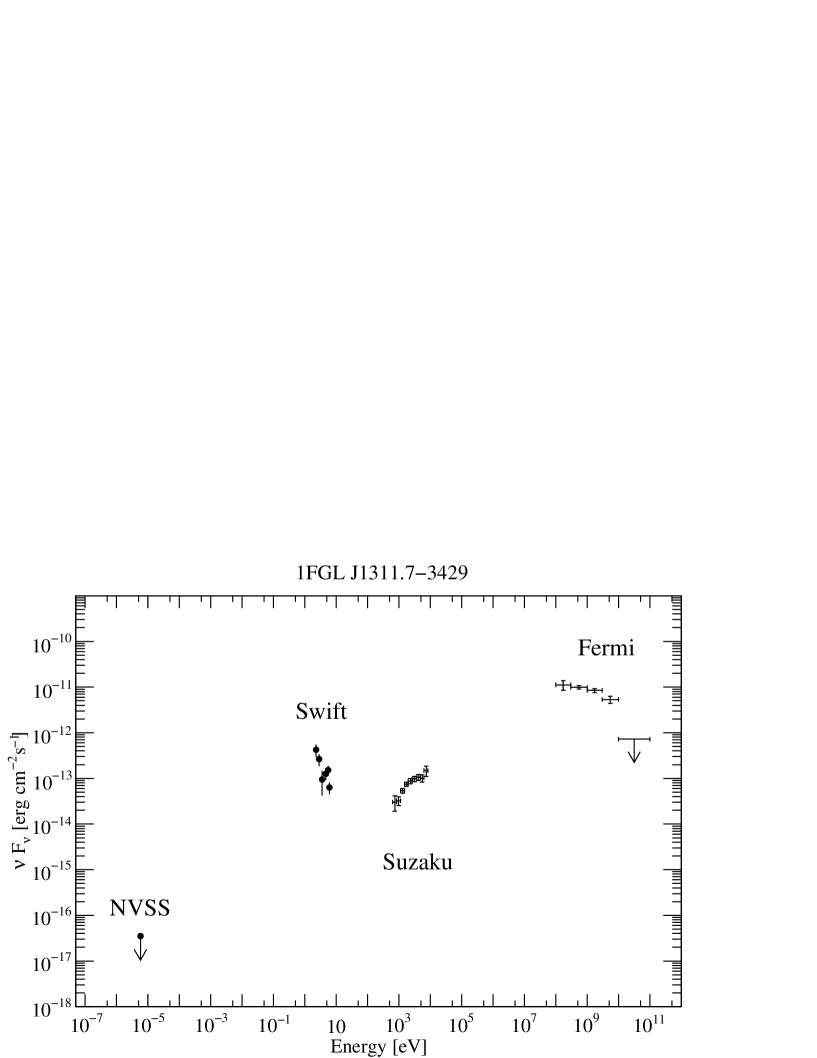
In the case of 1FGL J1311.7–3429, two potential X-ray counterparts have been discovered in our Suzaku observations. The association of this Fermi object with the northern source src A is more likely, since the southern X-ray spot src B is located only marginally within the Fermi/LAT error circle of the -ray emitter. Yet the classification of 1FGL J1311.7–3429/src A, for which the broad-band spectrum (including radio and optical upper limits) is shown in Figure 14, remains vague. Currently, no radio or -ray pulsations have been found at the position of 1FGL J1311.7–3429, and this favors an extragalactic origin of the detected high-energy emission. And indeed, the flat X-ray continuum () and the -ray–to–X-ray energy flux ratio (with erg cm-2 s-1 as given in the 1FGL catalog) would be consistent with the characteristics of luminous blazars of the FSRQ type (e.g., Sikora et al., 2009). On the other hand, however, the radio upper limit indicating the GHz energy flux times smaller than the GeV energy flux, invalidates the blazar nature of 1FGL J1311.7–3429. That is because all active galaxies established till now as -ray emitters are characterized by relatively strong, Doppler-boosted radio emission. In particular, radio energy fluxes of bona fide blazars included in 0FGL are, for a given Fermi/LAT photon flux of photons cm-2 s-1, at least an order of magnitude higher than the energy flux implied by the NVSS upper limits for src A (see, e.g., Kovalev et al., 2009). In addition, a very prominent ks-long X-ray flare detected from src A, together with the steady GeV flux of 1FGL J1311.7–3429, would not match easily a typical behavior of FSRQs: this class of blazars is known for displaying dramatic variability at GeV photon energies, but only modest variations in the X-ray band. Therefore, the nature of the analyzed Fermi source and its newly discovered Suzaku counterpart remains an open question.
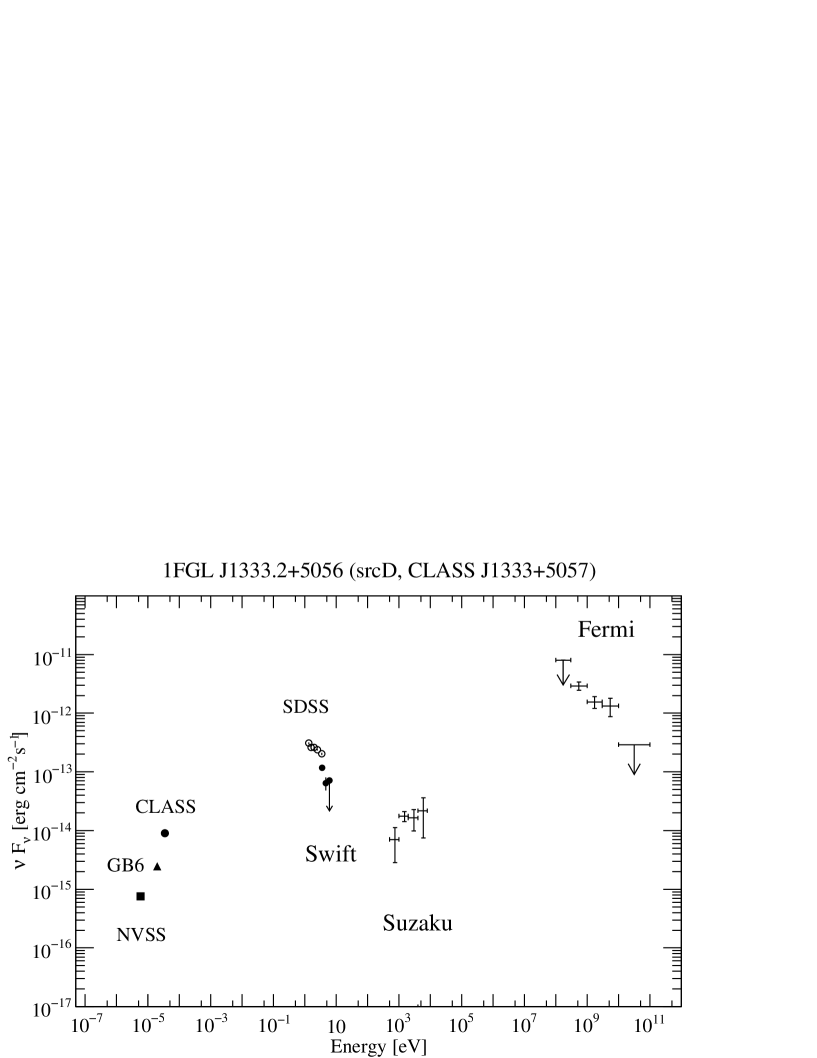
Within the error circle of 1FGL J1333.25056, our Suzaku/XIS observations revealed the presence of several weak X-ray flux maxima with possibly diverse spectral properties (as indicated by the spectral analysis hampered by the limited photon statistics). One of the detected X-ray sources (src D) coincides with the high-redshift blazar CLASS J1333+5056 (). The broad-band spectral energy distribution of 1FGL J1333.25056/CLASS J1333+5056/src D is presented in Figure 15, including the LAT -ray, Suzaku X-ray, archival radio, and newly analyzed Swift/UVOT data for the blazar. The constructed SED reveals two distinct radiative components, consisting of a low-energy synchrotron bump and an (energetically dominant) high-energy inverse-Compton continuum, reminiscent of typical broad-band spectra for blazars of the FSRQ type (Ghisellini et al., 1998). Note that the X-ray–to–-ray flux ratio implied by Figure 15, as well as the relatively large radio flux, would be both in agreement with the blazar identification of 1FGL J1333.25056. In addition, we note that the discussed Fermi object is the most variable in -rays out of all four Fermi targets studied in this paper, with the variability index of 38 (which indicates a probability of a steady flux; see Abdo et al., 2010c). The additional support for the blazar association is offered by the fact that the -ray continuum of 1FGL J1333.25056 is the steepest among the four Fermi objects observed by us, with the photon index , which is compatible with the mean -ray photon index of the FSRQ population reported in the 1FGL, namely (Abdo et al., 2010f).
Finally, in the case of 1FGL J2017.3+0603, the MSP PSR J20170603 was newly discovered by the Nancay Radio Telescope (Cognard et al., 2010), and the association between the radio and -ray sources was confirmed by the pulse detection with the same period in the LAT data. Interestingly, in our Suzaku/XIS exposure we have only detected the high-redshift blazar () CLASS J20170603, but not the pulsar. The same is true for the Swift/UVOT observation (Cognard et al., 2010), which resulted in analogous flux and upper limit measurements in the optical for the blazar and pulsar, respectively. The constructed radio to X-ray SEDs for the pulsar and blazar systems are shown in Figure 16 together with the LAT spectrum. Regarding the pulsar, Cognard et al. (2010) discovered that PSR J2017+0603 is located at a distance kpc, and as such is characterized by the spin-down luminosity erg s-1. The X-ray ( keV) luminosity derived from the Suzaku/XIS upper limit for this pulsar, erg s-1, is then consistent with the expected “pulsar-like” luminosity ratio . The overall curved -ray spectrum of 1FGL J2017.3+0603, characterized by the small photon index , supports the pulsar association. On the other hand, the relatively large radio flux of CLASS J20170603, together with the X-ray–to–-ray flux ratio for the 1FGL J2017.3+0603/CLASS J20170603 system, are in some level of agreement with the blazar interpretation. The -ray photon index of 1FGL J2017.30603 is however rather flat for a FSRQ and represents a deviation from the distribution observed for FSRQs (mean, ; see Abdo et al., 2010f) thus making the association with the FSRQ less likely. Although the detected pulsations in radio and -rays is key to the identification of the -ray source with a pulsar, there may be some contaminating flux from the blazar. Indeed, the chance probability of finding a CLASS-like background blazar in the Fermi error circle of this source is . Considering over 1400 sources in the 1FGL catalog, such ‘mixed’ cases could be expected.
4.2 Implications
What class of astrophysical objects can be in general associated with the unidentified high Galactic latitude -ray sources? It was noted, for example, that compact and relatively nearby molecular clouds exist at , and these should emit -rays at least at some level. Torres et al. (2005) argued, however, that the expected GeV emission of such clouds is too low to account for the observed fluxes of unidentified EGRET sources, and the same applies to the bright unidentified Fermi/LAT objects. Another classes of possible counterparts proposed were radio-quiet pulsars and isolated neutron stars (e.g., Yadigaroglu & Romani, 1995), and this idea has indeed been validated by the subsequent multi-frequency studies, as discussion in 1. We note in this context that the Galactic origin of high-latitude -ray emitters is especially probable for the objects located at within the Gould Belt ( kpc from the Earth), which constitutes an aggregation of massive late-type stars, molecular clouds, and supernova remnants (Grenier et al., 2000).
A probably more challenging population of -ray emitters is represented by the isotropic component of the unidentified EGRET objects, consisting of about 60 sources (about one third of which with the Galactic latitudes , including several non/weakly-variable during the EGRET observations; Özel & Thompson, 1996; Gehrels et al., 2000). For those sources, Totani & Kitayama (2000) have for example suggested associations with large-scale shocks produced during the structure formation in the intergalactic medium (see also Waxman & Loeb, 2000). Totani & Kitayama explored the connection between steady GeV objects located off the Galactic plane, and labeled in the 3EG catalog as “possibly extended,” with dynamically forming clusters of galaxies (and not single virialized cluster systems; see Kawasaki & Totani, 2002). However, the non-variable nature of the -ray emission of several of the considered objects was questioned (see Reimer et al., 2003, and references therein), and the high efficiency of the particle acceleration at the structure formation shocks required by the model was also noted (e.g., Keshet et al., 2003).
Radio galaxies are prime candidates for the unidentified high Galactic latitude EGRET sources, especially since the only confirmed non-blazar AGN detected previously at GeV photon energies was the nearby radio galaxy Centaurus A (Steinle et al., 1998; Sreekumar et al., 1999). Yet no other radio galaxy has been firmly detected by EGRET at the significance level high enough () to be included in the 3rd EGRET catalog (Hartman et al., 1999). Moreover, Cillis et al. (2004), who applied a stacking analysis of the EGRET data for a sample of the brightest and/or the closest radio and Seyfert galaxies, showed that ‘no detection significance greater than has been found for any subclass, sorting parameter, or number of objects co-added.’ Nevertheless, Mukherjee et al. (2002) argued that the most likely counterpart to the unidentified EGRET source 3EG J1621+8203 is the bright radio galaxy NGC 6251. A marginal detection of 3C111 with EGRET has also been reported (Hartman, Kadler & Tueller, 2008). We also note that Combi et al. (2003) reported the discovery of a new radio galaxy within the location error circle of the unidentified -ray source 3EG J1735–1500. The identification of 3EG J1735–1500 was however controversial, due to the presence of an another likely (blazar-type) candidate within the EGRET error contours (Sowards-Emmerd et al., 2004). The most recent analysis based on the 15 months of Fermi/LAT data resulted in the detection of 11 non-blazar-type AGN (all radio galaxies), including the aforementioned cases of NGC 6251 and 3C111 (Abdo et al., 2010g). The idea that some fraction of unidentified -ray emitters may be associated with faint radio galaxies is therefore validated, although this should rather apply to only dimmer Fermi objects, and not to the population of exceptionally bright -ray sources detected already by EGRET.
The Suzaku/XIS studies of four bright Fermi/LAT objects reported here provide an important contribution to the debate regarding the nature of unidentified -ray emitters located at high Galactic latitudes. In particular, our observations support the idea that a significant fraction of such objects may be associated with old ( Gyr) MSPs present within the Galactic halo and the Earth’s neighborhood (such as 1FGL J1231.1–1410 and 1FGL J2017.3+0603). Yet not all of the unidentified Fermi objects are related to the pulsar phenomenon. Instead, some of those may be hosted by active galaxies, most likely by the luminous and high-redshift blazars of the FSRQ type (1FGL J1333.2+5056 is as good blazar candidate, for example). However, there still remain unidentified sources, (e.g., 1FGL J1311.7–3429), for which neither blazar nor pulsar scenarios seem to apply. For these, ultra-deep multi-wavelength studies are probably needed to unravel their physical nature.
5 Summary
In this paper we reported on the results of deep X-ray follow-up observations of four unidentified -ray sources detected by the Fermi/LAT instrument at high Galactic latitudes () using the X-ray Imaging Spectrometers onboard Suzaku satellite. All of the studied objects have been detected at high significance () during the first 3-months of the Fermi/LAT operation. For some of them, possible associations with pulsars and blazar have been recently discussed, and our observations provide an important contribution to this debate. In particular, an X-ray point source was newly found within error circle of 1FGL J1231.1–1410. The X-ray spectrum of the discovered Suzaku counterpart of 1FGL J1231.1–1410 is well fitted by a blackbody emission with a temperature of keV plus an additional power-law component with a differential photon index . This supports the recently claimed identification of this source with a MSP PSR J1231–1411. For the remaining three Fermi objects, the performed X-ray observations are less conclusive. In the case of 1FGL J1311.7–3429, two possibly associated X-ray point sources were newly found. Even though the keV spectral and variability properties for those could be robustly accessed, the physical nature of the X-ray emitters and their relations with the -ray source remain unidentified. Similarly, we found several weak X-ray sources in the field of 1FGL J1333.2+5056, one coinciding with the high-redshift blazar CLASS J1333+5057. We argue that the available data are consistent with the physical association between these two objects, even though we were not able to identify robustly the Suzaku counterpart of -ray emitter due to a large positional uncertainty of 1FGL J1333.2+5056. Finally, we found an X-ray point source in the vicinity of 1FGL J2017.3+0603. This Fermi object was recently suggested to be associated with a newly discovered MSP PSR J2017+0603 because of the detection of radio and -ray pulsations. However, we did not detect the X-ray counterpart of the pulsar, but instead of the high-redshift blazar CLASS J2017+0603 located within the error circle of 1FGL J2017.3+0603. Still, the resulting upper limits for the X-ray emission do not invalidate the pulsar association.
References
- Abdo et al. (2009a) Abdo, A. A., et al. (Fermi-LAT Collaboration) 2009a, ApJ, 700, 597
- Abdo et al. (2009b) Abdo, A. A., et al. (Fermi-LAT Collaboration) 2009b, ApJ, 700, 1059
- Abdo et al. (2009c) Abdo, A. A., et al. (Fermi-LAT Collaboration) 2009c, ApJS, 183, 46
- Abdo et al. (2009d) Abdo, A. A., et al. (Fermi-LAT Collaboration) 2009d, Science, 325, 840
- Abdo et al. (2010a) Abdo, A. A., et al. (Fermi-LAT Collaboration) 2010a, ApJ, 712, 1209
- Abdo et al. (2010b) Abdo, A. A., et al. (Fermi-LAT Collaboration) 2010b, ApJ, 712, 957
- Abdo et al. (2010c) Abdo, A. A., et al. (Fermi-LAT Collaboration) 2010c, ApJS, 188, 405
- Abdo et al. (2010d) Abdo, A. A., et al. (Fermi-LAT Collaboration) 2010d, ApJ, 715, 429
- Abdo et al. (2010e) Abdo, A. A., et al. (Fermi-LAT Collaboration) 2010e, ApJS, 187, 460
- Abdo et al. (2010f) Abdo, A. A., et al. (Fermi-LAT Collaboration) 2010f, ApJ, 720, 435
- Abdo et al. (2010g) Abdo, A. A., et al. (Fermi-LAT Collaboration) 2010f, ApJ, 720, 912
- Adelman-McCarthy et al. (2008) Adelman-McCarthy, J. K., et al. 2008, ApJS, 175, 297
- Atwood et al. (2009) Atwood, W. B., et al. 2009, ApJ, 697, 1071
- Becker & Truemper (1997) Becker, W., & Truemper, J. 1997, A&A, 326, 682
- Casandjian & Grenier (2008) Casandjian, J.-M., & Grenier, I. A. 2008, A&A, 489, 849
- Cillis et al. (2004) Cillis, A. N., Hartman, R. C., & Bertsch, D. L. 2004, ApJ, 601, 142
- Combi et al. (2003) Combi, J. A., et al. 2003, ApJ, 588, 731
- Cognard et al. (2010) Cognard, I., et al. 2010, submitted
- Condon et al. (1998) Condon, J. J., et al. 1998, AJ, 115, 1693
- Day et al. (1998) Day, C., et al. 1998, The ASCA Data Reduction Guide, Tech. Rep., (Greenbelt: NASA GSFC), v.2.0
- Dickey & Lockman (1990) Dickey, J. M., & Lockman, F. J. 1990, ARA&A, 28, 215
- Gaensler & Slane (2006) Gaensler, B. M., & Slane, P. O. 2006, ARA&A, 44, 17
- Gehrels & Michelson (1999) Gehrels, N., & Michelson, P. 1999, Astropart. Phys., 11, 277
- Gehrels et al. (2000) Gehrels, N., et al. 2000, Nature, 404, 363
- Ghisellini et al. (1998) Ghisellini, G., et al. 1998, MNRAS, 301, 451
- Gregory et al. (1996) Gregory, P. C., et al. 1996, ApJS, 103, 427
- Grenier et al. (2000) Grenier, I. A. 2000, A&A, 364, 93
- Halpern et al. (2001) Halpern, J. P., et al. 2001, ApJ, 551, 1016
- Halpern et al. (2002) Halpern, J. P. et al. 2002, ApJ, 573, L41
- Halpern et al. (2008) Halpern, J. P. et al. 2008, ApJ, 688, L33
- Hartman et al. (1999) Hartman, R. C., et al. 1999, ApJS, 123, 79
- Hartman, Kadler & Tueller (2008) Hartman, R. C., Kadler, M., & Tueller, J. 2008, ApJ, 688, 852
- Ishisaki et al. (2007) Ishisaki, Y., et al. 2007, PASJ, 59, S113
- Kawasaki & Totani (2002) Kawasaki, W., & Totani, T. 2002, ApJ, 576, 679
- Keshet et al. (2003) Keshet, U., et al. 2003, ApJ, 585, 128
- Kokubun et al. (2007) Kokubun, M., et al. 2007, PASJ, 59, S53
- Kovalev et al. (2009) Kovalev, Y. Y., et al. 2009, ApJ, 696, 17
- Koyama et al. (2007) Koyama, K., et al. 2007, PASJ, 59, S23
- Myers et al. (2003) Myers, S. T. et al., 2003, MNRAS, 341, 1
- Mirabal et al. (2000) Mirabal, N., et al. 2000, ApJ, 541, 180
- Mitsuda et al. (2007) Mitsuda, K., et al., 2007, PASJ, 59, 1
- Morrison & McCammon (1983) Morrison, R., & McCammon, D. 1983, ApJ, 270, 119
- Mukherjee et al. (2000) Mukherjee, R., et al. 2000, ApJ, 542, 740
- Mukherjee et al. (2002) Mukherjee, R., et al. 2002, ApJ, 574, 693
- Mukherjee & Halpern (2004) Mukherjee, R., & Halpern, J. 2004, Cosmic Gamma-Ray Sources, Eds. K.S. Cheng & G.E. Romero, 304, 311
- Nolan et al. (2003) Nolan, P. L., et al. 2003, ApJ, 597, 615
- Özel & Thompson (1996) Özel, M. E., & Thompson, D. J. 1996, ApJ, 463, 105
- Ransom et al. (2010) Ransom, S. M., et al., 2010, ApJ, 727, L16
- Reimer (2001) Reimer, O., 2001, in proc. ‘The Nature of Unidentified Galactic High-Energy Gamma-Ray Sources’, eds. A. Carraminana, O. Reimer, & D. J. Thompson (Kluwer Academic Publishers: Dordrecht), 17
- Reimer et al. (2001) Reimer, O., et al. 2001, MNRAS, 324, 772
- Reimer et al. (2003) Reimer, O., et al. 2003, ApJ, 588, 155
- Shaw et al. (2009) Shaw, M. S., et al. 2009, ApJ, 704, 477
- Sikora et al. (2009) Sikora, M., et al. 2009, ApJ, 704, 38
- Sowards-Emmerd et al. (2003) Sowards-Emmerd, D., et al. 2003, ApJ, 590, 109
- Sowards-Emmerd et al. (2004) Sowards-Emmerd, D., Romani, R. W., & Michelson, P. F. 2004, ApJ, 609, 564
- Sreekumar et al. (1999) Sreekumar, P., et al. 1999, APh, 11, 221
- Steinle et al. (1998) Steinle, H., et al., 1998, A&A, 330, 97
- Takahashi et al. (2007) Takahashi, T., et al. 2007, PASJ, 59S, 35
- Tavani et al. (2009) Tavani, M., et al. 2009, A&A, 502, 995
- Tawa et al. (2008) Tawa, N., et al. 2008, PASJ, 60S, 11
- Thompson et al. (1999) Thompson, D. J., et al. 1999, ApJ, 516, 297
- Torres et al. (2005) Torres, D. F., Dame, T. M., & Digel, S. W. 2005, ApJ, 621, L29
- Totani & Kitayama (2000) Totani, T., & Kitayama, T. 2000, ApJ, 545, 572
- Waxman & Loeb (2000) Waxman, E & Loeb, E. 2000, ApJ, 545, L11
- Yadigaroglu & Romani (1995) Yadigaroglu, I. A., & Romani, R. W. 1995, ApJ, 449, 211
- Zhang et al. (2007) Zhang, L., et al. 2007, ApJ, 666, 1165
| Name | RA | DEC | ||||
| [deg] | [deg] | [deg] | [deg] | [ ph cm-2 s-1] | [deg] | |
| 1FGL J1231.11410† | 187.80 | 14.17 | 295.53 | 48.41 | 14.90.7 | 0.03 |
| 3EG J12341318 | 188.19 | 16.30 | 296.43 | 49.34 | 21.65.3 | 0.76 |
| (EGR J12311412) | ||||||
| 1FGL J1311.73429§ | 197.95 | 34.49 | 307.69 | 28.19 | 11.71.1 | 0.04 |
| 3EG J13143431 | 198.51 | 34.52 | 308.21 | 28.12 | 18.73.1 | 0.56 |
| (EGR J13143417) | ||||||
| 1FGL J1333.25056§ | 203.30 | 50.94 | 107.32 | 64.90 | 4.51.0 | 0.15 |
| 3EG J13375029 | 204.39 | 50.49 | 105.40 | 65.04 | 9.22.6 | 0.72 |
| (EGR J13385102) | ||||||
| 1FGL J2017.30603‡ | 304.34 | 6.05 | 48.62 | 16.02 | 4.50.5 | 0.04 |
† Data consistent with no variability between EGRET and Fermi/LAT observations.
§ The -ray fluxes determined by EGRET and Fermi/LAT marginally consistent within level.
‡ Data consistent with no variability between EGRET and Fermi/LAT observations because of the EGRET detection limit ph cm-2 s-1.
| Name | OBS ID | Pointing Center∗ | Observation start | Effective exposure | |
|---|---|---|---|---|---|
| RA [deg] | DEC [deg] | (UT) | [ksec] | ||
| 1FGL J1231.11410 | 804017010† | 2009/07/08 22:53:48 | 23.8 | ||
| 804017020† | 2009/07/28 05:21:37 | 44.8 | |||
| 1FGL J1311.73429 | 804018010 | 2009/08/04 04:56:35 | 33.0 | ||
| 1FGL J1333.25056 | 804019010 | 2009/06/01 10:13:15 | 39.1 | ||
| 1FGL J2017.30603 | 804020010 | 2009/10/27 10:14:45 | 26.7 | ||
∗ The pointing centers were the positions given in 0FGL catalog (Abdo et al., 2009c).
† The requested continuous ks Suzaku exposure was interrupted by Target of Opportunity (ToO) observation of GRB 090708. For this reason the observation was divided into ks and ks segments before and after the ToO observation.
| Name | Position | Detection Significance | |||
|---|---|---|---|---|---|
| RA [deg] | DEC [deg] | [arcsec] | |||
| 1FGL J1231.4–1410 | — | ||||
| 1FGL J1311.7–3429 | src A | ||||
| src B | |||||
| 1FGL J1333.2+5056 | src A | ||||
| src B | |||||
| src C | |||||
| src D | |||||
| src E | |||||
| 1FGL J2017.3+0603 | — | ||||
| BB model | BBPL Model | |
| parameter | value & error | value & error |
| [ cm-2] | (fixed) | (fixed) |
| [keV] | 0.228 0.008 | |
| norm. (BB) | ||
| — | ||
| norm. (PL) | — | |
| d.o.f. | ||
| reduced | ||
| Flux | — | |
| erg cm-2 s-1 | ||
| (i) Standard Background | (ii) Ring Background | (iii) Lockman Hole Background | ||||
| BB | BBPL | BB | BBPL | BB | BBPL | |
| 134.71 | 56.16 | 67.21 | 18.97 | 39.77 | 23.97 | |
| d.o.f. | 34 | 32 | 30 | 28 | 38 | 36 |
| F value | 22.4 | 35.6 | 11.9 | |||
| Probability | 8.33 | 2.04 | 1.10 | |||
| src A | src B | |
| parameter | value & error | value & error |
| [ cm-2] | (fixed) | (fixed) |
| norm. | ||
| d.o.f. | ||
| reduced | ||
| Flux ( keV) | ||
| erg cm-2 s-1 |
| Source | Average count rate & Error | d.o.f. | Prob. |
|---|---|---|---|
| [ ct s-1] | [%] | ||
| src A | 46.08 | ||
| src B | 9.73 | ||
| src C | 22.28 | ||
| src D | 15.25 | ||
| src E | 7.86 |
| src A | src B | src C | src D | src E | |
| parameter | value & error | value & error | value & error | value & error | value & error |
| [ cm-2] | (fixed) | (fixed) | (fixed) | (fixed) | (fixed) |
| norm. [] | |||||
| d.o.f. | |||||
| reduced | |||||
| Flux ( keV) | |||||
| erg cm-2 s-1 |
| parameter | value & error |
|---|---|
| [ cm-2] | (fixed) |
| norm. | |
| d.o.f. | |
| reduced | |
| Flux ( keV) | |
| erg cm-2 s-1 |

(a) Blackbody Model
(b) BlackbodyPower-Law Model

(a) src A
(b) src B

(a) src A
(b) src B
(c) src C
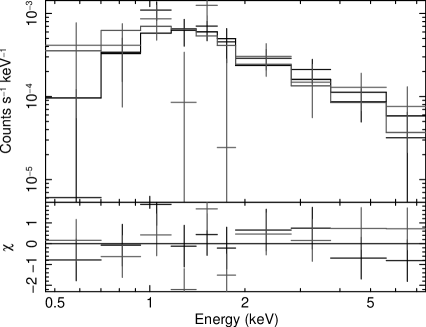
(d) src D
(e) src E