Further author information: (Send correspondence to Dr. Xu Zhou)
Dr. Xu Zhou: E-mail: zhouxu@bao.ac.cn, Telephone: 86 010 6486 3043
The i-band Sky brightness and Transparency at Dome A, Antarctica
Abstract
Based on the observations of the Chinese Small Telescope ARray (CSTAR), the band observing conditions at Antarctic Dome A have been investigated. The over all variations of sky brightness and transparency are calculated and subsequently cloud cover, contributions to the sky background from various factors including aurorae are derived. The median sky brightness of moonless clear nights is about 20.5 mag arcsec-2 in the SDSS band at the South Celestial Pole, which contains the diffused Galactic light of about 0.06 mag. There are no thick clouds in the year of 2008. Relatively strong aurorae are detected by their brightening the normal sky, which contribute up to about 2% of the observed images.
keywords:
transparency, sky brightness, Dome A, Aurora1 INTRODUCTION
In site selections for ground-based optical and IR astronomy, some of the most important parameters are the night-sky brightness, seeing, atmospheric transparency, clear nights and humidity. The number of clear nights provides the usable observing time. The sky background, seeing and atmospheric transparency have effect on the observation quality and depth. Humidity affects the telescope and infrared transparency.
The Antarctic plateau offers some attractive advantages for ground-based astronomical observations. It is a unique continent where there is no contamination from the artifacts. The average altitude in Antarctic plateau is more than 3000 m and the temperature is very low. Site testing over the past decade has revealed that Antarctica, relative to temperate latitude observatories, has lower infrared sky brightness, better free-atmosphere seeing, greater transparency, a lower turbulent boundary layer, and much lower water vapor content (see, e.g., reviews by Ref. 1, 2, 3).
Dome A is located at the highest peak of the continent. It has an elevation of about 4093 m. The year-round average temperature is about , dropping to as low as on occasion. Such high altitude, low temperature and special geographical position make it be very dry, cold and windless. It might be reasonably predicted that Dome A could be as good as or even a better astronomical site than Dome C (altitude of about 3250 m), with better seeing, higher transparency, and thinner surface layer. Ref. 4 compared the sites Dome A, B, C, F and Ridge A and B in their cloud cover, free-atmosphere seeing, precipitable water vapor, temperature, and auroral emission, and concluded that, overall, Dome A might be the best of the existing bases for astronomical observations.
It is necessary that some facilities for site tests should be installed at Dome A to assess the site quality. In 2008 January, two Chinese astronomers deployed several instruments at Dome A including a small telescope array named CSTAR. With the observation data of 2008, we leaned the observing conditions such as the sky brightness, transparency and cloud covers.
2 Observations
CSTAR was built by the Nanjing Institute of Astronomical Optics & Technology (NIAOT). It is composed of four co-aligned Schmidt telescopes on a fixed mounting pointing toward the South Celestial Pole. Each telescope has a different filter: , , , and open. The detectors are Andor DV435 1k1k CCDs with 13 m pixels, giving a plate scale of 15 arcsec pixel-1. The entrance pupil diameter is 145 mm and the effective aperture is 100 mm. Total field of view of each telescope is about 4.5 squared degrees. The main goals of this telescope are to detect variable stars and measure sky brightness, transparency, and cloud cover. Many telescope tests were performed at the Xinglong station before the telescope array was transported to Dome A [5].
Due to defocus and other problems of control systems, the data from telescopes of , and open bands are useless and only band data can be used to estimate those site parameters. In the whole winter, CSTAR observed over 310,000 images with integration times of 20 s or 30 s, giving a total exposure time of about 1728 hr [6]. Data reductions for these CCD frames were also done by specifically designed processing pipelines.
3 Results
3.1 Sky Brightness
There are sorts of sources contributing to the sky background such as scattering from the Sun and the Moon, airglow, zodiacal light, aurorae, star light and interstellar dust scattering, extragalactic light, and artificial light contamination [7, 8]. Artificial light pollution is essentially non-existent in Antarctica. Main contributions to the sky brightness come from the the atmospheric scattering of the light of the Sun and the Moon. Zodiacal light might contribute up to half the intrinsic sky brightness if the Sun and Moon are down below the ground. For the pointing of CSTAR, the ecliptic longitude of the South Celestial Pole is about and latitude is . Thus, the zodiacal light have little effect on the sky background. On the other hand, we expect an increased contribution from the Milky Way, since the Galactic latitude of the South Celestial Pole is , relatively close to the Galactic plane. By the Pioneer 10 and 11 spacecraft observations of the total Galactic plus extragalactic sky background in blue (395–485 nm) and red (590–690 nm). We estimate the contribution of the diffused Galactic light to the sky brightness to be about 0.06 mag in band.
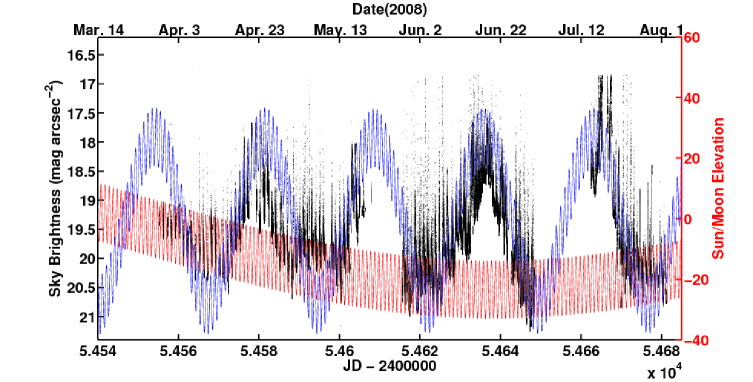
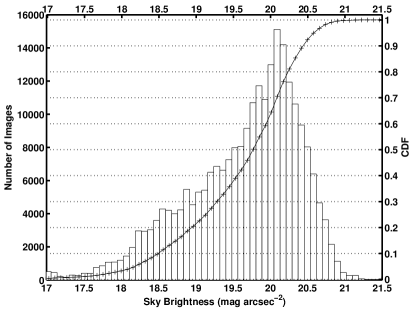
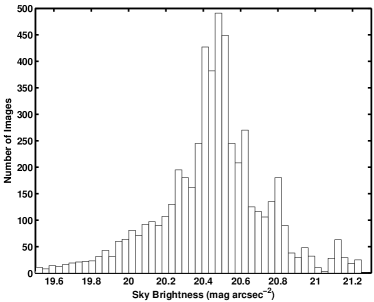
Figure 1 shows the sky brightness variations throughout the whole winter of 2008. At such far-southerly latitudes as Dome A, the Moon is always fairly full whenever it is above the horizon. Therefore, we can see that there is a strong correlation between lunar elevation (including the correction for parallax) and sky brightness. The situation should be seriously considered during the future astronomical observations at Dome A. Figure 2 shows the sky brightness distribution at Dome A. The most probable sky brightness, across all lunar phases in the left panel of the figure, is about 20.1 mag arcsec-2 and the median is 19.8 mag arcsec-2. The right panel of Figure 2 shows the sky brightness distribution of images taken only on moonless and clear nights during 2008 June. In these images, the Sun and the Moon elevation is below and there is no cloud. We find that the median sky brightness is 20.5 mag arcsec-2.
 |
|
We compare our -band sky brightness at Dome A with those of La Palma, Cerro Tololo, and Paranal. The following median -band sky brightnesses are calculated: 20.10 mag arcsec-2 at La Palma (at sunspot minimum; Ref. 9), 19.93 at Paranal (at sunspot maximum; Ref. 10), 20.07 at Cerro Tololo (at sunspot minimum; Ref. 11, 12) and 19.57 at Calar Alto (at sunspot maximum; Ref. 13). The clear dark sky brightness of 20.5 mag arcsec-2 at Dome A can make a tentative conclusion that under moonless clear conditions, Dome A has a darker sky background than the above astronomical sites, even allowing for calibration and other uncertainties of up to several tenths of a magnitude.
3.2 Transparency
Because CSTAR is fixed to point to the South Celestial Pole, we can not get the absolute atmospheric extinction. However, we can easily calculate the relative variation of the transparency by flux differences of selected bright stars between the observed frame and a reference frame which is chosen to be observed under good weather conditions.
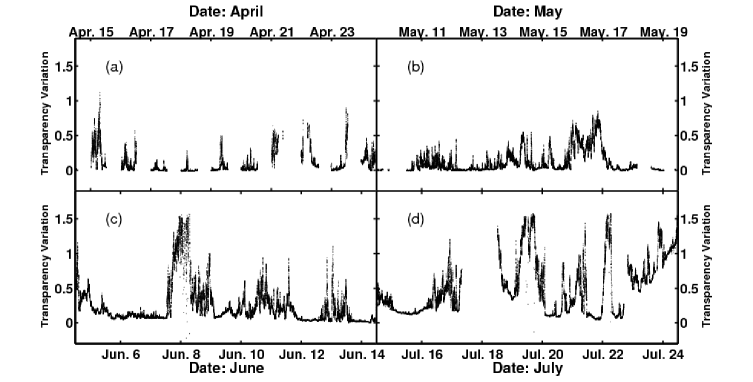 |
Figure 3 shows the relative transparency variation within 10 day periods in each month from April to July. From April 15 to June 2, the transparency was relatively stable with many days showing high transparency. In June and July, although the sky reaches its darkest, the transparency became a little worse. We use these observed relative transparency variations to infer the distribution of the optical thicknesses of cloud at Dome A during 2008. For a rough comparison with another observatory, Table 1 shows the approximate fraction of cloud of various thicknesses at Mauna Kea. The data for the table come from the Gemini Observatory 111http://www.gemini.edu/sciops/telescopes-and-sites/observing-condition-constraints. In this table, no thick cloud cloud cover at Dome A exists and it seems that there are more fraction of photometric conditions at Dome A than Mauna Kea. These conclusions are only tentative due to the limited observed sky region of CSTAR, and the fact that the data at Dome A only come from one winter of 2008.
| Mauna Kea (Gemini) | Dome A | ||
|---|---|---|---|
| Cloud Cover | Extinction () | Fraction | Fraction |
| Any other usable | 10% | 0 | |
| Cloudy | 2–3 | 20% | 2% |
| Patchy cloud | 0.3–2 | 20% | 31% |
| Photometric | 50% | 67% | |
Note: The definition of cloud cover is adopted from the Gemini Observatory. For comparison, we use in extinction for the different tranparencies of these two bands as presented in the text. Note that the term ‘photometric’ as used here is just one kind of cloud cover category and it is different from the normal term ‘photometric night’.
3.3 Auroral Contribution
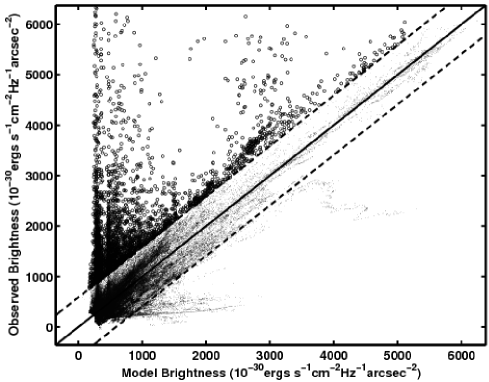
Aurora is an important source polluting the observed images especially in the polar regions. The generation of aurorae originates from the interaction between the high-speed charged particles from the Sun and the atoms and molecules in the upper atmosphere of the Earth under the force from the geomagnetic field. Transition radiations mainly from the Nitrogen and Oxygen brighten the normal sky background. So we can detect the aurorae by removing the contributions to the sky brightness from the solar and lunar light and the extinction effect from the clouds. Equation 1 presents our idea of auroral detection exactly.
| (1) |
where the sky brightness, and are the contributions from the Sun and Moon, is the extinction and a, b and c are the constants to be fitted. and can be modeled with the data which are dominated only by the contributions of either the Sun or the Moon. After fitting with the observed data, we can get the model sky brightness at any time. Then those frames which are 3 above the model brightness (as shown in circles in Figure 4) should be polluted by aurorae. We estimate that about 2% of all the images are contaminated by aurorae.
 |
Acknowledgements.
This study has been supported by the Chinese National Natural Science Foundation through grants 10873016, 10803007, 10473012, 10573020, 10633020, 10673012, and 10603006, and by the National Basic Research Program of China (973 Program), No. 2007CB815403. This research is also supported by the Chinese PANDA International Polar Year project and the Polar Research Institute of China (PRIC). The support of the Australian Research Council and the Australian Antarctic Division for the PLATO observatory is gratefully acknowledged. The authors thank all members of the 2008 and 2009 PRIC Dome A expeditions for their heroic effort in reaching the site and for providing invaluable assistance to the expedition astronomers in setting up and servicing the PLATO observatory and its associated instrument suite. Iridium communications were provided by the US National Science Foundation and the United States Antarctic Program. Additional financial contributions have been made by the institutions involved in this collaboration. We thank K. Mattila for helpful discussions on the diffuse Galactic light at the South Celestial Pole.References
- [1] Aristidi, E., et al., “Site testing in summer at Dome C, Antarctica”, A&A, 444, pp. 651–659, 2005.
- [2] Burton, M. G., et al., “Science Programs for a 2-m Class Telescope at Dome C, Antarctica: PILOT, the Pathfinder for an International Large Optical Telescope”, PASA, 22, pp. 199–235, 2005.
- [3] Storey, J. W. V., Lawrence, J. S., & Ashley, M. C. B., “Site-testing in Antarctica”, RevMexAA, 31, pp. 25–29, 2007.
- [4] Saunders, W., Lawrence, J. S., Storey, J. W. V., Ashley, M. C. B., Kato, S., Minnis, P., Winker, D. M., Liu, G., Kulesa, C., “Where Is the Best Site on Earth? Domes A, B, C, and F, and Ridges A and B”,pasp,121, pp. 976–992, 2009
- [5] Zhou, X., et al.,“Testing and data reduction of the Chinese Small Telescope Array (CSTAR) for Dome A, Antarctica”, RAA, 10, pp. 279–290, 2010
- [6] Zhou, X., et al., “The First Release of the CSTAR Point Source Catalog from Dome A, Antarctica”, PASP, 122, pp. 347–353, 2010
- [7] Leinert, C., et al., “1997 reference of diffuse night sky brightness (Leinert+ 1998)”, VizieR Online Data Catalog, 412, 1997.
- [8] Benn, C. R., & Ellison, S. L., “Brightness of the night sky over La Palma”, New Astron. Rev., 42, pp. 503–507, 1998.
- [9] Benn, C. R., & Ellison, S. L., “La Palma Tech. Note, 115”, 1998.
- [10] Patat, F., “UBVRI night sky brightness during sunspot maximum at ESO-Paranal”, A&A, 400, pp. 1183–1198, 2003.
- [11] Walker, A., “N.O.A.O. Newsletter, No. 10”, 1987.
- [12] Walker, A., “N.O.A.O. Newsletter, No. 13”, 1988
- [13] Sánchez, S. F., Aceituno, J., Thiele, U., Pérez-Ramírez, D., & Alves, J.,“The Night Sky at the Calar Alto Observatory”, PASP, 119, pp. 1186–1200, 2007.