E-mail: ovoz@sai.msu.ru
Atmospheric transparency in the optical and near IR range above the Shatdzhatmaz summit
Abstract
The study of atmospheric extinction based on the MASS data has been carried out using the classical photometric pairs method. The extinction in V band can be estimated at . The water vapour content has been derived from GPS measurements. The median value of PWV for clear nights is equal to 7.7 mm.
keywords:
site testing, extinction, MASS, PWV, GPS1 Atmospheric extinction in the MASS spectral band
MASS-DIMM instrument has been working on Shatdzhatmaz summit for over three years. Being developed for scintillation measurements, MASS is a proper photoelectric photometer. We use star fluxes measured by MASS in the greater apertures C and D for the atmospheric extinction investigation[1]. We do not apply the Bouguer method because it implies the stability of atmospheric extinction during the night. Unfortunately, such conditions generally do not take place, particularly in the Caucasus. To allow for extinction variations we employ a method based on photometric pairs. Unlike the classical one, we use instrumental magnitudes of extinction stars. It was necessary, therefore, to make a list of stars with determined instrumental magnitudes in the MASS photometrical band ( = 481 nm).
Seventeen stars were selected by following criteria: non-variable, approximately A0 spectrum, high culminating in the Caucasus. We observed these stars from August 2008 to October 2010. Each clear night they were measured every 1.5 hours on equal and different air masses. To derive the only best nights with small transparency variations have been selected. The system of 1065 equations with 171 unknowns has been worked out. The unknowns are of 17 standard stars and the effective extinctions of 154 nights. As the zero point of our photometric system we have chosen a star Gem of A0IV type with . We assign to of this star its value from BS catalogue. The system has been solved by the least squares method. Table 1 lists the derived magnitudes. Their errors average out to , which introduce an error of about into the extinction calculation.
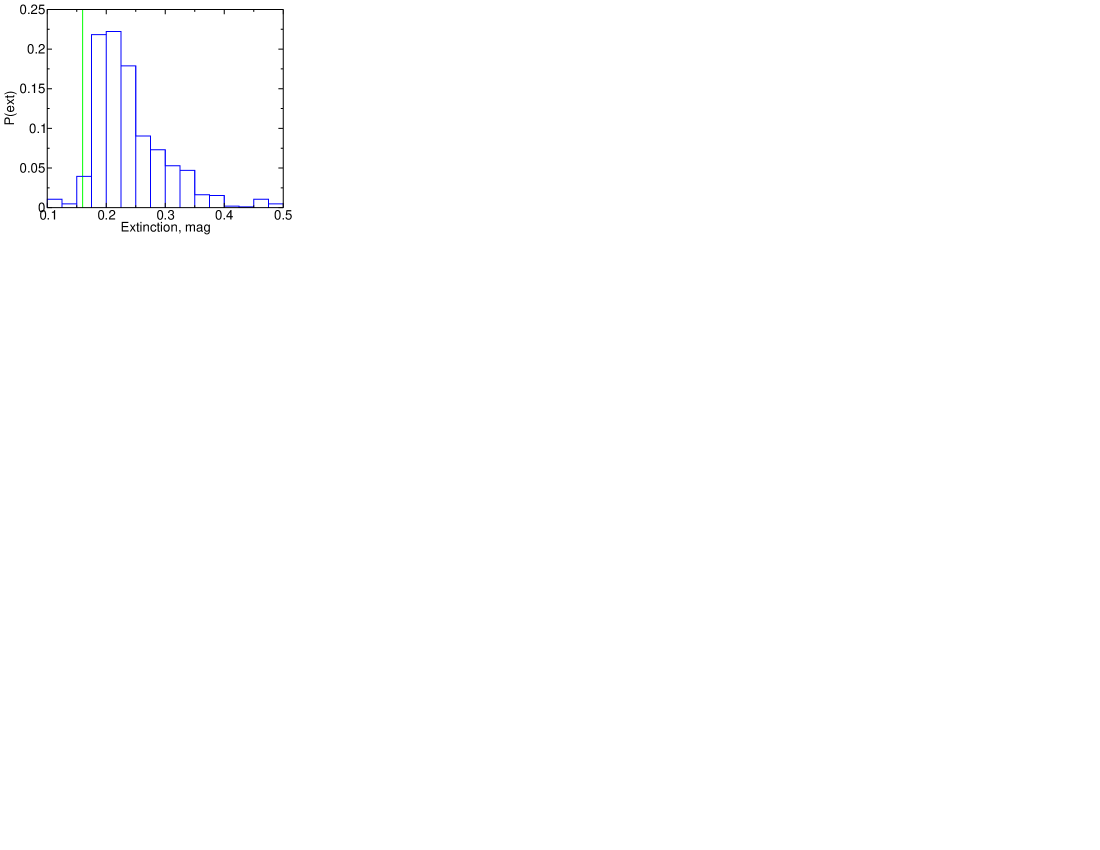
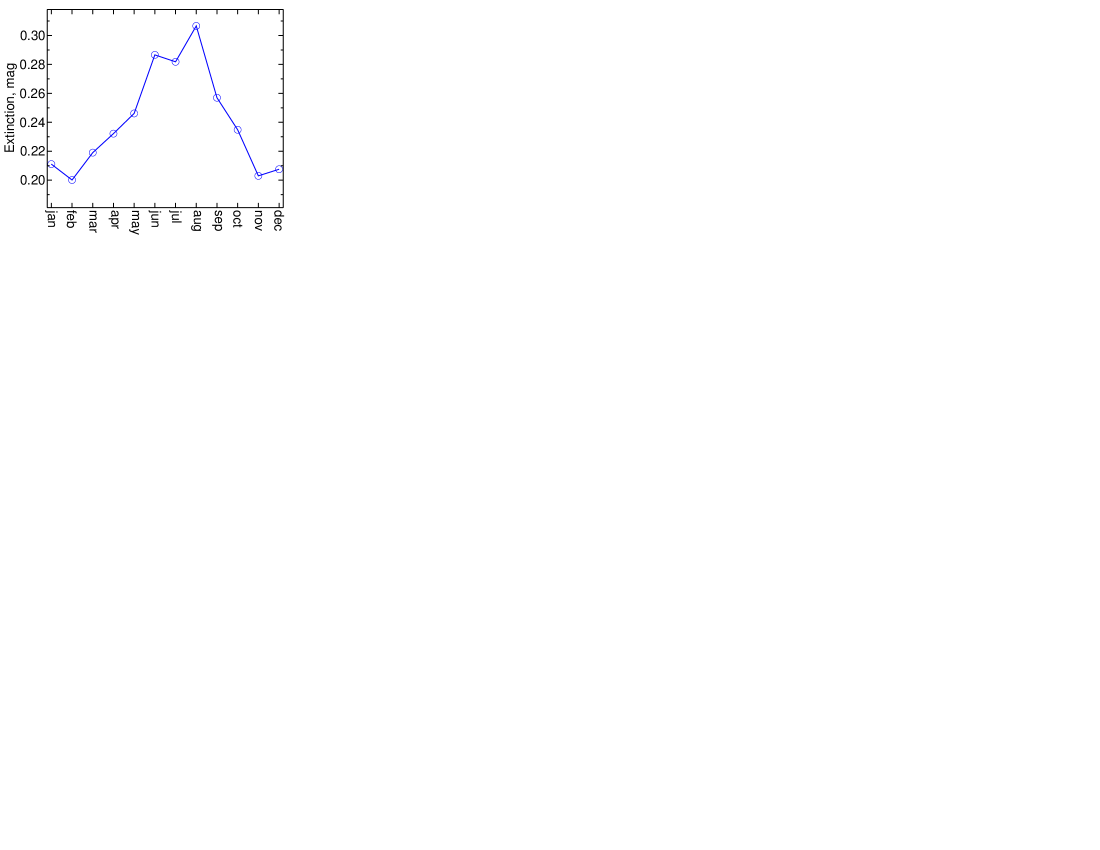
Using magnitudes from Table 1 we obtain the fine extinction variation during the night. In Fig. 1 (left) the distribution of 1040 extinction measurements is presented . The median is (1st quartile, ; 3rd quartile, ). The theoretical Rayleigh extinction for Shatdzhatmaz summit (2100 meters above sea level) is in the band and in band111The atmospheric transparency was modelled using MODTRAN[2] for A0V type.. The total extinction in band can be estimated at on the assumption that aerosol is neutral.
In Fig. 1 (right) the seasonal behaviour of the median extinction is shown. One can see that minimum extinction is observed in winter. In the same period there are many clear nights.
| star | type | ||||
|---|---|---|---|---|---|
| Ari | 01 54 38 | +20 48 29 | 2.721 | 0.003 | A5V |
| Tri | 02 09 33 | +34 59 14 | 3.084 | 0.003 | A5II |
| Tau | 03 47 29 | +24 06 18 | 2.841 | 0.003 | B7IIIe |
| Tau | 05 26 18 | +28 36 27 | 1.605 | 0.002 | B7III |
| Gem | 06 37 43 | +16 23 57 | 1.930 | 0.000 | A0IV |
| UMa | 11 01 51 | +56 22 57 | 2.342 | 0.002 | A1V |
| Leo | 11 14 07 | +20 31 25 | 2.612 | 0.003 | A4V |
| Leo | 11 49 04 | +14 34 19 | 2.181 | 0.005 | A3V |
| UMa | 11 53 50 | +53 41 41 | 2.423 | 0.003 | A0Ve |
| UMa | 12 54 02 | +55 57 35 | 1.749 | 0.002 | A0pCr |
| UMa | 13 47 32 | +49 18 48 | 1.780 | 0.003 | B3V |
| Dra | 17 08 47 | +65 42 53 | 3.116 | 0.003 | B6III |
| Her | 17 15 02 | +24 50 21 | 3.158 | 0.003 | A3IV |
| Lyr | 18 58 57 | +32 41 22 | 3.221 | 0.003 | B9III |
| Aql | 19 05 25 | +13 51 48 | 2.989 | 0.004 | A0Vn |
| Cep | 21 18 35 | +62 35 08 | 2.562 | 0.003 | A7V |
| Peg | 23 04 46 | +15 12 19 | 2.466 | 0.005 | B9Vs |
 |
 |
2 Atmospheric transparency in the near IR range
As well known, the transparency of the atmosphere in the IR range is determined by the water vapour content. We estimate the amount of precipitable water using zenith wet delay of GPS signal[3]. Since the Caucasus is a rather wet region, the accuracy of this method is sufficient. The GPS data were obtained from a GPS receiver222The GPS receiver was installed by Sternberg Astronomical Institute in the frame of the geodynamics research., located on the territory of the Solar Station at a distance of 800 meters from the MASS-DIMM tower. The meteo station is 100 meters away from GPS. The meteo data were kindly provided by the Kislovodsk station of the A.M.Obukhov Institute of Atmospheric Physics (Russian Academy of Sciences).
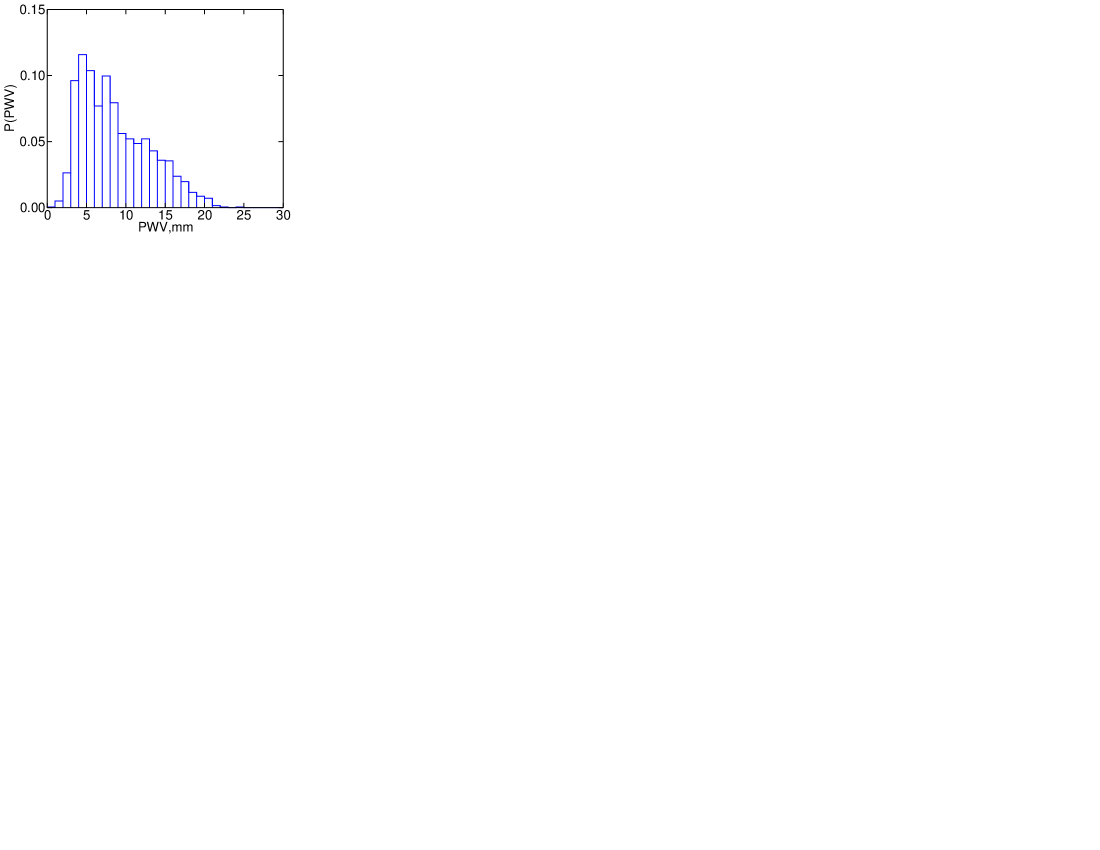
The median value of PWV estimated on the total GPS data set is equal to 9.1 mm (1st quartile, 6.1 mm; 3rd quartile, 13.9 mm). Distribution of PWV on clear nights is given in Fig. 2 (left). The median of this sample is 7.7 mm (1st quartile, 5.1 mm; 3rd quartile, 11.8 mm). The 7.7 mm corresponds to atmospheric extinction for A0V-star in J band of , in H and K bands of . The water vapour content displays an obvious seasonal cycle (Fig. 2, right), most likely due to seasonal course of temperature. It is seen that winter and spring are the best seasons for infrared observations.
 |
 |
3 Some attempts to predict atmospheric conditions from ground-based meteorological observations.
It would be useful to find a way to predict the night sky conditions by means of simple weather observations. To clear sky monitoring we use the Boltwood cloud sensor located at the Solar Station. The meteo data are provided by the Kislovodsk station of the A.M.Obukhov Instutute of Atmospheric Physics and our automatic site monitor (ASM)[4].
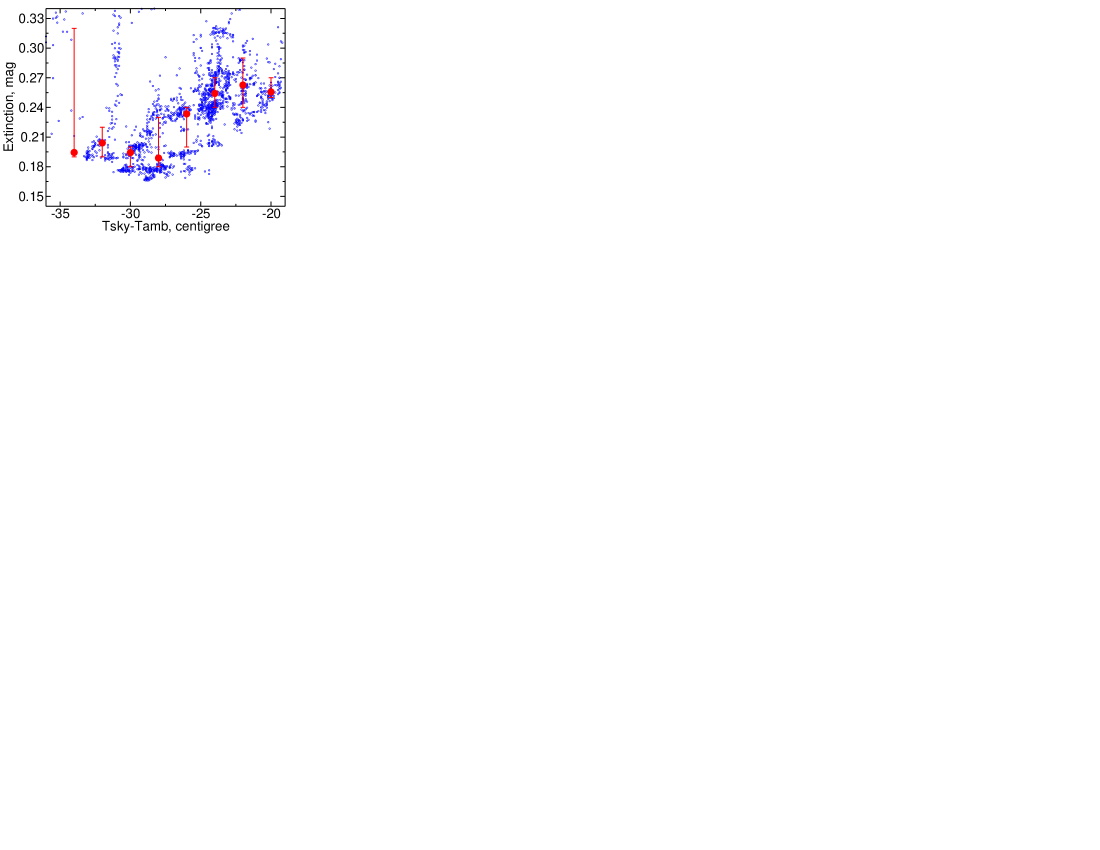
The relationship between sky temperature and atmospheric extinction in the band is shown in Fig. 3 (left).
We have calculated surface absolute humidity using the dew point temperature and air temperature. Absolute humidity is the density of water vapour . From the ideal gas law equation:
where is water vapour pressure in ,
is the specific gas constant for water
vapour, and
is the temperature in degrees Celsius.
From Magnus-Tetens approximation[5]:
where is the dew point temperature in degrees Celsius.
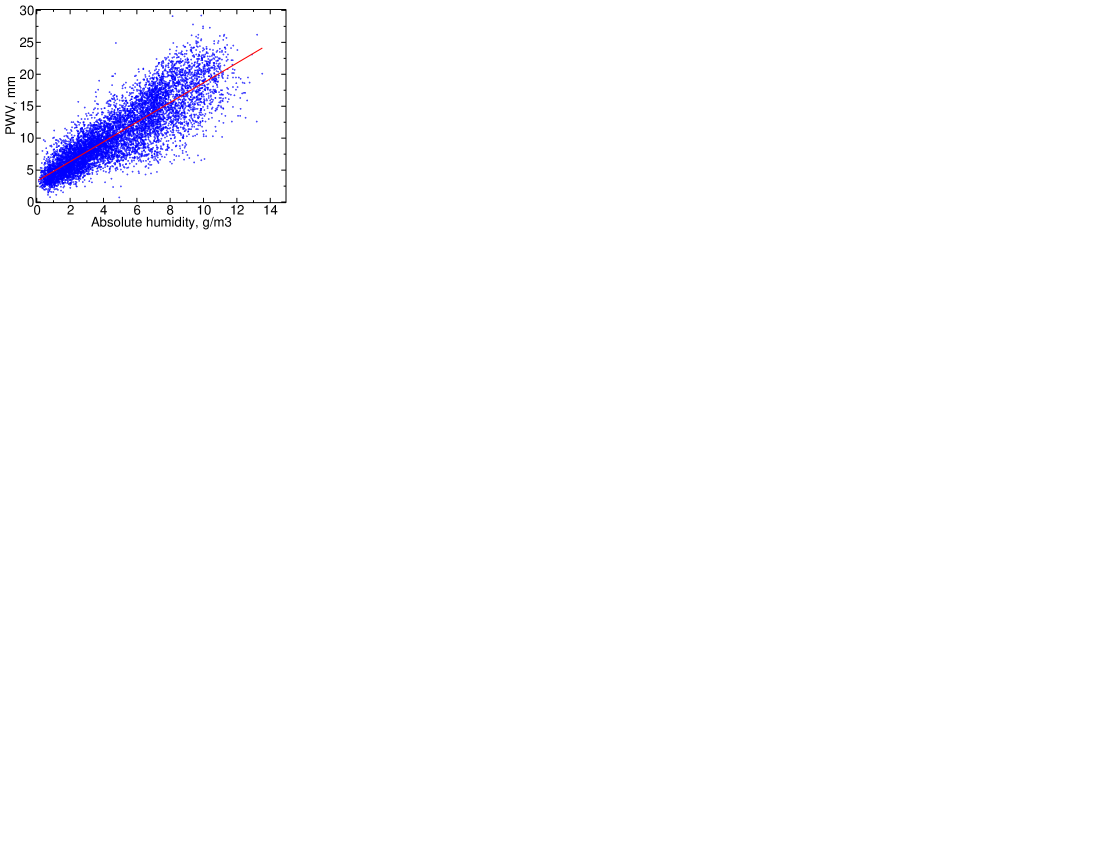
Fig. 3 (right) represents surface absolute humidity versus column of precipitable water vapour. This relationship can be fitted by the linear regression: , where is measured in , is the surface absolute humidity in . Rms error is 2.62 mm.
Figurs 3 show a quite wide scatter, which means that we have to look for additional parameters of these relations.
 |
 |
4 Conclusions
MASS data can be useful not only for atmospheric profiling but also for transparency measuring, e.g., for realtime observation scheduling by photometric stability criterion.
In spite of rather high humidity the observations in the near IR range may be carried out in the Caucasus region.
Acknowledgements.
I am grateful to Dr. V. G. Kornilov for valuable advices, to Obukhov Institute of Atmospheric Physics and I. A. Senik for kindly provided meteo data, to A. O. Ivlev (Research and Production Corporation ”Precision Instrumentation Systems”) for MODTRAN interface and to gravimetric team of Sternberg Astronomical Institute for assistance with GPS data processing.References
- [1] Kornilov, V., Tokovinin, A., Shatsky, N., Voziakova, O., Potanin, S., and Safonov, B., “Combined MASS-DIMM instruments for atmospheric turbulence studies,” MNRAS 382, 1268–1278 (Dec. 2007).
- [2] Berk, A., Bernstein, L. S., and Robertson, D. C., “MODTRAN: A moderate resolution model for LOWTRAN,” tech. rep. (July 1987).
- [3] Bevis, M., Businger, S., Chiswell, S., Herring, T. A., Anthes, R. A., Rocken, C., and Ware, R. H., “GPS Meteorology: Mapping Zenith Wet Delays onto Precipitable Water,” Journal of Applied Meteorology 33, 379–386 (Mar. 1994).
- [4] Kornilov, V., Shatsky, N., Voziakova, O., Safonov, B., Potanin, S., and Kornilov, M., “First results of a site-testing programme at Mount Shatdzhatmaz during 2007-2009,” MNRAS 408, 1233–1248 (Oct. 2010).
- [5] Barenbrug, A., [Psychrometry and psychrometric charts ], Cape Town, S.A.: Cape and Transvaal Printers Ltd. (1974).