Send correspondence to A.S.G.
A.S.G.: E-mail: gusev@sai.msu.ru
Astroclimate on Mt. Maidanak Observatory by AZT–22 1.5m telescope observations
Abstract
We present results of Mt. Maidanak Observatory astroclimate study. Our data based on AZT–22 1.5m telescope observations in 1996–2005.
keywords:
Astroclimate, seeing, Maidanak1 INTRODUCTION
Mount Maidanak Observatory at Ulugh Beg Astronomical Institute (UBAI) of Uzbek Academy of Sciences located in the South Uzbekistan, on the slopes of the Baisun range, at an altitude of 2600 m.
Brief history. The Sternberg Astronomical Institute (SAI) of Moscow State University began first studies of the astronomical conditions at the most promising sites in the Central Asia in the end of the 1960s. One of the principal criteria used to select the telescope site was that the peak be isolated. In 1975, the SAI performed measurements of the astronomical climate at Mt. Maidanak with a two-beam instrument. Visual estimations showed the seeing . Later SAI installed 3 telescopes (1.5m AZT–22 and two smaller instruments) on the observatory. Currently, all telescopes belong to the Mt. Maidanak Observatory of the UBAI.
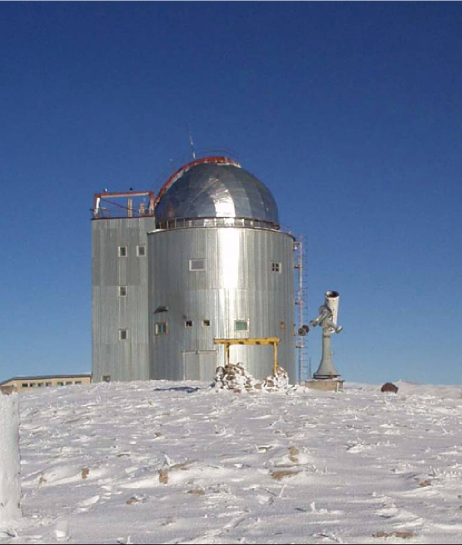
1.5m AZT–22 telescope (Fig. 1) was designed by Leningrad Optics and Mechanics Amalgamation (LOMO). It was installed at Mt. Maidanak at the end of the 1980s, and made its first light detection in 1991. A two mirror quasi-Ritchey–Chretien system with a relative aperture of 1:8 is the principal optical system of the telescope.
Astroclimate. The results of extensive studies of the observing conditions at Mt. Maidanak performed in the 1960s and 1970s were confirmed in the last decade with a series of observations of the astronomical climate using modern techniques. The four-year observations (1996-99) using the Differential Image Motion Monitor (DIMM) revealed a mean seeing of (Ehgamberdiev et al.[1]). Later studies of the atmosphere at Mt. Maidanak with the MASS instrument (Kornilov et al.[2]) detected a free–atmosphere seeing of at heights of 0.5 km and more above the level of Mt. Maidanak. Here we are presenting the study of the realistic seeing of CCD images obtained on the AZT–22 telescope.
2 DATA
To estimate the seeing based on a large sample of CCD observations obtained at the 1.5m telescope, we used CCD images (21610 frames) of various astronomical objects in the (1871), (3818), (4369), (8415), and (3137) filters available at the SAI. These observations were performed in 1996–2005 with CCD cameras.
We estimated the seeing using the sizes of stars in the CCD frames, taking a star’s visible size to be its FWHM profile diameter. For most of the images we used, the scale is per pixel. Typical exposure times of our observations were 5–300 s.
 |
 |
3 RESULTS
3.1 CCD seeing
Dependence of the CCD seeing on exposure time. Dependence between the image size and the exposure time due to the telescope drive in hour angle. To remove the dependence, we measured the sizes of stellar images along the , which are independent of the exposure time.
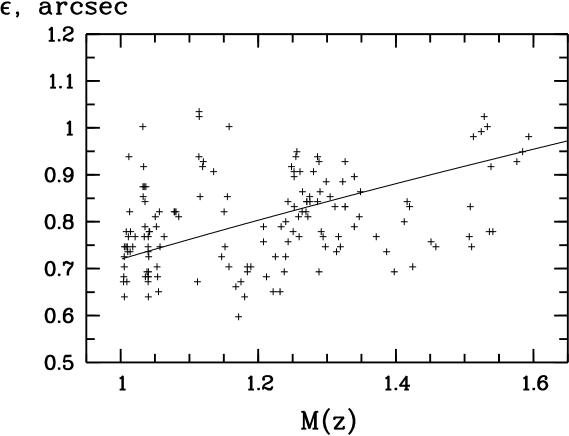
Dependence of the CCD seeing on air mass. For seeing and air masses , there is a known relation for the seeing: (Sarazin and Roddier[3]):
| (1) |
For the data shown in Fig. 2, .
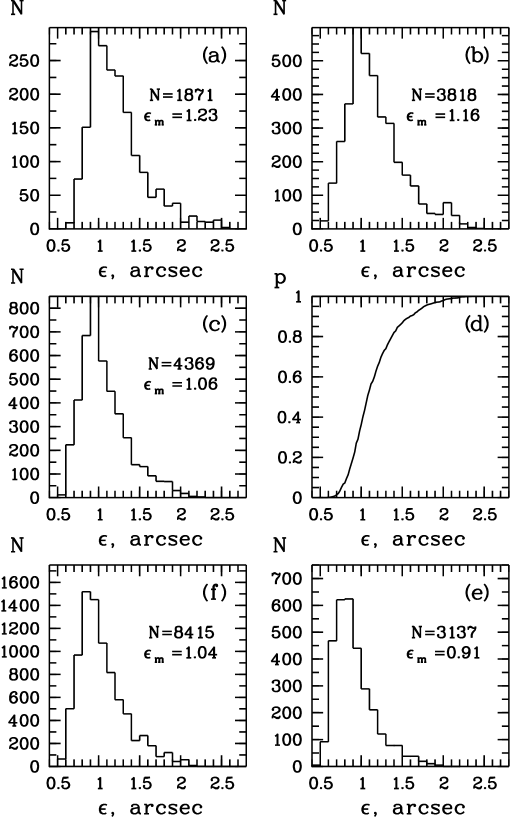 |
Seeing from CCD images in various filters. Fig. 3 presents histograms of the seeing measured in the , , , , and bands, as well as the integrated seeing in the band. The median seeing, , ranges from in to in . The seeing in varies from to , with . The number of images with does not exceed , and the number with does not exceed (Fig. 3d).
The derived median seeing values in the various photometric bands are in good agreement with the following relation between and :
| (2) |
where is the wavelength (in Å) for the maximum transparency of the corresponding filter.
Using the median values and for the AZT–22 frames, we estimated the characteristic seeing reduced to unit air mass, . According to Eq. (1), . Since, strictly speaking, Eq. (1) is valid only for the free atmosphere, our estimate of should be treated cautiously.
 |
| Number of | Number of | Total | ||
|---|---|---|---|---|
| Month | observation | observation | number of | |
| years | nights | frames | ||
| January | 1 | 2 | 59 | 1.29 |
| February | 1 | 7 | 459 | 1.08 |
| March | 0 | 0 | 0 | – |
| April | 1 | 5 | 213 | 1.44 |
| May | 2 | 10 | 399 | 1.32 |
| June | 4 | 38 | 1424 | 1.34 |
| July | 5 | 63 | 1838 | 1.08 |
| August | 6 | 44 | 1366 | 1.10 |
| September | 6 | 93 | 5542 | 1.06 |
| October | 9 | 93 | 5186 | 1.01 |
| November | 7 | 68 | 4024 | 1.04 |
| December | 3 | 17 | 1100 | 1.29 |
| Total | 10 | 440 | 21610 | 1.06 |
 |
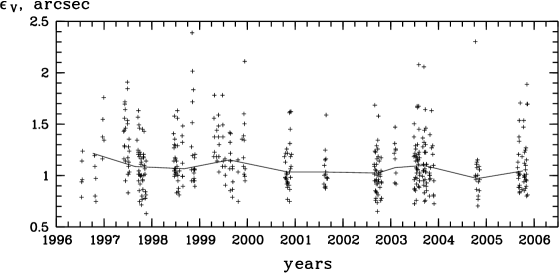
CCD seeing over years. Fig. 4 displays the -band seeing for each observing night (nightly median values are plotted). In total, we reduced data for 440 nights between July 1996 and November 2005.
The scatter of the nightly mean values is fairly large: from to , but the seeing is – on most nights. During the entire observation period, was better than on only two nights () and better than on 31 nights ().
To estimate long-term seeing trends, we calculated the median values for each observation year.
Excluding the data for 1996 (a year with poor statistics, with only 15 observation nights), we find that the seeing did not change during the studied period, on average. The range of was (2005) – (1999).
CCD seeing over months. The best seeing is achieved in Autumn (with the median for October observations), while the worst seeing is obtained in the Winter–Spring (with reaching in April). Table 1 shows the months seeing statistics. Our data generally reproduces the results of Ehgamberdiev et al.[1].
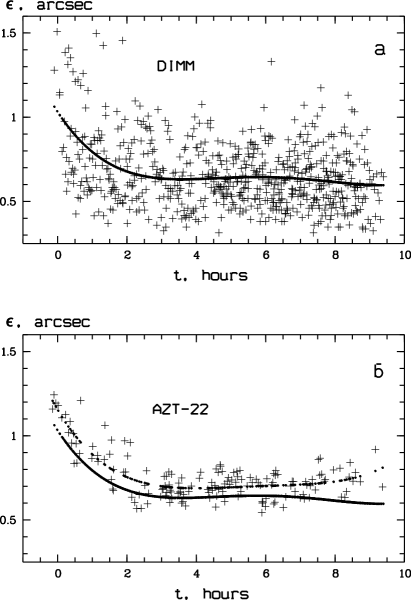
3.2 Time for relaxation to stationary conditions in the free atmosphere and under the AZT–22 dome
To estimate the time for relaxation to stationary atmospheric conditions under the AZT–22 dome with the ventilation on, we analyzed the variations of the CCD and seeing during the course of a night for eight nights with . Note, here we used the values reduced to unit air mass in accordance with Eq. (1). The results show that the time scale for relaxation to stationary conditions under the dome is 2–2.5 hours after the end of astronomical twilight (Fig. 5b). Fig. 5a shows the seeing measured on the same nights with the DIMM (Ehgamberdiev et al.[1]) mounted near the AZT–22 tower.
Simultaneous seeing estimates with the DIMM and at the AZT–22 can be used to estimate the influence of the space under the telescope dome. The seeing in the free atmosphere differs from that under the dome by about when the ventilation is on (Fig. 5a). A powerful ventilation system is able to create a laminar flow and to improve the seeing to within 15 minutes for similar telescopes and dome construction (Artamonov et al.,[4]). The AZT–22 ventilation system is probably not strong enough to provide an appreciable improvement in the seeing. The relaxation of the thermal conditions under the AZT–22 dome takes approximately the same time as in the free atmosphere. The difference between the DIMM and AZT–22 estimates remains constant, and this remains unexplained for the moment.
Acknowledgements.
This study was supported by the Russian Foundation for Basic Research (project nos. 08–02–01323, 09–02–00244, and 10–02–91338).References
- [1] S. A. Ehgamberdiev, A. K. Baijumanov, S. P. Ilyasov, M. Sarazin, Y. A. Tillaev, A. A. Tokovinin, and A. Ziad, “The astroclimate of maidanak observatory in uzbekistan,” Astron. and Astrophys. Suppl. 145, pp. 293–304, 2000.
- [2] V. Kornilov, S. Ilyasov, O. Vozyakova, Y. Tillaev, B. Safonov, M. Ibrahimov, N. Shatsky, and S. Egamberdiev, “Measurements of optical turbulence in the free atmosphere above mount maidanak in 2005-2007,” Astron. Lett. 35, pp. 547–554, 2009.
- [3] M. Sarazin and F. Roddier, “The eso differential image motion monitor,” Astron. and Astrophys. 227, pp. 294–300, 1990.
- [4] B. P. Artamonov, V. V. Bruevich, A. S. Gusev, O. V. Ezhkova, M. A. Ibrahimov, S. P. Ilyasov, S. A. Potanin, Y. A. Tillaev, and S. A. Ehgamberdiev, “Seeing and atmospheric extinction at mt. maidanak observatory from observations with the 1.5-m azt-22 telescope,” Astron. Rep. 54, pp. 1019–1031, 2010.