Are C60 molecules detectable in circumstellar shells of R Coronae Borealis stars?
Abstract
The hydrogen-poor, helium-rich and carbon-rich character of the gas around R Coronae Borealis (RCB) stars has been suggested to be a site for formation of C60 molecules. This suggestion is not supported by observations reported here showing that infrared transitions of C60 are not seen in a large sample of RCB stars observed with the Infrared Spectrograph on the Spitzer Space Telescope. The infrared C60 transitions are seen, however, in emission and blended with PAH-features in spectra of DY Cen and possibly also of V854 Cen, the two least hydrogen-deficient (hydrogen deficiency of only 10100) RCB stars. The speculation is offered that C60 (and the PAHs) in the moderately H-deficient circumstellar envelopes may be formed by the decomposition of hydrogenated amorphous carbon but fullerene formation is inefficient in the highly H-deficient environments of most RCBs.
1 Introduction
R Coronae Borealis stars (RCBs, hereafter) stars are a rare class of supergiants whose atmospheres are extremely hydrogen-deficient - the H-deficiency ranges from about a factor of 10100 to at least 108 - with helium the most abundant element and often the stars are carbon-rich (e.g., Lambert & Rao 1994). RCBs at unpredictable intervals form thick carbon dust clouds which if they form above the Earth-facing stellar surface can obscure the star causing a decrease up to eight magnitudes in the visual band and a decline can last from a few weeks to many months.
The RCB’s hydrogen deficiency together with the helium- and carbon-rich character of the gas may facilitate the formation of molecular and dust species not seen in circumstellar envelopes of normal stars. In particular, these envelopes have been considered to be possible environments for the formation of the buckminsterfullerene molecule C60 (e.g., Goeres & Sedlmayr 1992). The remarkable stability of C60 against intense radiation, ionization, etc. (e.g., Kroto 1987) reinforces the idea that fullerenes such as C60 could be present in the interstellar medium were they formed in and ejected from circumstellar envelopes of one or more kinds of mass-losing star.
Are RCB stars a source of C60 molecules? Early observations of three RCB stars (R CrB, RY Sgr, and V854 Cen) at a resolution R=1000 around 8.6m searched for the 8.4m C60 feature and reported a negative result (Clayton et al. 1995). With the advent of the Spitzer Space Telescope, we undertook a new search for C60 around RCBs. Identification of the C60 molecule can be done in the infrared domain, where there are infrared transitions centered at 7.0, 8.4, 17.4 and 18.8 m according to gas-phase laboratory spectroscopy (Frum et al. 1991; Nemes et al. 1994). In this paper, we report two results. The first is that fullerenes are not seen around most RCBs. The second is that the C60 IR transitions are present along with transitions due to PAHs in the spectrum of DY Cen and possibly also in the spectrum of V854 Cen, which are the two least H-deficient RCBs known. Spitzer observations have very recently provided evidence for C60 and C70 from planetary nebulae (PNe; Cami et al. 2010; García-Hernández et al. 2010) and reflection nebulae (Sellgren et al. 2010). None of these environments is H-deficient. Although Cami et al. declare their observations refer to a H-poor region of the PN Tc 1, the literature does not support their claim (see below). These detections of fullerenes with our detection of C60 from RCBs with a modicum of H suggests that formation of fullerenes may require some H in addition to C.
2 Spitzer observations and infrared spectra
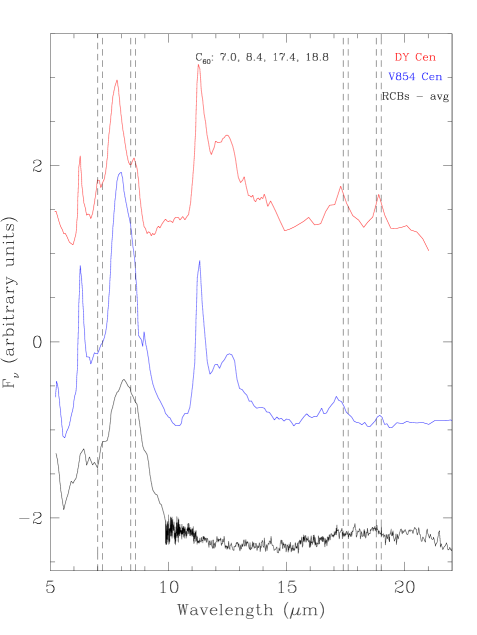
We have recently conducted an infrared spectral survey with the Infrared Spectrograph (IRS) on the Spitzer Space Telescope for a complete sample (30) of RCB stars spanning a full range of hydrogen content, temperature and composition. The spectral energy distributions (0.440 m) were constructed for all RCB stars in this sample (see García-Hernández et al. 2011 for more details). Since here we are interested in the emission and absorption features present in the 6-25 m window, we interpolate between several points in the dust continuum and subtract this baseline to provide the residual spectrum (Figure 1), where the dust and gas features may be easily identified.
Residual spectra of those RCBs with a H-deficiency in excess of a factor of about 103 (García-Hernández et al. 2011) show only a broad 6-10 m emission feature which is attributable to C-C stretching modes of amorphous carbon grains (Colangeli et al. 1995). The profile of this feature may vary slightly from RCB-to-RCB but this variation may not entirely be intrinsic to the circumstellar envelopes. Extension immediately longward of 10m is sensitive to the adopted interstellar reddening which determines the correction for the 9.7m silicate absorption feature. Figure 2 shows the average residual spectrum for the sample (9) of the least reddened (EB-V0.050.40) RCB stars (UW Cen, RT Nor, RS Tel, V CrA, V1157 Sgr, V1783 Sgr, S Aps, U Aqr, and Z Umi; García-Hernández et al. 2011).
The RCB stars DY Cen and V854 Cen display apparently similar but very different residual spectra from the majority of the RCBs (Figure 2). DY Cen and V854 Cen are the two stars in our sample that are the least H-deficient with H-deficiencies of factors of 10 for DY Cen (Teff=19500K; Jeffery & Heber 1993) and 100-1000 for V854 Cen (Teff=6750K; Asplund et al. 1998). DY Cen and V854 Cen display strong features at 6.3, 7.7, 8.6, and 11.3 m together with weaker features at 11.9 and 12.7 m, all of which may be identified with polycyclic aromatic hydrocarbons (PAHs) (e.g., Allamandola et al. 1989; Bauschlicher et al. 2008, see Table 1). The PAH features (with the exception of the strong 7.7 m band) are quite narrow (0.20.4 m) showing that they probably arise from free gas-phase PAHs, not PAHs in particles or clusters (Peeters et al. 2004). In addition, the wavelength positions of the strong 7.7 m band are 8.0 and 7.8 m for V854 Cen and DY Cen, respectively. The mean position of the 7.7 m band is correlated apparently with effective temperature of the exciting star (see Fig. 5 in Tielens 2008): the 7.8 to 8.0 m shift between the two stars is consistent with the difference in their stellar temperatures.
The intriguing result from Fig. 2 is the presence in the DY Cen residual spectrum of three features at 7.0, 17.4 and 18.8 m not readily attributable to PAHs according to wavelength and/or intensity considerations. These features, which are real as they are detected in available low- and high-resolution Spitzer spectra at all slit positions, are attributable to C60, as we show below. To establish their carrier as C60, it is necessary to discuss the anticipated spectra of the fullerene and their possible blending PAHs. Table 1 lists features seen in DY Cen and V854 Cen as well as their identification.
3 Identifications: C60 and/or PAH?
Laboratory gas-phase spectroscopy of neutral C60 molecules was reported by Frum et al. (1991) and Nemes et al. (1994). Infrared C60 features are expected at 7.0, 8.4, 17.4 and 18.8 m at a temperature of 0 K while these wavelengths are predicted to shift longward a maximum of 0.2 m at a temperature of 1083 K (Nemes et al. 1994). There are apparently no reliable estimates of the relative strengths of the four bands in the gas phase. Cami et al. (2010) estimated Einstein A-values from published band absorption strengths for C60 in rare gas matrices: these values according to our calculations are A(s-1) (1.9, 1.1, 4.2, 5.2) for the bands (18.8, 17.4, 8.4, 7.0). Intensities of circumstellar features will depend also on the level populations and radiative transfer effects.
There is a plethora of astronomical, laboratory, and theoretical data on the PAHs. Our primary argument applicable to DY Cen is that three of the four C60 features are not blended beyond recognition with PAH features and that a reasonable case may be made that the fourth feature at 8.4 m is a blend of the C60 transition and the 8.6 m PAH feature.
In terms of upper state excitation energy, the C60 bands are ordered by decreasing wavelength and it is in this order that we discuss their presence in DY Cen. The two longest wavelength C60 features match emission features in DY Cen at 17.40 m and 18.98 m in good agreement with laboratory measurements at about 1000K and with their extrapolation to 0K; one expects the temperature of the C60 molecules to be within these limits. The line widths (dominated by the instrumental width) are consistent with the laboratory measurements, 0.31 and 0.36 m (observed) versus 0.40 m (laboratory).
In DY Cen’s spectrum there are no other features between 15 and 30 m but V854 Cen shows the 17.4 m feature not only stronger than its 18.8 m counterpart but shifted to shorter wavelengths (17.33 m) and accompanied by emission extending to about 15 m. These additional features are presumed to be PAH features known to fall in the 13 to 19 m interval (Boersma et al. 2010). Except for a 16.4 m feature, the intensities of these PAH contributions are uncorrelated with the stronger PAH features in the 5 to 13 m interval. Additionally, the relative intensities of features in the 13 to 19 m region may vary from object to object. Often, the 16.4 m feature is the strongest in this window with an intensity correlated with that of the 11.2 m PAH. With a slight extrapolation of Boersma et al’s Fig. 6 showing a correlation between the intensity ratio of 6.2/11.2m and 16.4/11.2m PAH features, the 16.4m feature is predicted to have an intensity 2% that of DY Cen’s 11.2m feature, an expectation consistent with the feature’s absence (Fig. 2) and, since other PAH features in this interval are expected to be weaker, it is not surprising that the C60 longest wavelength transitions appear uncontaminated by PAH blends. For V854 Cen, the 6.2/11.2m intensity ratio (Figure 2) is higher than for DY Cen and predicts an intensity of about 5% for the 16.4m PAH, a value approximately consistent with the presence of the 16.4m and other weak PAH features in Fig. 2. With a correction for weak 15.8, 16.4, and 17.0 m PAH contaminants, a C60 feature at about 17.4 m is obtained that is consistent with that of the 18.8 m feature.
Interestingly, DY Cen shows a unique spectrum across the 15 to 20 m interval among spectra exhibiting PAH features. Other features at 15.8, and 16.4 m are not seen, as they are, for example, in reflection nebulae such as NGC 7023 (Sellgren et al. 2007, 2010; Boersma et al. 2010). Several PAHs from the Ames spectral database show features near 17.4 and 19 m but they are always accompanied by other stronger features (e.g., at 16.4 m: Bauschlicher et al. 2008) but these features are absent from DY Cen’s spectrum. Some may be present in V854 Cen’s spectrum. Sellgren et al. (2010) show that the 17.4 m feature has two components: one that correlates with the 18.9 m C60 feature and another one correlating with the 16.4 m PAH feature. The absence of the 16.4 m PAH feature from the DY Cen spectrum indicates that the 17.4 m feature is dominated by C60 emission. However, in the case of V854 Cen since both 16.4 and 18.9 m features are seen, the 17.4 m feature is due to a combination of C60 and PAH emission.
The 7.0 and 8.4 m C60 transitions are in the interval spanned by common PAH features at 6.2, 7.7, and 8.5 m. Of particular concern is the blending of the 8.4m C60 and 8.5m PAH features where the PAH’s contribution can be assessed only by comparison of relative strengths of this and adjacent PAH features, an uncertain exercise owing to considerable source-to-source variation in relative strengths.
The 7.0m C60 line is partially resolved in the DY Cen spectrum with a measured wavelength of 7.0 m in good agreement with the laboratory spectroscopic value of 7.11 m for a temperature of about 1000K. An estimate of the feature’s width requires a correction for the overlapping wing of the strong 7.7m PAH feature: a rough upper limit for the FWHM of the C60 line is 0.16 m, a value consistent with the laboratory measurement of 0.06 m. In addition, we estimate an intensity ratio 7.0/18.9 of 0.7, which - according to Sellgren et al. (2010) - corresponds to excitation of C60 molecules by photons with energies slightly less than 10 eV, in agreement with the effective temperature of DY Cen. The 8.4m C60 line is blended with the 8.5m PAH. There seems to be no way in which to make a firm estimate of the PAH’s contribution to the feature seen in DY Cen’s spectrum. Cerrigone et al. (2009) provide intensities for the principal PAH features for both C-rich and O-rich post-AGB stars. Relative to the 11.2m PAH, the mean intensity of the 8.5m PAH is 0.40 for the four C-rich stars (range 0.19 to 0.91), and 0.38 for the entire sample of 13 stars (range 0.04 to 0.91). At the relative intensity of 0.4, the 8.5m PAH is expected to have an intensity close to the observed value. However, with respect to the 6.2m PAH, the mean intensity of the 8.5m feature is 0.33 for the four C-rich stars (range 0.23 to 0.5) and 0.19 for the entire sample (range 0.05 to 0.5). With these mean intensities, the predicted intensity of the 8.5m PAH is less than the observed value in the DY Cen spectrum. Different average relative intensities among PAH features very likely reflect the different origins of the features (Table 1). Sellgren et al.’s (2010) calculations indicate that the 7.0 and 8.4 m C60 features should be roughly similar in intensity. The predicted intensity of the 8.5m PAH from the 11.2m PAH would satisfy this expectation but the prediction from the 6.2m PAH would not. However, the considerable star-to-star variation in relative intensities of these PAHs rules out making a reliable separation of C60 and PAH contributions.
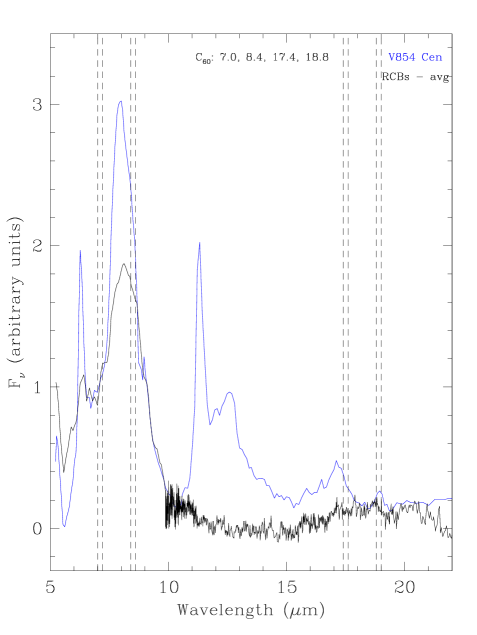
Inspection of V854 Cen’s spectrum in Fig.2 reveals some differences with DY Cen’s spectrum in the 6 to 10 m interval. In particular, the strong 7.7m PAH shows obvious blending to longer wavelengths - this feature is broader in V854 Cen than in DY Cen. This may result from intrusion by an additional PAH but another possibility is that V854 Cen includes a contribution from the broad feature seen in the more H-deficient RCBs. In Fig.3, we show the V854 Cen spectrum and the RCB feature scaled to provide an approximate possible fit. The profile of the RCB feature seems to include some contributions at 7 and 8.5m. In contrast to V854 Cen, the DY Cen spectrum does not appear to be contaminated by the RCB feature and additional contributions at 7.0 and 8.5 m are required which are most probably attributable to C60.
4 Discussion
The original laboratory studies on the formation of fullerenes showed that fullerenes are clearly favored in environments which are H-deficient (Kroto et al. 1985; Kratschmer et al. 1990) and that H-poor conditions are a prerequisite for efficient fullerene formation (de Vries et al 1993). Thus, in the circumstellar envelopes of cool evolved stars having a normal H abundance (e.g., C-rich Asymptotic Giant Branch stars) and in dense interstellar clouds, acetylene (C2H2) and its radical derivatives are believed to be the precursors of complex C-based molecules such as PAHs, and fullerenes are probably not formed (e.g., Cherchneff & Cau 1999). However, in hydrogen-poor but C-rich environments, fullerene molecules may be formed from the coalescence of large monocyclic rings in the gas phase and PAHs are likely not formed as possible intermediates (e.g., Cherchneff et al. 2000). Furthermore, more recent laboratory studies show that at low temperatures ( 1700 K) soot formation proceeds through or involves the formation of PAH intermediaries while fullerenes are involved at temperatures in excess of 3500 K (Jäger et al. 2009). This shows that the high temperatures rather than the H-poor conditions may also be a defining factor for efficient fullerene formation. Given the ease with which fullerenes are formed in a carbon and helium rich atmosphere in laboratory experiments, it is puzzling that fullerenes do not seem to form in great abundance in the carbon and helium rich environments of the very H-poor RCB stars, but, in fact, fullerenes are detected only around stars containing some hydrogen (this study and García-Hernández et al. 2010). Evidently, fullerenes formation is inefficient in the highly H-deficient RCB stars; fullerene destruction is expected to occur at a slow rate.
Our detection of C60 around DY Cen and possibly also around V854 Cen occurs in conjunction with the presence of PAHs. As we have mentioned above, high temperature condensation (even in H-rich environments) will lead to efficient formation of fullerenes (Jäger et al. 2009) and this may be relevant for these RCB stars since the gas in which molecules and dust form will be much hotter than in red giant star environments. However, laboratory of high temperature condensates have shown that no PAHs are formed as intermediates (Jäger et al. 2009). An alternative explanation for the simultaneous presence of PAH and C60 molecules is that they may be formed by the decomposition of hydrogenated amorphous carbon (HAC) (Scott et al. 1997a). Laser vaporization of HAC films produces a wide range of large aromatic carbon molecules including PAHs and fullerenes such as C60 (Scott et al. 1997a). Indeed, the C60 molecules do not dominate the mass distribution of molecules seen in laboratory experiments (Scott et al. 1997a), an observation qualitatively consistent with the infrared spectra of DY Cen and V854 Cen. The UV radiation field around these two RCB stars is unlikely intense enough to cause HAC destruction. However, high velocity strong winds are typical in RCB stars and the collisional environment (i.e., grain-grain collisions) of these stars may lead to HAC vaporization.
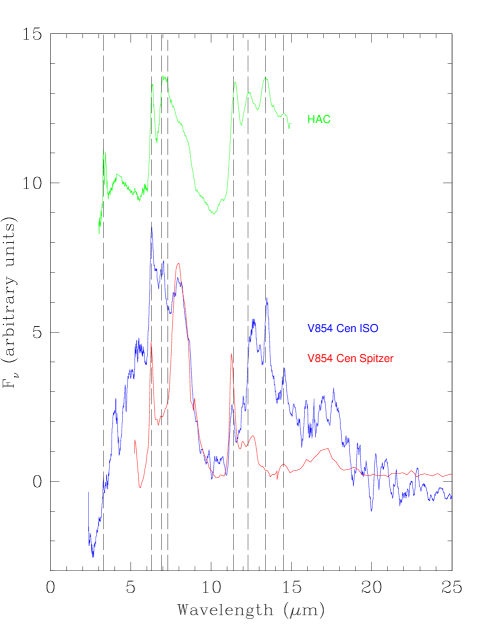
Interestingly, the Infrared Space Observatory’s 1996 spectrum of V854 Cen showed a correspondence with the laboratory emission spectrum of HAC at 773 K (see Lambert et al. 2001). These HAC features are weaker, even absent, from our Spitzer spectrum and the C60 and PAH features present in V854 Cen’s Spitzer spectrum are weaker or absent in the ISO spectrum (see Fig. 4). Although the absolute flux level is different for both spectra, the dust continuum emission seems to be unchanged and it can be well fitted by a blackbody at a temperature of 1000 K. Figure 4 displays the ISO and Spitzer spectra of V854 Cen after the subtraction of the dust continuum emission at 1000 K. This contrast between ISO and Spitzer spectra necessarily prompts the speculation that the principal ingredient in the circumstellar envelope evolved from HAC grains to molecules such as the PAHs and C60111Note that V854 Cen underwent minima between the time of the ISO and Spitzer spectra and thus the HACs seen with ISO were not - in all probability - the HACs that led to the fullerenes and PAHs in the Spitzer spectrum.. If so, formation of molecules such as PAHs and fullerenes in the circumstellar envelopes of the more H-rich RCB stars is a time-dependent phenomenon. A certain concentration of hydrogen is presumably needed to form HAC grains, which may be then destroyed by shocks in the circumstellar envelope. One product of destruction of HAC grains may be C60 molecules which being hardy may survive for longer periods of time than the HAC grains and PAHs. In RCBs with a recurring series of dust-forming events with replenishment of HACs and additional formation of C60 is a possibility. If these speculations have merit, one may expect to find C60 molecules unaccompanied by HACs and PAHs in environments where grain formation is a non-recurring event.
Contrary to a conclusion drawn by Cami et al. (2010), our speculations may account well for Cami et al.’s pioneering detection of C60 and C70 molecules from the inner region of the PN Tc 1. Noting that the Spitzer spectrum of Tc 1 shows no PAHs, Cami et al. drew the conclusion that the fullerenes were formed in very H-poor gas ejected a few thousand years by an AGB star following an even earlier ejection of the star’s H-rich envelope. This conclusion overlooks two key observations. First, the nebula is not H-poor (Köppen et al. 1991; Milanova & Kholtygin 2009) and, in particular, optical and ultraviolet spectroscopy of the inner regions confirm that the gas has a normal mix of H and He (Williams et al. 2008; R. Williams - private communication); the gas is not H-poor. Second, the central star CoD -46∘ 11816 is not H-poor and He-rich (Mendez 1991). In short, the fullerenes were in all probability formed in H-rich and presumably C-rich gas. Dust formation occurred in the circumstellar wind but now presumably the wind has lessened or ceased. The hot central star may have already destroyed the less hardy grains and molecules (e.g., PAHs) from times when a cool AGB star fed the then stronger wind. In this picture, hydrogen is essential to form fullerenes but the absence of PAHs is not proof that fullerene production occurs in a H-deficient region.
5 Concluding remarks
In summary, contrary to general expectation, the formation of large fullerenes, specifically C60 molecules around RCB stars takes place efficiently only in the presence of some hydrogen and HACs may be the precursors of fullerenes. However, the absence of fullerene features in highly H-deficient RCB stars is puzzling. Carbon chemistry in H-deficient environments should include the formation of fullerenes, as it has been shown by the early laboratory experiments (e.g., Kroto et al 1985; Kratschmer et al. 1990; de Vries et al. 1993). More laboratory experiments at different temperatures and hydrogen compositions are encouraged in order to learn about the formation of fullerenes. In particular, laboratory experiments in H-poor atmospheres could explore higher temperature formation routes of fullerenes. In addition, one would expect that grain-grain collisions of pure carbon grains would lead to fullerenes, and in this sense, laser vaporization experiments of amorphous carbon films could help to solve this puzzle.
References
- Allamandola et al. (1989) Allamandola, L. J., Tielens, A. G. G. M., & Barker, J. R. 1989, ApJS, 71, 733
- Asplund et al. (1998) Asplund, M., Gustafsson, B., Rao, N.K., & Lambert, D.L. 1998, A&A, 332, 651
- Bauschlicher et al. (2008) Bauschlicher, C. W., Jr., Peeters, E., & Allamandola, L. J. 2008, ApJ, 678, 316
- Boersma et al. (2010) Boersma, C. et al. 2010, A&A, 511, 32
- Cami et al. (2010) Cami, J. et al. 2010, Science, 329, 1180
- Cerrigone et al. (2009) Cerrigone, L. et al. 2009, ApJ, 703, 585
- Cherchneff & Cau (1999) Cherchneff, I., & Cau, P. 1999, in Proc. IAU Symp. 191, Asymptotic Giant Branch Stars, ed. T. Le Bertre, A. Lebre, & C. Waelkens (San Francisco, CA: ASP), p. 251
- Cherchneff et al. (2000) Cherchneff, I. et al. 2000, A&A, 357, 752
- Clayton et al. (1995) Clayton, G. C. et al. 1995, AJ, 109, 2096
- Colangeli et al. (1995) Colangeli, L. et al. 1995, A&AS, 113, 561
- De Vries et al. (1993) De Vries, M. S. et al. 1993, Geochim. Cosmochim. Acta 57, 933
- Frum et al. (1991) Frum, C. I. et al. 1991, Chem. Phys. Lett., 176, 504
- García-Hernández et al. (2010) García-Hernández, D. A. et al. 2010, ApJ, 724, L39
- García-Hernández et al. (2011) García-Hernández, D. A., Rao, N. K., & Lambert, D. L. 2011, ApJ (to be submitted)
- Goeres & Sedlmayr (1992) Goeres, A., & Sedlmayr, E. 1992, A&A, 265, 216
- Jäger et al. (2009) Jäger, C. et al. 2009, ApJ, 696, 706
- Jeffery & Heber (1973) Jeffery, C.S., & Heber, U. 1993, A&A, 270, 167
- Köppen et al. (1991) Köppen, J., Acker, A., & Stenholm, B. 1991, A&A, 248, 197
- Kratschmer et al. (1990) Kratschmer, W. et al. 1990, Nature, 347, 354
- Kroto et al. (1985) Kroto, H. W. et al. 1985, Nature, 318, 162
- Kroto (1987) Kroto, H. W. 1987, in Polycyclic Aromatic Hydrocarbons and Astrophysics, eds. Leger, A. & d’Hendecourt, L., Reidel Publishing Company, p. 197
- Lambert & Rao (1994) Lambert, D. L., & Rao, N. K. 1994, JApA, 15, 47
- Lambert et al. (2001) Lambert, D. L. et al. 2001, ApJ, 555, 925
- Mendez (1991) Mendez, R.H. 1991, in IAU Symp. 145, Evolution of Stars: the Photospheric Abundance Connection, ed. G. Michaud, & A.V. Tutukov (Dordrecht: Kluwer Academic Publishers), p. 375
- Milanova & Kholtygin (2009) Milanova, Yu.V., & Kholtygin, A.F. 2009, Astr. Lett., 35, 518
- Nemes et al. (1994) Nemes, L. et al. 1994, Chem. Phys. Lett., 218, 295
- Peeters et al. (2004) Peeters, E. et al. 2004, ApJ, 617, L65
- Sellgren et al. (2010) Sellgren, K. et al. 2010, ApJ, 722, L54
- Sellgren et al. (2007) Sellgren, K., Uchida, K. I., & Werner, M. W. 2007, ApJ, 659, 1338
- Scott et al. (1997a) Scott, A., Duley, W. W., & Pinho, G. P. 1997b, ApJ, 489, L193
- Scott et al. (1997b) Scott, A. D., Duley, W. W., & Jahani, H. R. 1997a, ApJ, 490, L175
- Tielens (2008) Tielens, A.G.G.M. 2008, ARA&A, 46, 289
- Williams et al. (2008) Williams, R. et al. 2008, ApJ, 677, 1100
| Feature | DY Cen | V854 Cen | Identification | Mode | Ref.a |
|---|---|---|---|---|---|
| 6.3 m | yes | yes | PAHs | C-C stretching | 1 |
| 7.0 m | yes | C60 | F1u(4) | 2 | |
| 7.7 m | yes | yes | PAHs | C-C stretching | 1 |
| 8.6 m | yes | C60, PAHs | F1u(3), C-H bending in-plane | 2,1 | |
| 11.3 m | yes | yes | PAHs | C-H bending out-of-plane | 1 |
| 11.9 m | yes | yes | PAHs | C-H bending duo | 1 |
| 12.7 m | yes | yes | PAHs | C-H bending trio | 1 |
| 15.8 m | no | yes | large PAHs? | C-C-C | 3 |
| 16.4 m | no | yes | large PAHs? | C-C-C | 3 |
| 17.0 m | no | yes | large PAHs? | C-C-C | 3 |
| 17.4 m | yes | yesb | C60 | F1u(2) | 2 |
| 18.8 m | yes | yes | C60 | F1u(1) | 2 |
.
References. — (1) Allamandola et al. (1989); (2) Frum et al. (1991); (3) Boersma et al. 2010.