1]SLAC National Accelerator Laboratory, Stanford, California
94309, USA 2]Seoul National University, KOREA
SLAC-PUB-14353
SNUQ2C-11001
The Charmoniumlike Mesons
Arafat Gabareen Mokhtar
mokhtar@slac.stanford.eduStephen Lars Olsen
solsen@hep1.snu.ac.kr
[
[
Abstract
A brief review of the experimental situation
concerning the electrically-charged charmoniumlike meson candidates,
, is presented.
1 Introduction
The Belle Collaboration reported peaks in the
[1] and invariant
mass distributions [2] in [3] and [4],
respectively. If these peaks are meson resonances, they would have a
minimal quark substructure of and be unmistakeably
exotic. However, even though the Belle signals have more than
5 statistical significance, the experimental situation remains
uncertain in that none of these peaks have yet been confirmed by other
experiments. An analysis by the BABAR Collaboration of
neither confirms nor contradicts the Belle
claim for the [5]. In
the BABAR analysis, decays were also studied,
and no evidence for was found.
In this paper, we review and compare Belle and BABAR results on
searches for charged charmoniumlike states. An abbreviated version of
this review is contained in Ref. [6].
2 The Belle observation
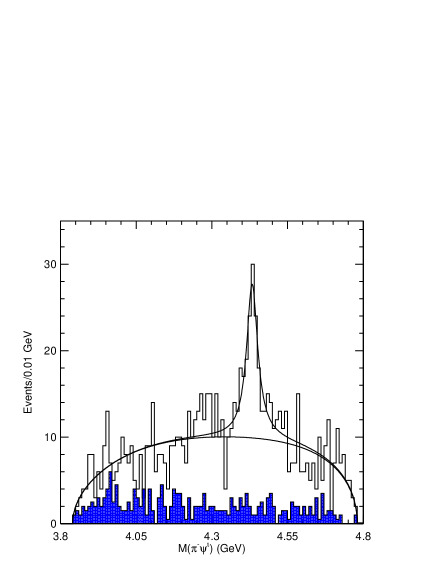
Belle’s original signal [3] is the sharp peak in
the invariant mass distribution from decays shown in
Fig. 1. The Belle analysis is based on a data
sample that is equivalent to an integrated luminosity of 605
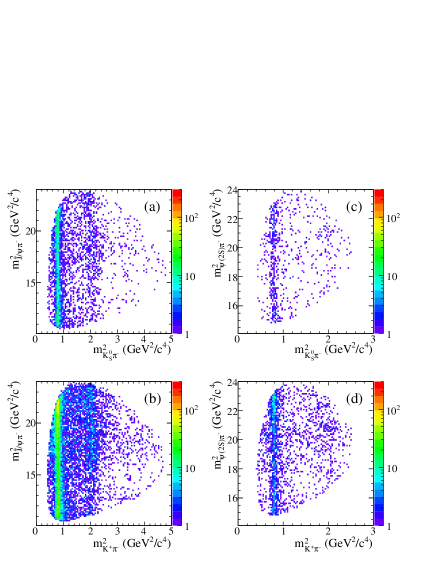
fb-1. Figure 2 shows the Dalitz plot for
candidates, where vertical bands for
and are evident and the shows up as a horizontal band of events between
and 20 GeV2/c4. (In the
invariant mass distribution of
Fig. 1, the the bands are suppressed by
cuts on the masses [3]).
A binned maximum-likelihood fit to the mass distribution
using a Breit Wigner (BW) resonance function for the signal and a
polynomial background gives a mass of and
total width of , with
estimated statistical significance of more than . Consistent
signals are seen in various subsets of the data: i.e. for both
the (, or ) and
()
subsamples [3].
Figure 1: From Belle [3], the invariant mass
distribution for decays after applying a
veto on the and . The open histogram shows the data,
and the shaded histogram represents the scaled results from the
background. The solid curves are the fit results.Figure 2: From Belle [3], the (horizontal)
vs. (vertical) Dalitz plot
distribution for candidate events.
3 A reflection from dynamics?
Identifying resonant structures in the channel in
three-body decays has to be done with care
because of the possibility that dynamics in the channel can
cause mass structures in the invariant mass distribution
that have no relation to dynamics. Energy-momentum
conservation imposes a tight correlation between the decay angle
() in the system [7] and the
invariant mass, and this results in
being very nearly proportional to
. Consequently, interference between different
partial waves in the system can produce peaks in
that are purely “reflections” of structures
in and have nothing to do with dynamics. However, in the kinematically allowed mass range for
decay, only -, - and -waves
are significant, and this limited set of partial waves
can only produce fake mass peaks at a discrete set of mass
values.
In the case of the , the peak mass corresponds to
, and it is not possible to produce a
peak near this value with any combination of
interfering 0, 1, and 2 partial waves without introducing
additional, larger structures at other values.
This is illustrated in Fig. 3, where the
histogram shows the distribution of values for a
MC sample of , events where the
mass and width closely correspond to Belle’s reported
values [3]. The curves in the figure show the results
of trying to make a peak at the same location with interfering -,
- and -partial waves in the channel. (Here both
longitudinally and transversely polarized ’s are
considered, and no attempt is made to restrict the strength of each
term to that seen for the -, - and -wave components in
the data.) These curves show that although a peak can be made at
, it is necessarily accompanied by
large enhancements near . No such
structures are evident in the mass plot of
Fig. 1.
Figure 3: From Ref. [8], the histogram shows the
distribution for a MC-generated resonance with and . The curves
show the results of attempts to produce a peak in the vicinity of the
data with interfering -, - and -waves in the channel.
4 The BABAR search for the
BABAR searched [5] for the in the decay modes
, where or and
or . The search was performed using the full BABAR data set equivalent to integrated luminosity of 413 fb-1
(455 candidates) collected at a center-of-mass
energy of 10.58 . The BABAR search covered two additional
decay modes () that were not considered in
the Belle study. The modes contain about six times (see Table
II in Ref. [5]) more data than those with the
and provide a powerful, high statistics tool for
understanding the background. The Dalitz plots for the four decay
modes are shown in Fig. 4. The mass
distribution shows a clear signal in all decay modes, and a
visible signal in the modes with a but less
significant in the modes with . Since the system
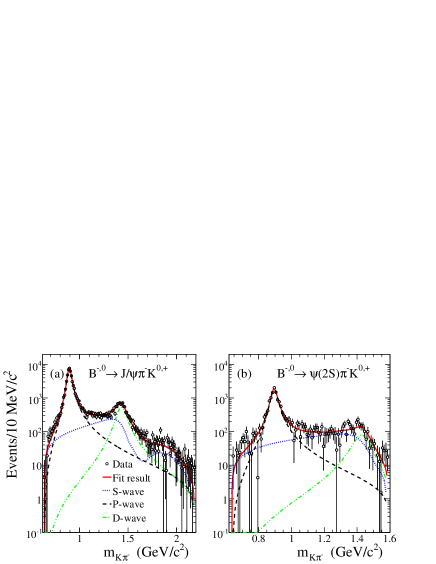
dominates the Dalitz plot, the BABAR Collaboration studied the mass distribution and the angular dependence. Similar contributions
from the different wave intensities are obtained in the modes with
and (see Table III in Ref. [5]) and,
therefore, the modes with and are combined. The mass distributions are fitted with the -, -, and -wave
intensities as shown in Fig. 5. Good fits to the
data are obtained. The study of the angular dependence shows a clear
asymmetry in , where is the angle between the
Kaon and meson in the rest frame (see Figs. 12 and 13 in
Ref. [5]).
Figure 4: From BABAR [5], the
versus Dalitz plots for the final samples in the decay
modes (a) , (b) , (c)
, and (d) .Figure 5: From BABAR [5], the fit results to the
mass distributions for the combined charge configurations
(a) and (b)
. The open dots show the
data, and each curve represents different fit contribution, as
indicated.
The BABAR mass resolution at the mass is for the
modes with () (see Fig. 6 in
Ref. [5]). Each event is efficiency corrected, and the
conclusions are based on distributions obtained after background
subtraction. The average efficiency varies slightly as a function of
the mass but can differ significantly between the different
decay modes (see Fig. 7 in Ref. [5]), however
there are significant variations in efficiency with for
certain regions of mass (see Fig. 36 in
Ref. [5]).
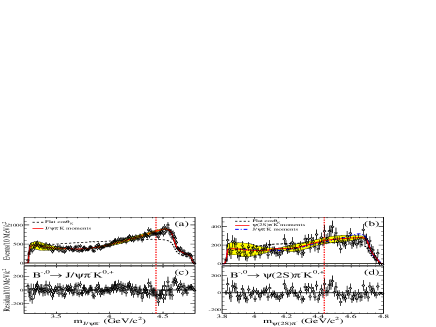
The comparison between the mass distribution and the relevant
reflection was performed (see section 9 in
Ref. [5]). This comparison is essential to investigate
the need for a signal above the reflection. Following the
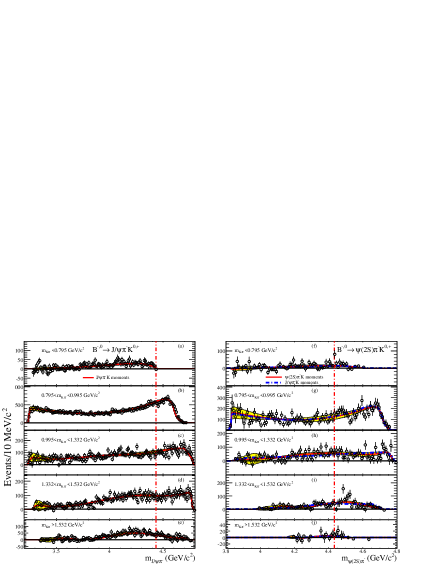
five regions (see section 10.D in Ref. [5])
defined in the Belle analysis [3], the projection is
implemented in each interval as shown in
Fig. 6. In each figure, a comparison (not a fit)
between the data and the reflection is shown. Note that only one
normalization factor for the regions is used for each
mode. The reflections onto the mass distributions
describe well the data, with a small statistical fluctuation at
. The mass distribution and the
overall projection are shown in Fig. 7. No
significant evidence for has been obtained. The projection
onto the mass distribution is used as a non-peaking
background. With such a background shape and a BW function for a signal, a signal is obtained for the overall region, but with
shifted mass value. A similar small signal is obtained in the and combined regions. A peak is obtained when
the and regions are vetoed. No (or a negative) signal
for was found.
Figure 6: From BABAR [5], the mass
distributions in different regions of mass for (a-e)
, and (f-j)
; the open dots represent
the data, and the solid curves and shaded bands are due to the reflections in the different mass intervals, using the same
overall normalization constant. In (f-j), the dot-dashed curves are
obtained using normalized moments for , instead of those from ; the vertical lines indicate
.Figure 7: From BABAR [5], the mass
distributions for the combined decay modes (a) and (b) . The points show the data (integrated over all
regions) after efficiency correction and background subtraction. The
dashed curves show the reflection for a flat distribution, while the solid curves show the result of when
accounting for the angular dependence (see Sec. 9 in
Ref. [5]). The shaded bands represent the effect of
statistical uncertainty on the normalized moments. In (b), the
dot-dashed curve indicates the effect of weighting with the normalized
moments. The dashed vertical lines indicate the value
of . In (c) and (d), we show the
residuals (data-solid curve) for (a) and (b), respectively.
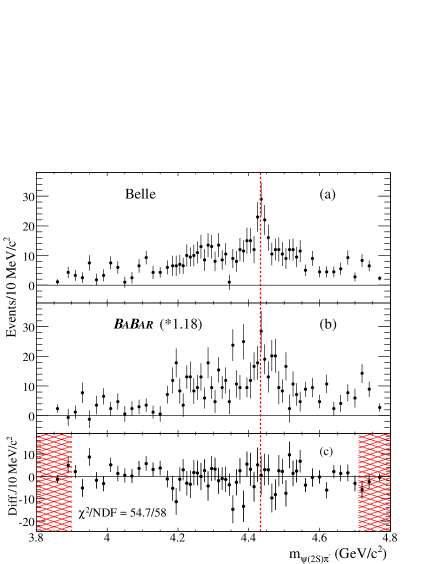
Although the Belle Collaboration used a data sample equivalent to 1.46
times that of BABAR’s, because of different selection criteria
BABAR has more events per fb-1. A direct comparison between the
two distributions is shown in Fig. 8. For
comparison purposes, the BABAR distribution is not corrected for
efficiency, however both Belle and BABAR distributions are
background subtracted and shown in Fig. 8(a) and
Fig. 8(b), respectively. The BABAR distribution is
scaled up by the factor 1.18 in order to normalize to the Belle data
between the crosshatched regions of Fig. 8(c). The
difference plot is shown in Fig. 8(c) where errors have
been combined in quadrature; here , which
indicates that the two samples are statistically equivalent.
Figure 8: From BABAR [5], (a) The Belle distribution after background subtraction; (b) the equivalent BABAR distribution obtained after scaling due to different
luminosities. (c) The difference between the distributions. The crosshatched area represents the exclusion region
for the normalization procedure. The vertical-dashed line indicates
.
5 Belle’s Dalitz analysis of
After the BABAR Collaboration did not confirm the
mass peak in their analysis
of decays [5], the Belle
Collaboration performed a reanalysis [9] of
their data that took detailed account of possible reflections from the
channel. Specifically, they modeled the process as the sum of two-body decays , where denotes all of the known
resonances that are kinematically accessible, and
both with and without a component. The results of
this analysis, confirm the basic conclusions of Belle’s initial
publication [3].
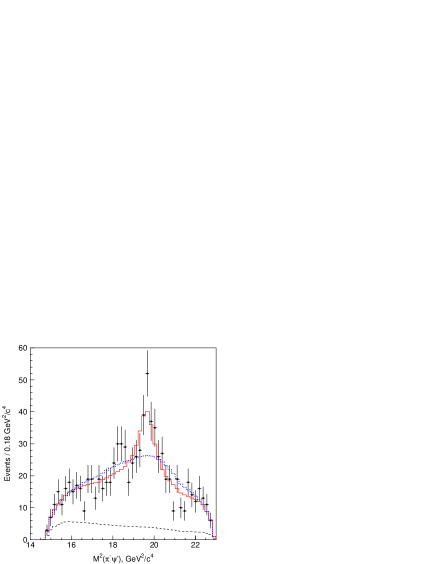
Figure 9 shows the mass distribution in
different intervals as obtained from the Dalitz-plot analysis by
the Belle Collaboration [9]. In the region
between the and the ( ,
Fig. 9(c)), a peak is present. The data points
in Fig. 10 show
Dalitz plot projections with the prominent
bands removed (as in Fig. 1) compared
with the results of the fit with no resonance, shown as a dashed
histogram, and that with a resonance, shown as the solid
histogram. The fit with the is favored over the fit with no by
. The fitted mass, ,
agrees within the systematic errors with the earlier Belle result; the
fitted width, , is larger,
but also within the analysis’ systematic errors of the previous
result. In the default fit, the resonance was assumed to have zero
spin. Variations of the fit that included a assignment for the
as well as models that included additional, hypothetical resonances with floating masses and widths, and radically
different parameterizations of the -wave amplitude do not
change the conclusions. The product branching fraction from the Dalitz
fit:
is not in strong contradiction with the BABAR 95 C.L. upper
limit of [5].
Figure 9: From Belle [9],
projections for bands: (a)
below the ; (b) at the ; (c) between the and
the ; (d) at the ; and (e) above the
. The dots show the data, the solid (dotted)
histograms are the results for the model with (without) a single
state, and the dashed histograms are the
background contaminations.Figure 10: From Belle [9], the
projection of the Dalitz plot with the
bands removed is shown as data points. The histograms show
the corresponding projections of the fits with and without a
resonance term.
6 Belle’s two peaks in the channel
In addition to the , Belle has presented results of an analysis of
decays that require two resonant states in the
channel [4]. The vs. Dalitz plot, shown in
Fig. 11, shows vertical bands of events
corresponding to and , plus a
broad horizontal band near
GeV, indicating a possible resonance in the
channel. In this case, this horizontal band
corresponds to , a location where
interference between partial waves in the channel can produce a
peak and, thus, a detailed Dalitz analysis is essential.
Figure 11: From Belle [4], the
(horizontal) vs. (vertical) Dalitz plot
distribution for candidate events.
For , the kinematically allowed mass range for
the system extends beyond the -wave
resonance and -, -, - and -wave terms for the system
are included in the model. The fit with a single resonance in the
channel is favored over a fit with only
resonances and no by more than . Moreover, a
fit with two resonances in the channel is favored
over the fit with only one resonance by . The fitted
masses and widths of these two resonances are: and and and . Here also, variations of the fit
that use a assignment for the states and models that include
additional, hypothetical resonances with floating
masses and widths, and different parameterizations of the -wave amplitude do not change the conclusions.
The product branching fractions for
have central values similar to that for the but with large errors.
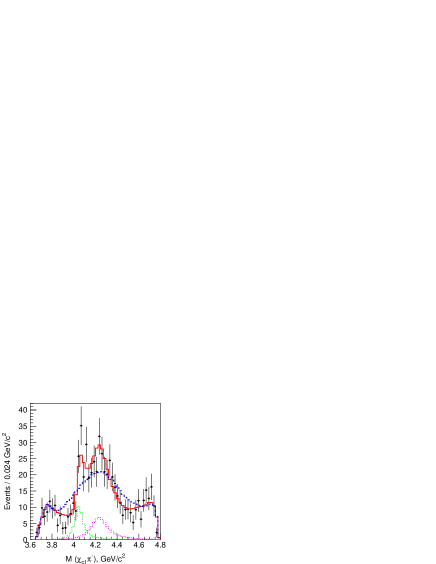
Figure 12 shows the
projection of the Dalitz plot with the bands excluded and the
results of the fit with no resonances and with
two resonances.
Figure 12: From Belle [4], the data points show the
projection of the Dalitz plot with the
bands removed. The histograms show the corresponding projections of
the fits with and without the two resonance
terms.
7 Summary
If the peaks reported by Belle in the and
channels are in fact meson resonances, they would be
“smoking guns” for exotics. It is therefore important that the Belle
results are confirmed (or refuted) by other experiments. Both the
BABAR and Belle analyses could benefit from additional
statistics. However, both experiments have completed data taking and
the BABAR analysis used their complete dataset while the Belle
analysis used about 75 of their final total data sample.
Approximately 3 ab-1 of integrated luminosity would be necessary
to bring the sample to the statistical level of BABAR’s
current sample, and this amount of data will not be available
until the operation of one of the Super- factories, which will not
happen for at least a few years. In the meantime, it would be valuable
if BABAR performed a search for the and
in the channel and Belle reproduced BABAR’s study
of the channel using the existing data sets. The D0 and
CDF experiments at the Tevatron have data on hand that could be used
to carry out searches for inclusive production of the and we hope
that results will be available from them in the near future.
8 Acknowledgment
The work of Arafat Gabareen Mokhtar is supported by the US Department
of Energy, Division of High Energy Physics, Contract
DE-AC02-76-SF00515. The work of Stephen Lars Olsen is supported by
the WCU program of the Korean Ministry of Education, Science and
Technology (grant number R32-2008-000-10155-0).
References
[1] The notations and are
used for the same charmonium state of .
[2] The inclusion of charge-conjugate modes is always
implied. Also, when two errors are presented, the first one is always
statistical and the second systematic.