Possible Coexistence of Superconductivity and Magnetism in Intermetallic NiBi3
Abstract
NiBi3 polycrystals were synthesized via a solid state method. X-ray diffraction analysis shows that the main phase present in the sample corresponds to NiBi3 in a weight fraction of 96.82 according to the refinement of the crystalline structure. SEM - EDS and XPS analysis reveal a homogeneous composition of NiBi3, without Ni traces. The powder superconducting samples were studied by performing magnetic measurements. The superconducting transition temperature and critical magnetic fields were determinated as TC = 4.05 K, HC1 = 110 Oe and HC2 = 3,620 Oe. The superconducting parameters were = 301.5 , = 1549 , and = 5.136. Isothermal measurements below the transition temperature show an anomalous behavior. Above the superconducting transition the compound presents ferromagnetic characteristics up to 750 K, well above the Ni Curie temperature.
pacs:
Intermetallic Alloys; Superconductivity; Ferromagnetism;I Introduction
The coexistence of superconductivity and magnetism is a phenomena of great interest in the scientific community. In 1957, Ginzburg ginzburg considered that the coexistence could exist if the critical field were longer that the induction created by the magnetization. Two years before the antagonic nature of superconductivity and magnetism was confirmed when Matthias’ experiments mattias superc showed that the superconductivity in lanthanum was destroyed by a small concentration of magnetic impurities. This was explained as in conventional s-wave superconductors, local magnetic moments break up spin singlet cooper pairs and hence strongly suppress superconductivity, an effect known as magnetic pair-breaking. Because of the pair-breaking effect, in most superconductors the presence of only a 1% level of magnetic impurity can result in the almost complete destruction of the superconducting behavior.
The discovery of rare earth ternary and actinide compounds was the first opportunity to study the interaction between the magnetic moments of f-electrons and superconducting electrons in a very high density of local moments kakani ; Sinha ; Khan . These compounds presented new exotic phenomena associated with the long-range order of local magnetic moments, such as reentrant superconductivity ishikawa , coexistence of superconductivity and ferro-antiferromagnetism hamakar , magnetic field inducing superconductivity maple and heavy fermion superconductivity steglich .
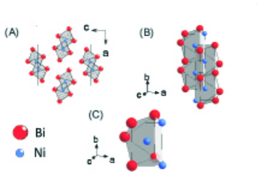
NiBi3 is an intermetallic alloy with orthorrombic structure, CaLiSi2-type and space group Pnma Vassilev ; Park . In this structure, bismuth atoms form an octahedral array, while nickel atoms form part of linear chains. NiBi3 is a superconducting material with a critical temperature about 4.05 K alek , and is the object of study of this research.
Some initial studies has been done on the superconducting properties of NiBi3. For instances Fujimori, et al. fujimori have presented a study related to the superconducting and normal properties; they studied the resistivity, heat capacity, upper critical magnetic field, in polycrystals and needle like single crystals.
Among the electronic characteristics of this intermetallic alloy is that it presents a large phonon resistivity due to predominant coupling of electrons by bismuth vibrations via the Ni vibrations. In this study we are mainly concerned with the magnetic-superconducting interacting effects, as we will discussed in the rest of the paper.
II Experimental Details
Several samples were studied. The preparation method for the most pure obtained sample was the following: the NiBi3 composition was prepared by solid state method using Bi pieces (Aldrich 99.999 %) and Ni powder (Strem Chemicals 99.9 %) in evacuated quartz tubes. The samples were melted in a resistance furnace at C for seven days. The characterization was made by X-ray powder diffraction (XRD) (Bruker AXS D8 Advance) using Cu K radiation, scanning electron microscopy (SEM - EDS) (Leica-Cambridge), and X -ray photoelectron spectroscopy (XPS) (Microtech Multilab ESCA2000) using Al K radiation 1453.6 eV. The XPS spectra was obtained in the constant pass energy mode (CAE) E0 = 50 and 20 eV for survey and high resolution respectively. The sample was etched for 20 minutes with Ar+ at 3.5 kV during 20 minutes at 0.12 A mm-2. The peak binding energy (BE) positions were referenced to Au 4f7/2 at 84.00 eV and Ag 3d5/2 at 367.30 eV having a FWHM of 1.02 eV. Magnetization measurements and determination of the superconducting properties were performed using a Quantum Design (QD) superconducting quantum interference device (SQUID) MPMS system. We determined the transition temperature with magnetization versus temperature M(T) measurements with a small magnetic field about 10 Oe. Two normal distinct measuring modes were used, zero field cooling (ZFC) and field cooling (FC). Critical magnetic fields were determined by performing isothermal measurements M(H) at different temperatures, from 2 to 4K. We also performed isothermal measurements at different magnetic intensities at higher temperatures to observe possible magnetic behavior above the transition temperature and at much higher temperatures. In order to determine the Curie temperature and to discard the possibility of Ni as an impurity in the compound, we performed studies to observe in the isothermal curves, M-H, the existance of hysteresis, thus the coercitive field at different temperatures, and well above the Ni and NiBi Curie temperatures using a Quatum Design oven installed in the MPMS.
III Results and Discussion
III.1 Structural characterization
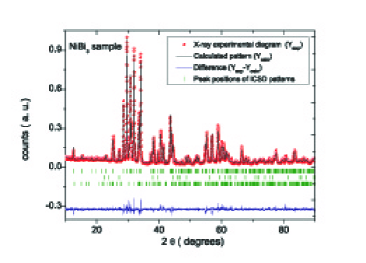
The structural characterization determined by powder XRD and Rietveld refinement are shown in Fig. 1. The polycristalline phases were identified by comparison with X-ray patterns in the Inorganic Crystal Structure Database (ICSD) 2010. All the peaks correspond to the NiBi3 phase (ICSD 58821), except the weak peaks related to impurities of Bi (ICSD 64703) and NiBi (ICSD 107493), in a proportion less than 1 and 2 % respectively. According to the results of the refinement, no Ni impurities were detected.
Refinement of the crystalline structure was performed using a Rietveld Fullprof program. Table 1 contains the NiBi3 structural parameters, corresponding to orthorhombic space group Pnma (62). In figure 2 is shown the crystalline structure.
| Rp(%) | Rwp(%) | Re(%) | young | |
| 14.0 | 15.3 | 11.1 | 1.886 | |
| Parameters () | a = 8.879(1) | b = 4.0998(7) | c = 11.483(2) | |
| Volume () | 417.7(2) | |||
| site | x | y | z | |
| Bi 1 | 0.298(3) | 0.25 | 0.890(2) | |
| Bi 2 | 0.382(4) | 0.25 | 0.594(2) | |
| Bi 3 | 0.409(3) | 0.25 | 0.180(2) | |
| Ni 1 | 0.09(1) | 0.25 | 0.520(6) |
Yoshida et al.Yoshida reported magnetic properties of NiBi. Unlike their samples with important amounts of nickel impurities, our NiBi3 samples are completely free of nickel, according to the X- ray diffraction analysis, refinement, and XPS studies as we will show below.
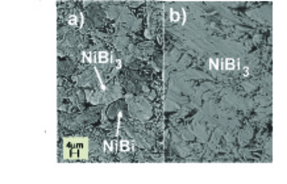
Figure 3 shows SEM - EDS images of NiBi3. A comparison between two of our samples (, ) with different reaction times; with three and seven days at C are presented, respectively. Sample shows the presence of two phases, NiBi and NiBi3, differentiated by the color and borders clearly defined. Sample shows a homogeneous composition of NiBi3. Impurities of NiBi and Bi were not detected by EDS.
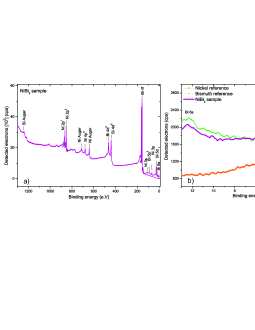
In order to discard nickel impurities, XPS analysis was performed in our samples. Figure 4a shows the survey spectra for NiBi3. It was observed that all peaks correspond to Ni and Bi, any trace of other elements were found. Figure 4b shows the XPS spectra at low binding energies for the NiBi3 sample and its comparison with bismuth and nickel metal references. The analysis of the sample in the valence region shows that the peak of nickel spectrum displays a increasing width and movement to higher energies with respect to nickel metal. This effect is attributed to changes in the environment of the nickel atoms when forming part of the alloy, confirming that nickel atoms are part of the NiBi3 compound and not as an impurity.
III.2 Superconductivity
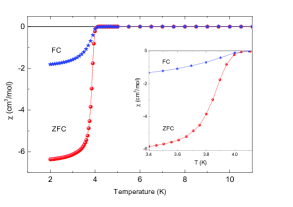
Magnetization measurements M(T) performed in ZFC and FC modes were performed in order to determine the amount of superconducting fraction. The Meissner fraction of NiBi3 sample was determined to be about 54.1% and was calculated a 2 K related to the maximum value , where is the density of the material equal to 10.884 g/cm3, is the magnetization in emu, is the mass in g, and is the applied magnetic field porc . The superconducting transition temperature TC was 4.05 K and is defined as the point in which there is a drop in the susceptibility in the FC measurement. These results are shown in the Fig. 5.
III.3 Magnetic measurements.
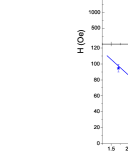
Magnetization measurements as a function of applied magnetic field M(H), were used to calculate the superconducting parameters. The critical magnetic fields H and H were calculated from the experimental data and a linear fit using the expression H near TC, where corresponds to the slope of the linear fit parametros . Figure 6 shows the critical magnetic fields.
The Ginzburg-Landau (GL) parameters; coherence length , penetration length , , and the thermodynamical critical field H, were estimated with the equations: =, =2, =, and = where is the quantum flux. Also we may use . The superconducting parameters are presented in table II and are similar to the obtained by Fujimori, et al. fujimori .
| Property | Value | ||||
|---|---|---|---|---|---|
| TC | 4.05 | 0.1 | K | ||
| 40 | 3 | Oe/K | |||
| 1290 | 80 | Oe/K | |||
| H | 110 | 8 | Oe | ||
| H | 3620 | 300 | Oe | ||
| 302 | 10 | ||||
| 1549 | 100 | ||||
| 5.1 | 0.2 | ||||
| H | 490 | 30 | Oe | ||
III.4 Magnetic measurements below and above TC
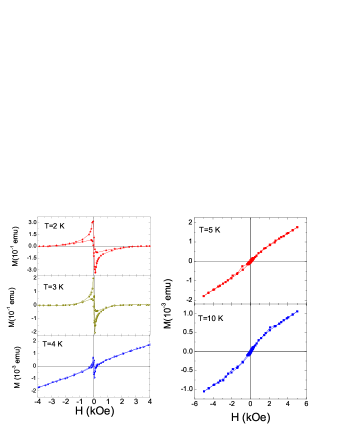
As was mentioned before different magnetic measurements were performed to have a better insight about the electronic properties of this alloy. Below the transition temperature M(H) measurements were used to determinate the critical fields in the usual manner; thus fitting a straight line to the M(H) curve at different temperatures. Below TC at the temperatures of 2, 3, and 4 K, Fig. 7 displays the competition between the diamagnetic characteristic of the superconducting state and the ferromagnetism of the compound. At low field M(H) curves looks normal, so HC1 can be determined. However as soon as the maximum diamagnetism is reached, a fast decrease of the diamagnetic contribution, is observed. This decreasing characteristic changes more rapidly that in normal superconductors (where the magnetism is absent). This anomalous behavior is the indication of two competing proceses: superconductivity and ferromagnetism. At high temperature above the transition temperature, where the diamagnetic characteristic disappears, M(H) shows a typically ferromagnetic characteristic; thus a tendency to saturation of the magnetization at high fields and a coercive field, hC, at the central part of the curve.
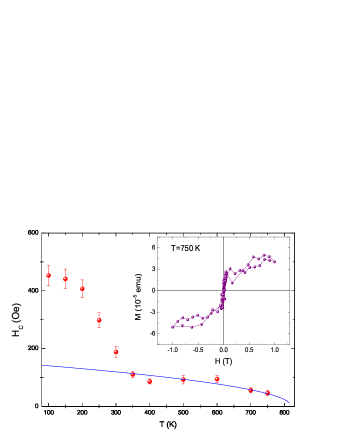
M(H) mesurements were performed in order to determinate the coercive field hC. We used a medium field model above the superconducting temperature given by: (T) = hC(0)[1-(T/C)1/2], in this equation C is the Curie temperature. In Fig. 8 we present the variations of hC up to 750 K. The fitting line is the result of the above equation for hC. At this high temperature we observed in the inset the M(H) data obtained at 750 K. This last measurement is above the Curie temperature of Ni 355 ( or 627 K kittel ). The measurement performed at 750 K clearly indicates that NiBi3 is the only magnetic contributing material. In the Yoshida’s studies they observed that NiBi is magnetic at a maximum about 640 K. Our measurements show that at 750 K the coercive field is small and about 70 Oe.
IV Conclusions
We found that NiBi3 is a type II superconducting material in which ferromagnetism and superconductivity coexist and presents an interesting interplay. This is the first time that such coexistance is demonstrated in a clear experimental manner. The ferromagnetic transition is persistent at very high temperature about 750 K, well above the Curie temperature of Ni metal and NiBi compound.
Acknowledgements.
We thank F. Silvar for Helium provisions, Lazaro Huerta for the XPS measurements, Francisco M. Ascencio for his collaboration in the sample preparation.References
- (1) Ginzburg V. L., Sov. Phys., JETP, 4, 153 (1957)
- (2) Matthias B., Suhl H. and Corenzwit E.,Phys. Rev. Lett., 1, 449 (1958).
- (3) Khan, H. R., Raub, C. J., Ann. Rev. Mater. Sci., 15, 211 (1985).
- (4) Sinha, K, Kakani, S.l., Magnetic superconductors. Recent developments, Nova Science Publisher, inc., New York,(1989).
- (5) Kakani, S. L., Upadhyaya, U. N., J. Low Temp. Phys.,70, 5 (1988).
- (6) Ishikawa, M., Fischer, A. L., Solid State Commun., 23, 37 (1977)
- (7) Hamakar, H. C., et al., Solid State Commun., 31, 139 (1979)
- (8) Maple, M. B., Physics Today, 39, 72 (1986).
- (9) Steglich, F., et al., Phys. Rev. Lett., 43, 1892 (1979)
- (10) G. P. Vassilev, X. J. Liu, K. Ishida,J. Phase Equil. Diff. 26, 161 (2005)
- (11) S. Park, K. Kangc, W. Hana, T. Vogt, J. Alloys Compd. 400, 88 (2005)
- (12) N. E. Alekseevskii, N. B. Brandt, and T. I. Kostina: Bull. Acad. Sci. URSS. 16(1952) 233; J. Exp. Theor. Phys. 21, 951 (1951)
- (13) Fujimori Y, Kan Sh-i, Shinozaki B, Kawaguti T., J. Phys. Soc. Jpn., 69, 3017 (2000), and references there in.
- (14) Yoshida H., et al., Magn. Magn. Mater., 239, 5 (2002).
- (15) Fjellvag H, Furuseth S, J. Less-Comm. Met. 128, 177 (1987).
- (16) Young, R. A., The Rietveld Method, International Union of Crystallography, Oxford University Press, New York (1993).
- (17) Lai C. C., Lin T. Y., Chin. J. Phys., 28, 4 (1990).
- (18) Li L. F., et al., Physica C, 470, 313 (2010).
- (19) Kittel, C., Introduction to Solid State Physics, ed., John Wiley Sons, inc., New York (1993).