Vacancy ordering and phonon spectrum in the Fe superconductor K0.8Fe1.6Se2
Abstract
We have performed Raman-scattering measurements on a high-quality single crystal of the recently discovered Fe-based superconductor K0.8Fe1.6Se2 ( = 32 K). At least thirteen phonon modes were observed in the wave number range 10300 cm-1. The spectra possess a four-fold symmetry indicative of bulk vacancy order in the Fe-deficient planes. We perform a vibration analysis based on first-principles calculations, which both confirms the ordered structure and allows a complete mode assignment. We observe an anomaly at in the 180 cm-1 mode, which indicates a rather specific type of electron-phonon coupling.
pacs:
74.70.-b, 74.25.Kc, 63.20.kd, 78.30.-jI Introduction
Since the discovery of high- Fe-based superconductors almost three years ago, much effort has been devoted both to exploring their physical properties and to the search for new materials in this class. Until recently, five such systems had been synthesized and studied, among which Fe(Se,Te) is of particular interest as the first Fe-based superconductor not requiring the poisonous element As. Although the superconducting transition temperature () is low, it has been found for FeSe that a maximum of 37 K is obtained under a pressure of 6 GPa.FeSe37K This strong dependence has inspired efforts to find new FeSe-based superconductors by introducing internal chemical pressure.MKWu This idea was realized very recently in K0.8Fe2Se2,XLChen where K is close to that of the “122” materials. The system was also identified as being isostructural with BaFe2As2.XLChen Several groups have now reported similar values by substitution of other alkali metals, including Rb and Cs.AFeSe
The electronic and magnetic properties of the AxFe2-ySe2 compounds have been probed extensively. Angle-resolved photoemission spectroscopy (ARPES) measurementsARPES ; newARPES agree on the presence of one Fermi surface around the M point, and on a conventional -wave pairing symmetry, but differ on further details. Nuclear magnetic resonance (NMR) measurements in superconducting crystals find very narrow line widths,NMR strong coupling, singlet superconductivity but with no coherence peak, and very weak spin fluctuations.NMR ; NMR2 ; NMRorder Infrared optical conductivity measurements have identified the parent compound as a small-gap semiconductor and not a Mott insulator.Infrared Neutron diffraction studies find a very large ordered moment and high magnetic transition temperature.wbnd High-pressure experiments by several groups have led to contradictions which indicate extreme sensitivity to the nature of the defects.Pressure
These high-pressure measurements are not the only indications for a crucial role of Fe vacancies. Superconductivity itself occurs only in Fe-deficient samples. A broad resistivity peak around 150 K is reduced dramatically by altering the Fe content.GFChen The unexpected abundance of infrared-active phonon modesInfrared may also be attributed to Fe vacancies. Resolving the distribution of Fe vacancies on the microscopic level is clearly essential for a full understanding of the electronic and magnetic properties. A study exploiting the unique sensitivity of Raman scattering to probe local lattice symmetries is thus required.
Here we measure Raman-scattering spectra in a high-quality superconducting crystal of K0.8Fe1.6Se2, as described in Sec. II. Our results, presented in Sec. III, contain at least thirteen phonon modes, far more than would be expected for a normal 122 structure. The spectra we obtain by rotating the crystal show a four-fold symmetry, which we identify as C4h or C4. These results indicate an ordered structure of Fe vacancies, and in Sec. IV we assume the highest-symmetry defect configuration to perform a first-principles vibration analysis. The calculated mode frequencies and symmetry assignments are fully consistent with our data, confirming completely the vacancy ordering pattern. Our temperature-dependent spectra, shown in Sec. V, reveal one specific mode with a clear frequency jump at , which suggests a close connection between phonons and superconductivity. Section VI contains a brief summary.
II Material and Method
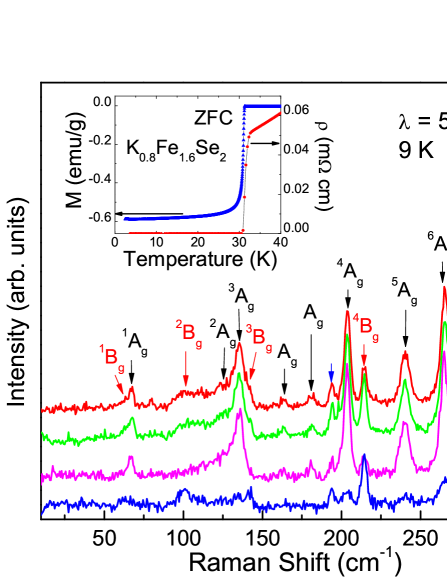
The crystal was grown by the Bridgeman method. The detailed growth procedure may be found elsewhere.GFChen The most accurate available composition determination is the neutron diffraction refinement,wbnd which gives K0.8Fe1.6Se2. X-ray diffraction patterns indicate no discernible secondary phase. The resistivity was measured by a Quantum Design PPMS and the magnetization by the PPMS vibrating sample magnetometer (VSM): both quantities, shown in the inset of Fig. 1, exhibit transitions at 32 K, the diamagnetic transition appearing particularly sharp. Although the precise demagnetization factor is not available, the estimated superconducting volume fraction is (from the sharp diamagnetism and absence of a secondary phase) close to 100%. These results indicate that the crystal is of very high quality.
The crystal was cleaved in a glove box and a flat, shiny surface was obtained. The surface is parallel to the ()-plane, and forms the basal plane for our Raman measurements. The two pieces of freshly-cleaved crystal were sealed under an argon atmosphere: one was transferred into the cryostat within 30 seconds for Raman-scattering studies and the other used for symmetry investigations by rotating the crystal. The cryostat was evacuated immediately to a work vacuum of approximately mbar. Raman measurements were performed in a pseudo-backscattering configuration with a triple-grating monochromator (Jobin Yvon T64000), delivering a spectral resolution better than 0.6 cm-1. The light source is a 532 nm solid-state laser (Torus 532, Laser Quantum) whose beam was focused into a spot of diameter ca. 10–20 m on the sample surface. The beam power is lower than 1 mW, and the real temperature at the spot was calibrated using the intensity relation between the Stokes and anti-Stokes spectra.
III Phonon Raman Spectra: Symmetry and Vacancy Order
The phonon modes of K0.8Fe1.6Se2 are shown in the low-temperature spectra of Fig. 1. The most striking feature is that at least thirteen modes are present in the spectra collected with both parallel and cross-polarization configurations. All of these modes are located below 300 cm-1 (Fig. 4 illustrates this most clearly). Our results are therefore consistent both by number and location with the infrared optical spectra.Infrared We stress that only four Raman-active modes are present in 122,Iliev to which K0.8Fe1.6Se2 was thought to be isostructural, and that the spectra of Fig. 1 are completely different from those observed in Fe(Se,Te).QMZhang The surprisingly large number of Raman and infrared phonon modes reinforces the assumption that the Fe deficiency drives a local breaking of lattice symmetry. A vibration analysis of the modes in Fig. 1, which we perform below, is thus significantly more complicated than for 122 and requires additional structural information.
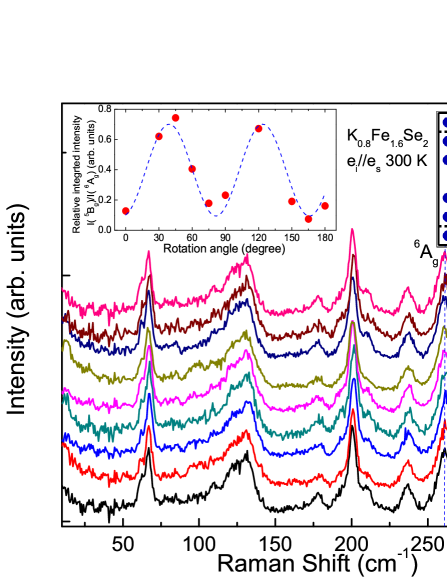
In Fig. 2 we present spectra obtained by rotating the crystal. These display clearly a four-fold symmetry, which is highlighted in the right inset. A formal analysis based on four-fold symmetry proceeds as follows. There are two possible Raman tensors, one for / and the other for /.Hayes If is defined as the angle between the crystallographic -axis and the polarization of the incident light, and as the angle between the polarizations of the incident and scattered light, then the angle-dependences of the Raman intensities for / take the form
| (1) |
where , , , and are matrix elements of the Raman tensors, and depend on linear combinations of polarizability derivatives for the atoms involved in each mode. Similarly, for / one has
| (2) |
Because rotating the crystal varies the angle , it is clear that modes with constant intensities are all -type (, , , or ), while those showing an intensity modulation are -type. Further, Eq. (2) prohibits the observation of -type modes in symmetry in a cross-polarized configuration (), which contradicts the observations in Fig. 1. Thus our results exclude explicitly the D4h symmetry expected for the 122 structure, and allow us to deduce that the crystal symmetry is C4h or C4. The -type modes in Fig. 1 may therefore be identified as or phonons. This symmetry constrains very strongly the possible vacancy ordering patterns.
Indications for vacancy ordering in AxFe2-ySe2 systems have been obtained in several recent measurements. Imaging by transmission electron microscopy (TEM)rTEM reveals rather well-defined surface order for and . NMR measurementsNMRorder find additional line-splittings. While Raman scattering is a surface technique, the wavelength, laser spot size (10-20 m), and penetration depth mean that macroscopic symmetries are probed. The 20% vacancy concentration in our crystal () suggests the structure illustrated in the inset of Fig. 2: this arrangement has a unit cell, has local four-fold symmetry, and, crucially, has lost the two mirror planes perpendicular to the -plane, in complete consistency with our Raman measurements. This microscopic structure has been demonstrated spectacularly by the very recent neutron diffraction studies of Ref. wbnd, . X-ray diffraction studies of several crystals with –0.39 have confirmed this result.rXRD
IV First-Principles Calculations
To compare with the observed phonon modes, we have calculated the nonmagnetic electronic structure and zone-center phonons of K0.8Fe1.6Se2 from first-principles density functional calculations. We use the Vienna ab-initio simulation package,kresse which is based on the projector augmented wave (PAW) methodpaw with a general gradient approximation (GGA)pbe for exchange-correlation potentials. The structural information determined by neutron diffractionwbnd is that K0.8Fe1.6Se2 has space group I4/m and point group . The Wyckoff positions of the K, Fe, and Se atoms and the corresponding symmetry analysis are listed in Table I. The frequencies and displacement patterns of the phonon modes were calculated using the dynamical matrix method.liu05
| Atom | Wyckoff | Optical modes | ||
|---|---|---|---|---|
| position | Raman active | Infrared active | ||
| K | 8h | |||
| Fe | 16i | |||
| Se | 4e | |||
| Se | 16i | |||
| Expt. Freq. | Cal. Freq. | Symmetry Atoms Index | ||
| (cm-1) | (cm-1) | |||
| 61.4 | 66.7 | Se | ||
| 66.3 | 75.1 | Se | ||
| 100.6 | 106.2 | K | ||
| 123.8 | 130.5 | Se | ||
| 134.6 | 159.2 | Se | ||
| 141.7 | 149.0 | Se | ||
| 202.9 | 212.6 | Se | ||
| 214.3 | 238.3 | Fe | ||
| 239.4 | 268.5 | Fe | ||
| 264.6 | 286.1 | Fe,Se | ||
| 274.9 | 279.0 | Fe | ||
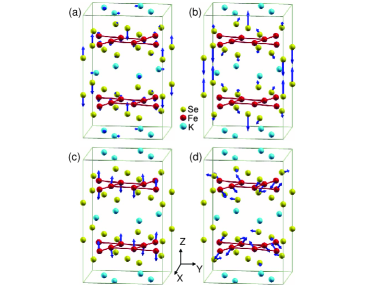
In total, 17 and modes are allowed by the crystal symmetry, among which 11 of the modes in the polarized Raman spectra of Fig. 1 may be assigned accurately from the calculations (Table I). The vibration patterns of selected modes are shown in Fig. 3. The calculated phonon frequencies, 75.1 and 212.6 cm-1 for modes [Fig. 3(a) and (b)] and 238.3 and 279.0 cm-1 for modes [Fig. 3(c) and (d)], agree very well with the 66.3, 202.9, 214.3, and 274.9 cm-1 modes in the experimental measurements. The and modes shown in Figs. 3(b) and (c) correspond exactly to the mode of As and mode of Fe in the 122 system.Iliev The success of the phonon assignment confirms completely the assumed pattern of vacancy ordering. Only three of the observed 13 modes cannot be assigned well, even though two have character. We suggest that these may originate from distortions of the Fe-Se layer, which lie outside the symmetry constraints applied.
V Temperature-Dependent Spectra
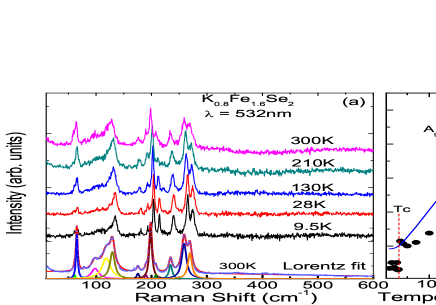
We have also measured Raman spectra over the full temperature range to 300 K [Fig. 4(a)]. The temperature-dependence of the phonon modes is described explicitly by fitting with Lorentz functions. All relative intensities show a conventional phonon form, with one exception (below). This line-shape analysis shows no evidence of the Fano asymmetry characteristic of electron-phonon coupling. However, all of the phonons are rather broad when compared with those in 122 systems,Iliev due perhaps to intrinsic disorder (incompletely ordered vacancies). This analysis alone cannot therefore exclude a generic electron-phonon coupling in K0.8Fe1.6Se2.
The mode at 66 cm-1 behaves rather anomalously. The steep fall in its relative intensity [Fig. 4(b)] follows a Bose-Einstein form only to lowest order, but with significant deviations. In addition to a clear intensity jump at , there is a further apparent anomaly around 160 K, where X-ray diffraction studies find no structural transition.Pressure We have confirmed (Table I) that the 66 cm-1 phonon is the vibration mode of a Se atom, and suggest that this is the origin of its unusual behavior.
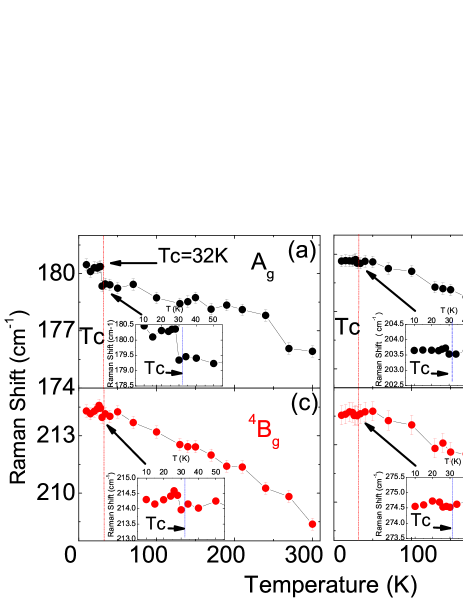
The temperature-dependence of selected phonon frequencies is shown in Fig. 5. The superconducting transition has very little effect on the frequency in every case but one: the mode at 180 cm-1 exhibits a clear jump of approximately 1 cm-1 at [Fig. 5(a)]. This anomaly is definite evidence for a particular type of connection between phonons and superconductivity, and it constitutes a statement concerning both symmetry and energies. For the former, the symmetry relation between the superconducting gaps on the available Fermi surfaces should be consistent with . For the latter, we suggest that a coupling of this phonon mode to the superconducting quasiparticles may be visiblerslin in ARPES spectra, where it should be expected at energies 2025 meV and at the point (the part of the Brillouin zone probed by Raman scattering). Anomalous features are indeed present in this region in the two most recent ARPES studies of AxFe2-ySe2 superconductors,newARPES and we propose that high-resolution ARPES measurements may reveal the physics behind this phenomenon.
VI Summary
To conclude, we have performed Raman-scattering measurements on the recently discovered Fe-based superconductor K0.8Fe1.6Se2. Using a high-quality single crystal, we find that there exist at least thirteen phonon modes and that the spectra have four-fold symmetry. This demonstrates the presence of long-range-ordered configurations of Fe vacancies, which dictate the local lattice vibrations. We perform first-principles calculations to obtain a complete and consistent phonon assignment, confirming the nature of the vacancy ordering pattern. We find that only one mode exhibits a change in frequency around , suggesting a rather specific connection between superconductivity and lattice vibrations.
Acknowledgements.
We thank W. Bao and Z. Y. Lu for helpful discussions. This work was supported by the 973 program under Grant No. 2011CBA00112, by the NSF of China under Grant Nos. 11034012 and 11004243, by the Fundamental Research Funds for Central Universities, and by the Research Funds of Renmin University.References
- (1) S. Margadonna et al., Phys. Rev. 80, 064506 (2009).
- (2) M. K. Wu et al., Physica C 469, 340 (2009).
- (3) J. G. Guo et al., Phys. Rev. B 82, 180520(R) (2010).
- (4) Y. Mizuguchi et al., Appl. Phys. Lett. 98, 042511 (2011); A. Krzton-Maziopa et al., J. Phys.: Condens. Matter 23, 052203 (2011); A. F. Wang et al., Phys. Rev. B 83, 060512(2011); J. J. Ying et al., Phys. Rev. B 83, 212502(2011); C. H. Li et al., Phys. Rev. B 83, 184521(2011); H. D. Wang et al., Europhys. Lett 93, 47004 (2011).
- (5) D. M. Wang, J. B. He, T.-L. Xia, and G. F. Chen, Phys. Rev. B 83, 132502(2011) .
- (6) Y. Zhang et al., Nature Materials 10, 273 (2011); T. Qian et al., Phys. Rev. Lett. 106, 187001(2011).
- (7) D. X. Mou et al., Phys. Rev. Lett. bf 106, 107001(2011); X. P. Wang et al., Europhys. Lett. 93, 57001 (2011).
- (8) W. Yu et al., Phys. Rev. Lett. 106, 197001(2011).
- (9) H. Kotegawa et al., J. Phys. Soc. Jpn. 80, 043708(2011).
- (10) D. A. Torchetti et al., Phys. Rev. B 83, 104508(2011).
- (11) Z. G. Chen et al., Phys. Rev B 83, 220507(R) (2011).
- (12) W. Bao et al., Chin. Phys. Lett. 28, 086104 (2011).
- (13) J. Guo et al., unpublished (arXiv:1101.0092); Y. Kawasaki et al., unpublished (arXiv:1101.0896); J. J. Ying et al., New J. of Phys. 13, 033008(2011).
- (14) A. P. Litvinchuk et al., Phys. Rev. B 78, 060503 (2008).
- (15) T.-L. Xia et al., Phys. Rev. B. 79, 140510(R) (2009).
- (16) O. Tiedje et al., Phys. Rev. B 67, 134105 (2003).
- (17) Z. Wang et al., Phys. Rev. B 83, 140505(R) (2011).
- (18) P. Zavalij et al., Phys. Rev. B 83, 132509 (2011).
- (19) Z. X. Shen, A. Lanzara, S. Ishihara, and N. Nagaosa. Phil. Mag. B 82, 1349 (2002).
- (20) G. Kresse and J. Hafner, Phys. Rev. B 47, 558 (1993); G. Kresse and J. Furthmüller, ibid. 54, 11169 (1996).
- (21) P. E. Blöchl, Phys. Rev. B 50, 17 953 (1994); G. Kresse and D. Joubert, Phys. Rev. B 59, 1758 (1999).
- (22) J. P. Perdew, K. Burke, and M. Ernzerhof. Phys. Rev. Lett. 77 3865 (1996).
- (23) K. Liu and S. Gao, Phys. Rev. Lett. 95, 226102 (2005).
- (24) A. Kokalj, Comp. Mater. Sci. 28, 155 (2003).
- (25) W. Hayes and R. Loudon, Scattering of Light by Crystals (John Wiley, New York, 1978).