Observing peculiar -ray pulsars with AGILE
Abstract
The AGILE -ray satellite provides large sky exposure levels (109 cm2 s per year on the Galactic Plane) with sensitivity peaking at 100 MeV where the bulk of pulsar energy output is typically released. Its 1 s absolute time tagging capability makes it perfectly suited for the study of -ray pulsars. AGILE collected a large number of -ray photons from EGRET pulsars (40,000 pulsed counts for Vela) in two years of observations unveiling new interesting features at sub-millisecond level in the pulsars’ high-energy light-curves, -ray emission from pulsar glitches and Pulsar Wind Nebulae. AGILE detected about 20 nearby and energetic pulsars with good confidence through timing and/or spatial analysis. Among the newcomers we find pulsars with very high rotational energy losses, such as the remarkable PSR B1509–58 with a magnetic field in excess of 1013 Gauss, and PSR J2229+6114 providing a reliable identification for the previously unidentified EGRET source 3EG 2227+6122. Moreover, the powerful millisecond pulsar B1821–24, in the globular cluster M28, is detected during a fraction of the observations.
Keywords:
gamma-ray observations – gamma-ray sources – pulsars:
95.85.Pw, 98.70.Rz, 97.60.Gb1 Introduction
Poor -ray pulsar statistics has been a major difficulty in assessing the dominant mechanism which channels pulsar rotational energy into high energy emission as well as understanding the sites where charged particles are accelerated. The large field of view of the AGILE Gamma-Ray Imaging Detector (GRID) Tavani et al. (2009) allows long uninterrupted observations and simultaneous monitoring of tens of nearby radio pulsars belonging to the “-ray pulsar region” of the – diagram characterized by G and spin-down energy erg s-1 Pellizzoni et al. (2004). Here we present the results of three years of pulsar observations with AGILE.
2 AGILE Observations and Timing
Pulsar data were collected since the early phases of the mission. Timing observations suitable for pulsed signal analysis started in July 2007. AGILE pointings consisted of long exposures slightly drifting with respect to the starting pointing direction. At the end of October 2009 AGILE started observing in spinning mode due to reaction wheel failure, which is not affecting AGILE/GRID sensitivity and pulsar observations. Data screening, particle background filtering and event direction and energy reconstruction were performed by the AGILE Standard Analysis Pipeline. We adopted the AGILE event extraction criteria and timing procedures calibrated and optimized with the observations of known -ray pulsars as described in Pellizzoni et al. (2009a).
Given the measured AGILE’s time tagging accuracy of 200 s and the good radio monitoring (i.e. valid epoch range, adequate number of time of arrivals (ToAs)) available for the majority of our targets, the most significant pulsed signal detection is typically expected within the errors of the radio ephemeris frequency values. In particular, we performed standard epoch folding and hen adequate radio observations covering the time span of the -ray observations are available (i.e. where the terms are included in TEMPO2 ephemeris files), we account also for the pulsar timing noise in the folding procedure as reported in Pellizzoni et al. (2009a) over a frequency range defined according to 3 errors of radio ephemeris. Pearson’s statistics is applied to the 10-bin folded pulse profiles resulting from each set of spin parameters, yielding the probabilities (weighted for the number of trials performed on the data set) of sampling a uniform distribution, assessing the significance of the pulsed signal (sinusoidal or not). Furthermore, we verified our timing results also applying bin-independent parameter-free statistics as the test and the -test that are typically more sensitive than tests for the search of sinusoidal pulses. Firstly, for each target we searched for pulsed signal using the whole available data span. Later, each observation block was analysed to check for possible flux and/or pulse profile variability. We also performed a maximum likelihood analysis (ALIKE task) on the AGILE data for the regions containing our targets in order to exploit the instrument’s imaging capabilities to assess -ray source parameters. Here, we will focus predominantly on the timing analysis.
In order to perform AGILE timing calibration through accurate folding and phasing a dedicated radio pulsar monitoring campaign (that will continue during the whole AGILE mission) was undertaken, using the telescopes of the European Pulsar Timing Array, as well as the telescopes of Parkes in Australia and Mt Pleasant in Tasmania. Geminga is a radio-quiet pulsar whose ephemeris can be obtained from the regular X-ray observations by XMM-Newton. In order to verify the performances of the timing analysis procedure described above, a crucial parameter to check is the difference between pulsar rotation parameters derived from radio, X-ray and -ray data. The implementation of the folding method described in Pellizzoni et al. (2009a) allowed for a perfect match between the best period resulting from -ray data and the period predicted by the radio ephemeris with discrepancies s, comparable to the period search resolution s. Ignoring timing noise in the folding process would yield discrepancies (and light curve smearing) which are expected to grow when considering longer observing time span. Thus the contribution of timing noise should be considered both in high-resolution timing analysis and in searching for new -ray pulsars.


3 ”Old” and New -Ray Pulsars
The resulting high-energy light-curves for Vela, Crab, Geminga and PSR B 1706–44 pulsars are shown in Figure 1 together with a sample of newly discovered -ray pulsars.
The availability of radio observations bracketing the time span of the -ray observations (or of X-ray observations very close to the -ray observations for Geminga) allowed us to also perform accurate phasing of multi-wavelength light-curves. We found that the phasing of the AGILE light-curves of the four pulsars (radio/X-rays/-ray peaks phase separations) is consistent with EGRET measurements (see Pellizzoni et al. (2009a) for details) implying no evidence of systematic errors in absolute timing with an upper limit ms. The resulting fluxes (Pulsed Counts/Exposure) are also consistent with those reported in the EGRET Catalogue.
The Crab SuperAGILE light-curve (ref) was produced with the same folding method reported for the GRID. Inspection of Figure 1 shows that the X-ray peaks are aligned with the MeV data within s (a value obtained fitting the peaks with Gaussians) providing an additional test of the AGILE phasing accuracy.
The effective time resolution of the light-curves will obviously improve with exposure time and a resolution 50 s was obtained after two years of AGILE observations of Vela.
Although AGILE multi-wavelength phasing of the four -ray pulsars is consistent with the results obtained by EGRET, the plots shown in Figure 1 allow us to start assessing new features in -ray pulsar light-curves. Narrower and better resolved main peaks are revealed, together with previously unknown secondary features. In particular, a third peak is possibly detected at 3.7 level in the Crab light-curve (P3 in Figure 1) and some interesting features seem present in the Vela light-curves (confirmed by recent Fermi observations Abdo et al. (2010a)).
In any case, the highly structured light-curves hint at a complex scenario for the sites of particle acceleration in the pulsar magnetospheres, implying different electric gaps with physical properties probably mostly related to their height above the neutron star surface. Alternatively, slight spatial oscillations of the gap locations on timescales 1 day could be invoked to explain the multiple contiguous peaks seen in the light-curves.
In this perspective, the AGILE light-curves time resolution, currently limited only by the (continuously increasing) source counts statistics, will eventually yield a pulsar gaps map (e.g. parametrized with adjustable accelerating electric fields strength, and location in the magnetosphere) by coupling timing analysis and phase resolved spectral analysis.
The long monitoring of Vela pulsar (40,000 pulsed counts in two years of observations) allowed us to detect possible -ray emission from pulsar glitches Pellizzoni et al. (2009a).
Furthermore, the Vela pulsar wind nebula was recently firmly detected by AGILE constraining the particle population responsible for the GeV emission and establishing a class of -ray emitters that could account for a fraction of the unidentified galactic -ray sources Pellizzoni et al. (2010) (see last Section)
The radio-aligned light-curves of a subset of newly discovered -ray pulsars for which our timing analysis yielded a 4 detection are also plotted in Figure 1. We note that in all cases radio and -ray timing results are compatible, with the highest significance frequency detected in -rays within the errors of the radio ephemeris value, considering also the period search resolution. Furthermore, we verified that our analysis procedure (potentially affected by instrument-related systematic errors and biases in events extraction criteria) does not produce fake detections at a significance level above 3 when the radio-ephemeris are applied to randomly extracted AGILE data. The most significant detection is PSR J2229+6114 for which AGILE detected pulsed emission (radio/-ray periods discrepancy s) and pinpointed the most likely position to 0.2 deg from the radio pulsar. Our detection provides a reliable identification for the previously unidentified EGRET source 3EG 2227+6122. The AGILE source position, pulsed flux, and photon index (2.2) are consistent with the EGRET values. The -ray light-curve of this pulsar (detected up to over 1 GeV), featuring just one prominent peak shifted 180 deg in phase from the radio main peak, is shown in Figure 1.
PSR J1513–5908 (B1509–58) was detected by COMPTEL in the 1-10 MeV range, while EGRET reported only marginal evidence for a weak 4 source at 1 deg from the radio position, with a pulsed emission upper limit of ph cm-2 s-1 (see dedicated section).
At variance with all the other targets, the millisencond pulsar J1824–2452 in the Globular Cluster M28 was detected by AGILE, with good significance (4) and perfect radio- periods match, only in the time interval 54339–54344 MJD. The main radio peak at 1.4 GHz is coincident with the broad single peak seen in -rays. Only marginal detection was obtained integrating other observations with comparable exposure or the whole data span. Noise fluctuations could possibly explain the apparent variability. Alternatively, although its -ray efficiency and high-stability of spin parameters are compatible with rotation-powered emission, some additional mechanism disturbing the neutron star magnetosphere in the dense cluster environment could be invoked to explain the variable -ray phenomenology of this peculiar pulsar. AGILE timing failures at sub-millisecond level in some observations (mimiking source variability) cannot be excluded. However, this seems unlikely, since we verified both timing accuracy and stability at 200 s level with Vela pulsar observations. Confirmation of this tantalizing result about physical variability will rest on longer monitoring campaigns.

4 The “soft” PSR B1509–58: a new class of -ray pulsars?
PSR B1509–58 has a period ms and a period derivative s s-1: assuming the standard dipole vacuum model, the estimated spin-down age for this pulsar is 1570 years and its inferred surface magnetic field is one of the highest observed for an ordinary radio pulsar: G, as calculated at the pole; its rotational energy loss rate is erg/s.
The young age and the high rotational energy loss rate made this pulsar a promising target for the -ray satellites. In fact, the instruments on board of the CGRO observed its pulsation at low -ray energies, but it was not detected with high significance by EGRET. AGILE obtained the first detection of PSR B1509–58 in the EGRET band Pellizzoni et al. (2009b) confirming the occurrence of a spectral break. We then presented the results of a yr monitoring campaign of PSR B1509–58 with AGILE, improving counts statistics, and therefore lightcurve characterization, with respect to earlier AGILE observations Pilia et al. (2010).
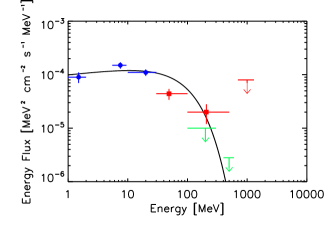
AGILE devoted a large amount of observing time to the region of PSR B1509–58. We observed PSR B1509–58 in three energy bands: 30–100 MeV, 100–500 MeV and above 500 MeV. We did not detect pulsed emission at a significance for MeV. The -ray lightcurves of PSR B1509–58 for different energy bands are shown in Fig. 2. The AGILE MeV lightcurve shows two peaks. The first peak is coincident in phase with COMPTEL’s peak Kuiper et al. (1999). In its highest energy band (10–30 MeV) COMPTEL showed the indication of a second peak (even though the modulation had low significance, ). This second peak is coincident in phase with AGILE’s second peak (Fig. 2). AGILE thus confirms the previously marginal detection of a second peak.
Based on our exposure we derived the -ray flux from the number of pulsed counts. The pulsed fluxes in the three AGILE energy bands were ph cm-2 s-1 in the 30–100 MeV band, ph cm-2 s-1 in the 100–500 MeV band and a upper limit ph cm-2 s-1 for MeV.
Fig. 2 shows the SED of PSR B1509–58 based on AGILE’s and COMPTEL’s observed fluxes. COMPTEL observations suggested a spectral break between 10 and 30 MeV. AGILE pulsed flux at energies MeV confirms the presence of a soft spectral break at MeV As shown in Fig. 2, we modeled the observed fluxes with a power-law plus cutoff fit: , with three free parameters: the normalization , the spectral index , the cutoff energy and allowing to assume values of 1 and 2. No acceptable values were obtained for , while for an we found for degrees of freedom, corresponding to a null hypothesis probability of 0.05. The best values thus obtained for the parameters of the fit were: , , MeV.
The bulk of the spin-powered pulsar flux is usually emitted in the MeV-GeV energy band with spectral breaks at GeV (e.g. Abdo et al. (2010c). PSR B1509–58 has the softest spectrum observed among -ray pulsars, with a sub-GeV cutoff at MeV.
When PSR B1509–58 was detected in soft -rays but not significantly at MeV, it was proposed that the mechanism responsible for this low-energy spectral break might be photon splitting Harding et al. (1997). The photon splitting Adler et al. (1970) is an exotic third-order quantum electro-dynamics process expected when the magnetic field approaches or exceeds the value defined as G. In very high magnetic fields the formation of pair cascades can be altered by the process of photon splitting: .
In the case of PSR B1509–58 a polar cap model with photon splitting would be able to explain the soft -ray emission and the low energy spectral cutoff, now quantified by AGILE observations. Based on the observed cutoff, which is related to the photons’ saturation escape energy, we can derive constraints on the magnetic field strength at emission, in the framework of photon splitting:
| (1) |
where is the photon saturation escape energy, and is the angle between the photon momentum and the magnetic field vectors at the surface and is here assumed to be very small: Harding et al. (1997). Using the observed cutoff ( MeV) we find that , which implies an emission altitude , which is the height where also pair production could ensue. This altitude of emission is in perfect agreement with the polar cap models Additionally, PSR B1509–58 Kuiper et al. (1999); Crawford et al. (2001) shows evidence of an aligned geometry, which could imply polar cap emission.
The polar cap model as an emission mechanism is debated. From the theoretical point of view, the angular momentum is not conserved in polar cap emission (see Treves et al. (2010) in this book). And a preferential explanation of the observed -ray lightcurves with high altitude cascades comes from the recent results by Fermi Abdo et al. (2010c).
Alternatively, an interpretation of PSR B1509–58 emission can be sought in the frame of the three dimensional outer gap model Zhang and Cheng (2000). According to these estimates a magnetic inclination angle and a viewing angle are required to reproduce the observed lightcurve. Finally, using the simulations of Watters et al. Watters et al. (2009), the observed lightcurve from AGILE is best reproduced if and , in the framework of the two pole caustic model.
The values of and required by the model in Zhang and Cheng (2000) are not in good agreement with the corresponding values obtained with radio measurements. In fact, Crawford et al. Crawford et al. (2001) observe that must be at the level. The prediction obtained by the simulations in Watters et al. (2009) better agrees with the radio polarization observations. In fact, Crawford et al. also propose that, if the restriction is imposed that Melatos (1997), then at the level. For these values, however, the Melatos model for the spin down of an oblique rotator predicts a braking index , slightly inconsistent with the observed value (). Therefore, at present the geometry privileged by the state of the art measurements is best compatible with polar cap models.
5 Pulsars and their environments
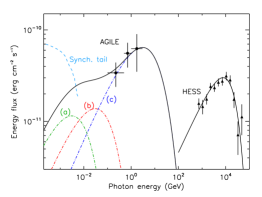
The Vela supernova remnant (SNR) is the nearest SNR (290 pc) containing a bright pulsar, PSR B0833-45. The detection of Vela X at TeV energies demonstrated that this source emits non-thermal radiation, in agreement with the hypothesis that it corresponds to the pulsar wind nebula, displaced to the south by the unequal pressure of the reverse shock from the SNR Blondin et al. (2001). The multiwavelength spectrum of the center of Vela X can be modeled as synchrotron radiation from energetic electrons within the cocoon (radio and x-rays) and inverse Compton emission from the scattering (by the same electron population) of the cosmic microwave background radiation (CMBR), the Galactic far-infrared radiation (FIR) produced by reradiation of dust grains, and the local starlight LaMassa et al. (2008); de Jager et al. (2008). Alternatively, a hadronic model can be invoked for the -ray emission from the Vela X cocoon, where the emission is the result of the decay of neutral pions produced in proton-proton collisions Horns et al. (2006). Observations in the MeV-GeV band (HE) are crucial to distinguish between leptonic and hadronic models as well as to identify specific particle populations and spectra.
With the aim of performing a sensitive search for close faint sources excluding the bright emission from the Vela pulsar, we discarded the time intervals corresponding to the phase interval 0.05–0.65. The analysis of the resulting off-pulse images unveiled few -ray sources, none of which coincides with the Vela pulsar. A maximum likelihood analysis, performed on the MeV dataset within a region of 5∘ around the pulsar position, revealed two sources at better than 3 confidence, the brightest of which, AGL J0834–4539 (5.9 significance, 264 counts, ph cm-2 s-1 at MeV), is positionally concident with HESS J0835–455, the TeV source that is identified with the Vela X nebula Aharonian et al. (2006), and has a similar brightness profile to it. This implies that AGL J0834–4539 is associated with the pulsar’s PWN.
The AGILE spectral points are a factor 2 below the previous EGRET upper limits de Jager et al. (1996) and well above the extrapolation of HESS spectrum to lower energies. In the frame of leptonic models, the AGILE measurements are not consistent with a simple multiwavelength spectral energy distribution involving a single electron population. The AGILE spectral points are one order of magnitude above the fluxes expected from the electron population simultaneously fitting synchrotron x-ray emission (peaking at 1 keV) and inverse-Compton (IC) TeV emission LaMassa et al. (2008). Additional electron populations should be invoked to explain the observed GeV fluxes. This is not surprising in view of the complex morphology of the PWN seen in radio and x-rays, where different sites and features of non-thermal emission are present. In fact, the position where AGILE sees the maximum brigthness is also roughly where the 8.4 GHz radio emission is brightest Hales et al. (2004). AGILE data are compatible with the IC parameters modelled by de Jager et al. (electron spectral index 1.78 and maximum energy 20 GeV), although our measurements could suggest a higher contribution from IC photon seeds. AGILE measurements would be incompatible with the scenario of nucleonic -ray production in the Vela TeV nebula in the frame of a single primary electron population.
References
- Tavani et al. (2009) M. Tavani, et al. , A&A 502, 995–1013 (2009).
- Pellizzoni et al. (2004) A. Pellizzoni, et al., ApJL 612, L49–L52 (2004).
- Pellizzoni et al. (2009a) A. Pellizzoni, et al., ApJ 691, 1618–1633 (2009a),
- Pellizzoni et al. (2009b) A. Pellizzoni, et al., ApJL 695, L115–L119 (2009b).
- Abdo et al. (2010a) A. A. Abdo, et al., ApJ 713, 154–165 (2010a).
- Pellizzoni et al. (2010) A. Pellizzoni, et al., Science 327, 663– (2010).
- Abdo et al. (2010b) A. A. Abdo, et al., ApJ 714, 927–936 (2010b).
- Kuiper et al. (1999) L. Kuiper, et al. , A&A 351, 119–132 (1999).
- Pilia et al. (2010) M. Pilia, et al. , ApJ 723, 707–712 (2010).
- Abdo et al. (2010c) A. A. Abdo, et al., ApJS 187, 460–494 (2010c).
- Adler et al. (1970) S. L. Adler, J. N. Bahcall, C. G. Callan, and M. N. Rosenbluth, PhRL 25, 1061–1065 (1970).
- Harding et al. (1997) A. K. Harding, M. G. Baring, and P. L. Gonthier, ApJ 476, 246–+ (1997).
- Crawford et al. (2001) F. Crawford, R. N. Manchester, and V. M. Kaspi, AJ 122, 2001–2007 (2001).
- Treves et al. (2010) A. Treves, M. Pilia, and M. Lopez Moya, ArXiv e-prints (2010), 1011.6562.
- Zhang and Cheng (2000) L. Zhang, and K. S. Cheng, A&A 363, 575–584 (2000).
- Watters et al. (2009) K. P. Watters, R. W. Romani, P. Weltevrede, and S. Johnston, ApJ 695, 1289–1301 (2009).
- Melatos (1997) A. Melatos, MNRAS 288, 1049+ (1997).
- Blondin et al. (2001) J. M. Blondin, R. A. Chevalier, and D. M. Frierson, ApJ 563, 806–815 (2001).
- LaMassa et al. (2008) S. M. LaMassa, P. O. Slane, and O. C. de Jager, ApJL 689, L121–L124 (2008).
- de Jager et al. (2008) O. C. de Jager, P. O. Slane, and S. LaMassa, ApJL 689, L125–L128 (2008).
- Horns et al. (2006) D. Horns, et al., A&A 451, L51–L54 (2006).
- de Jager et al. (1996) O. C. de Jager, A. K. Harding, P. Sreekumar, and M. Strickman, AAPS 120, C441+ (1996).
- Hales et al. (2004) A. S. Hales, et al., ApJ 613, 977–985 (2004).
- Aharonian et al. (2006) F. Aharonian, et al., A&A 448, L43+, (2006)